Basedash
- Role
- Founding designer
- Location
- Remote
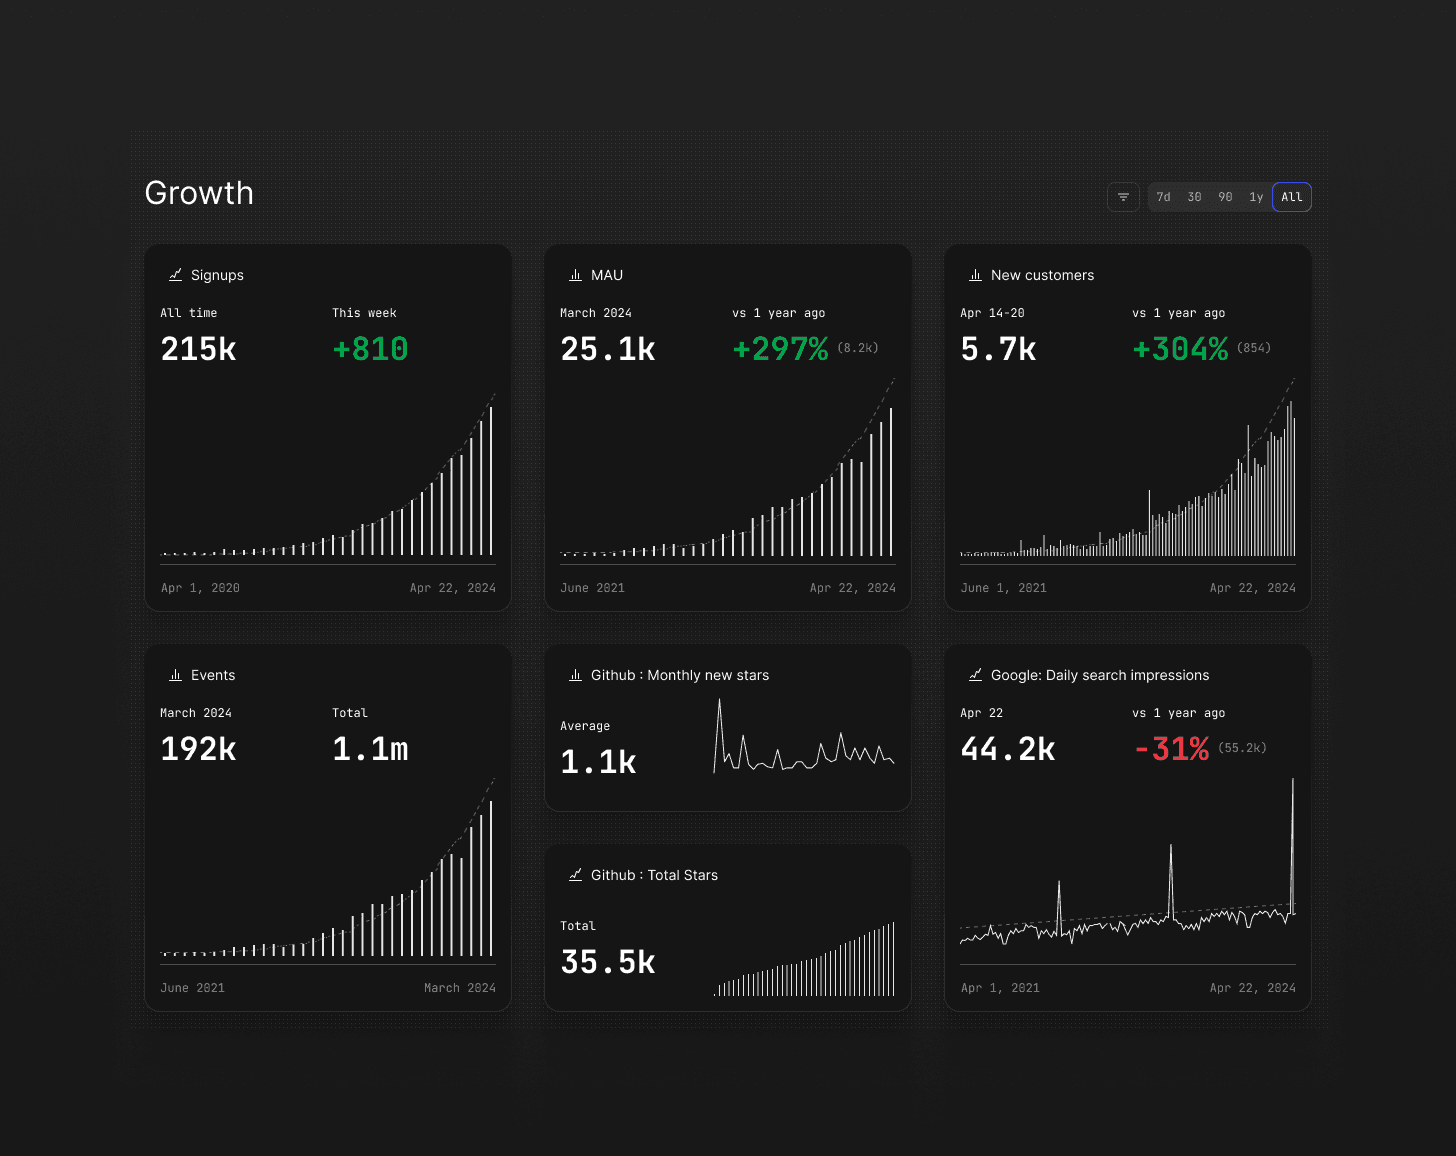
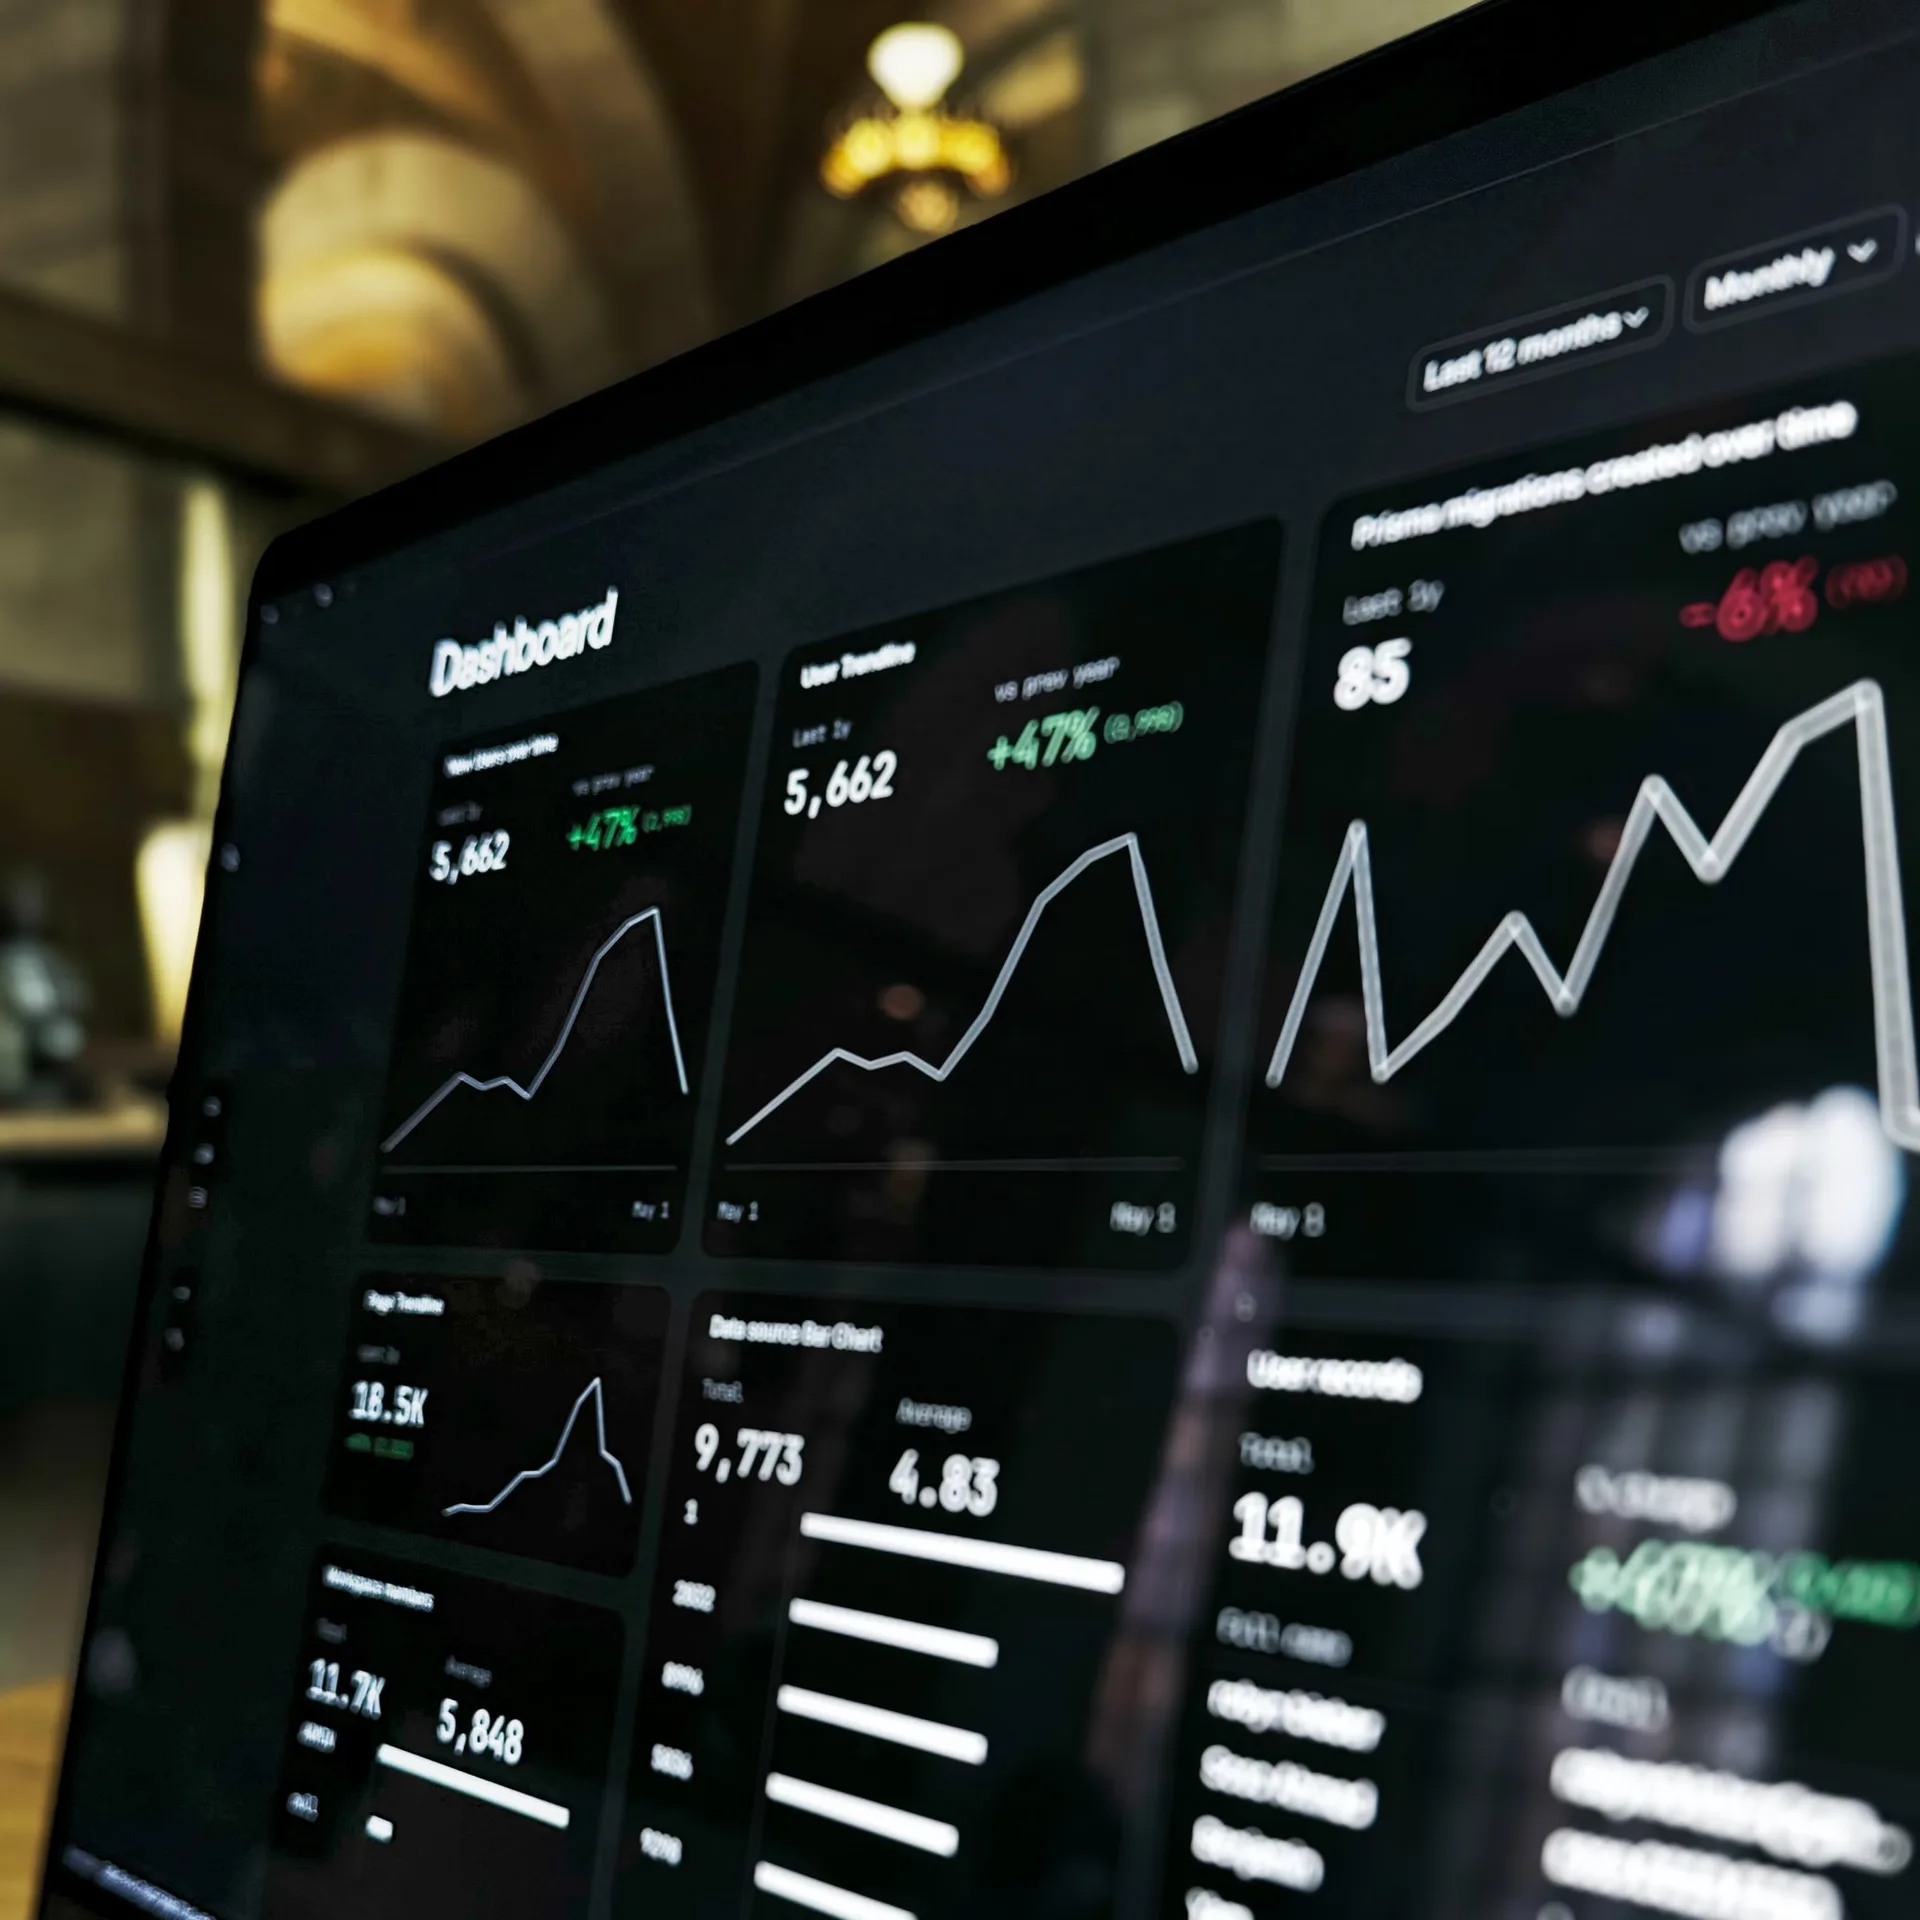
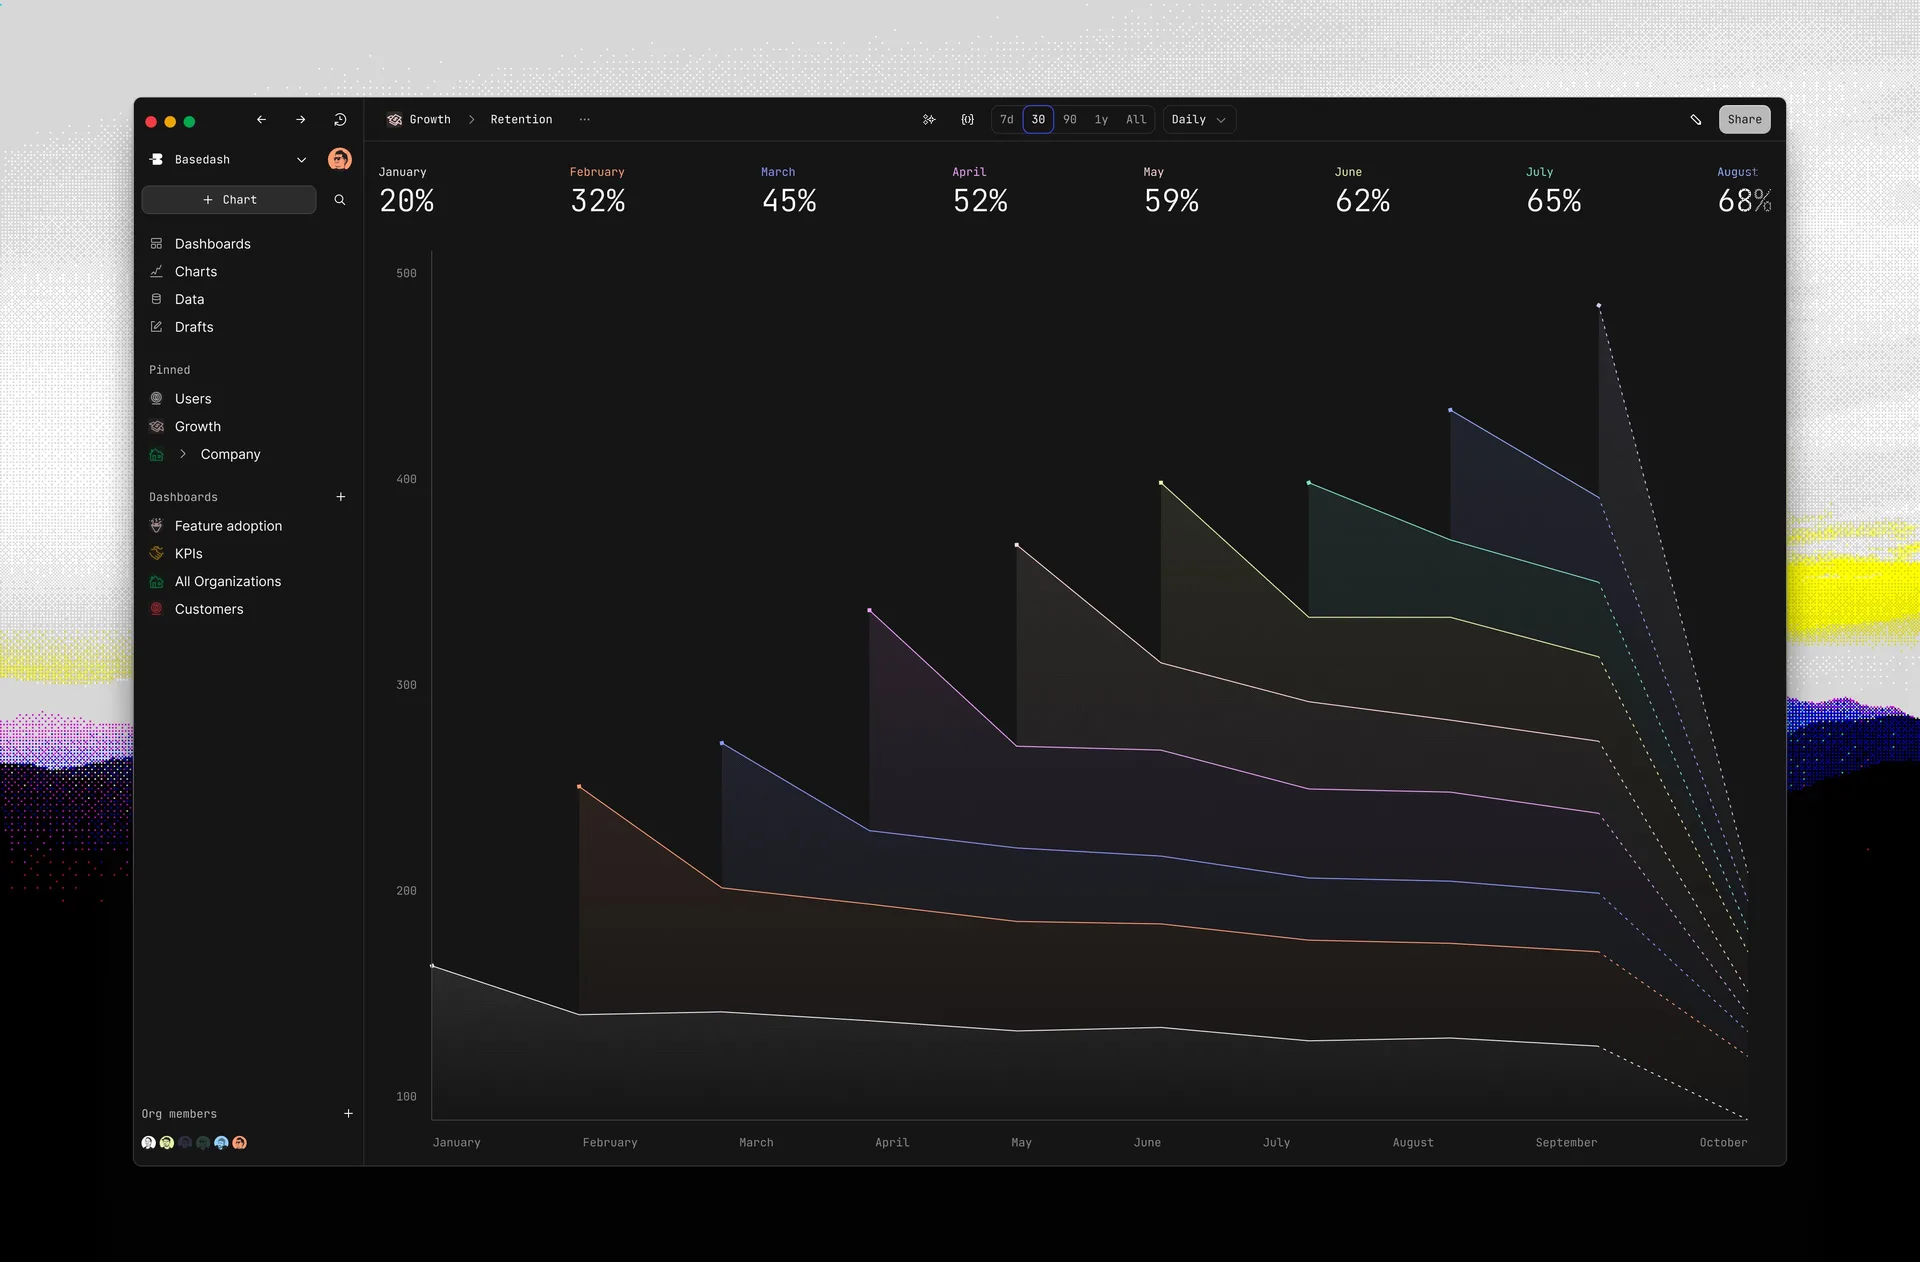
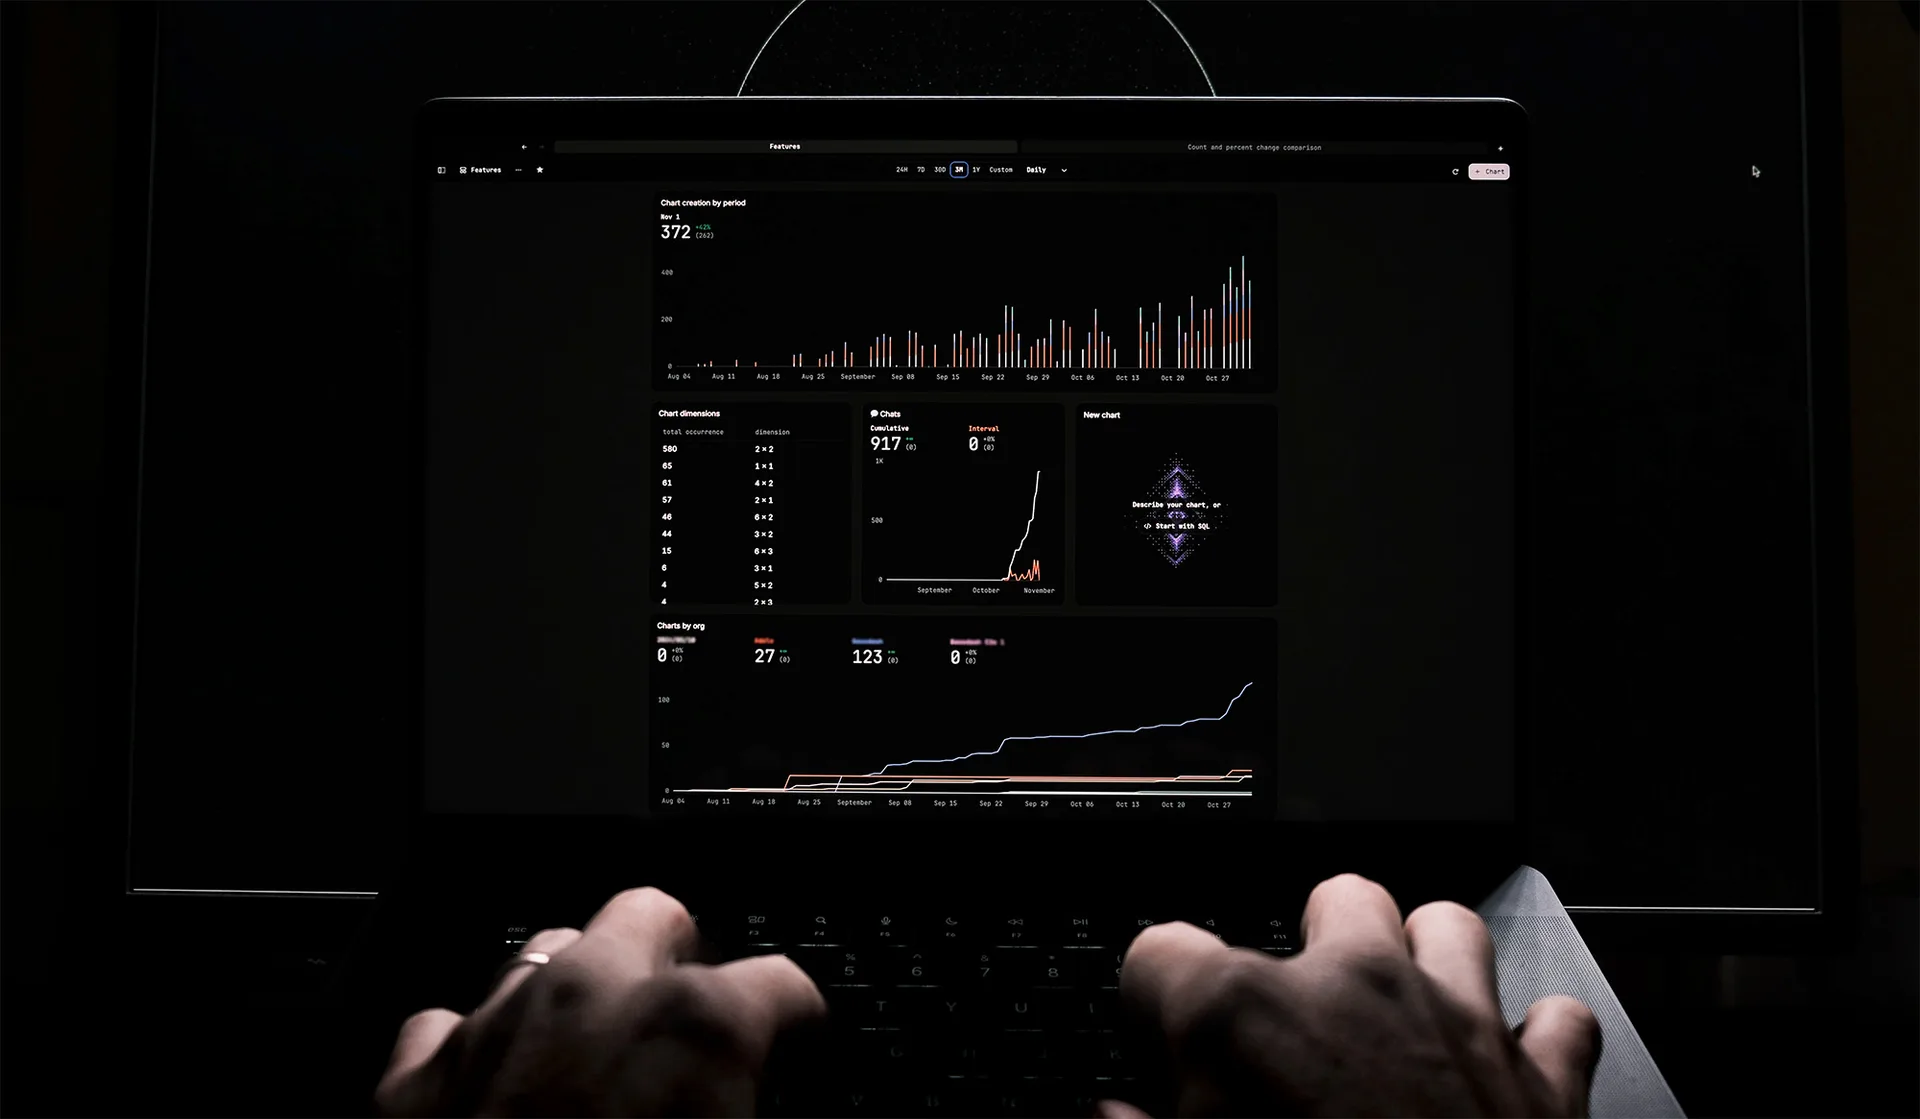
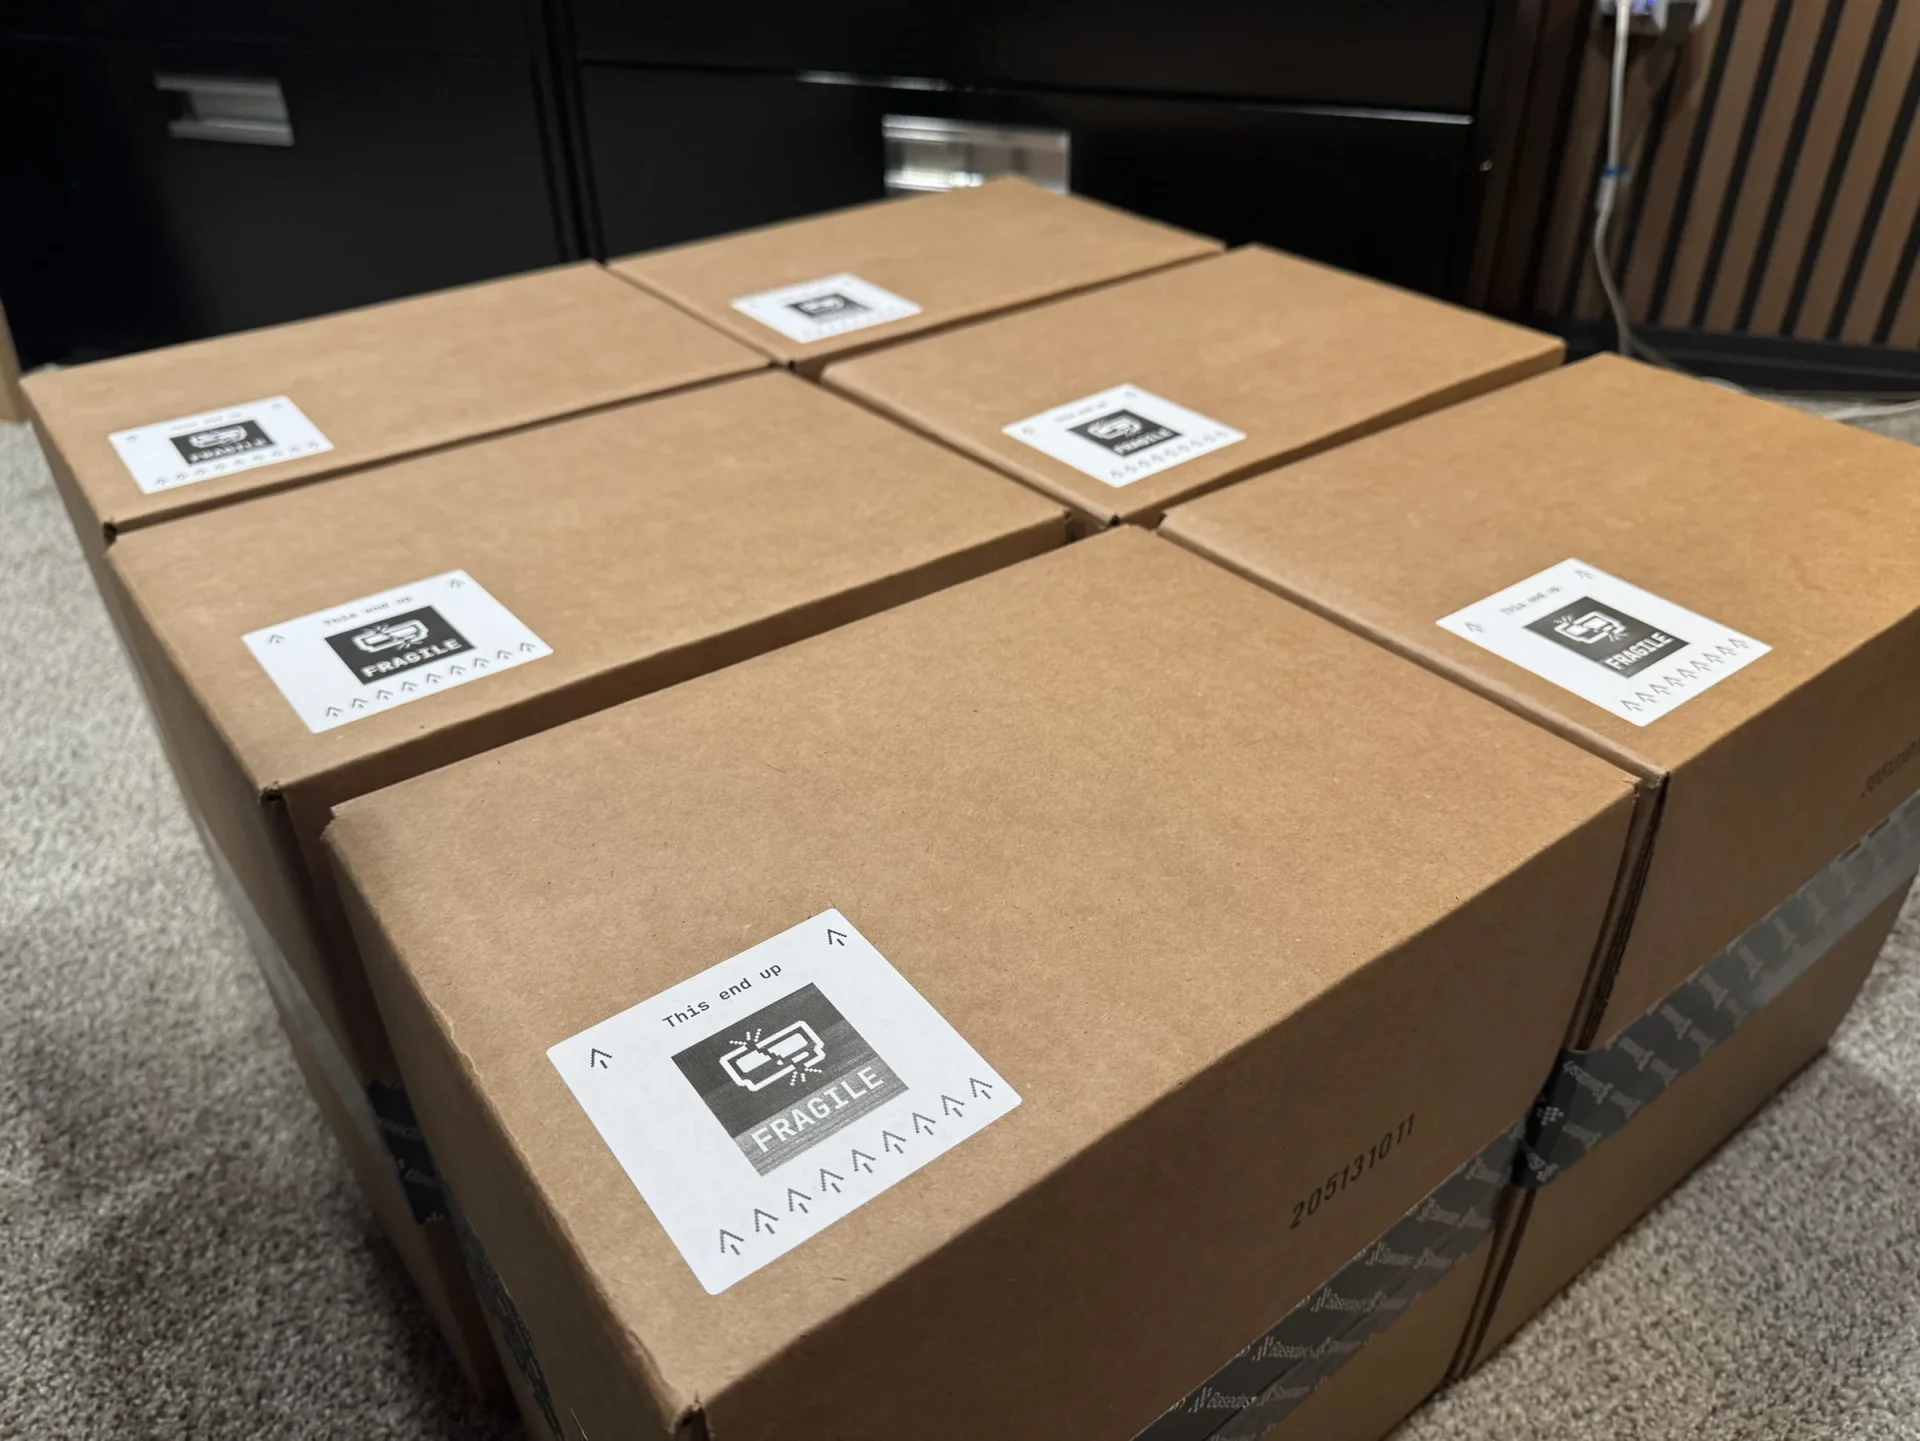
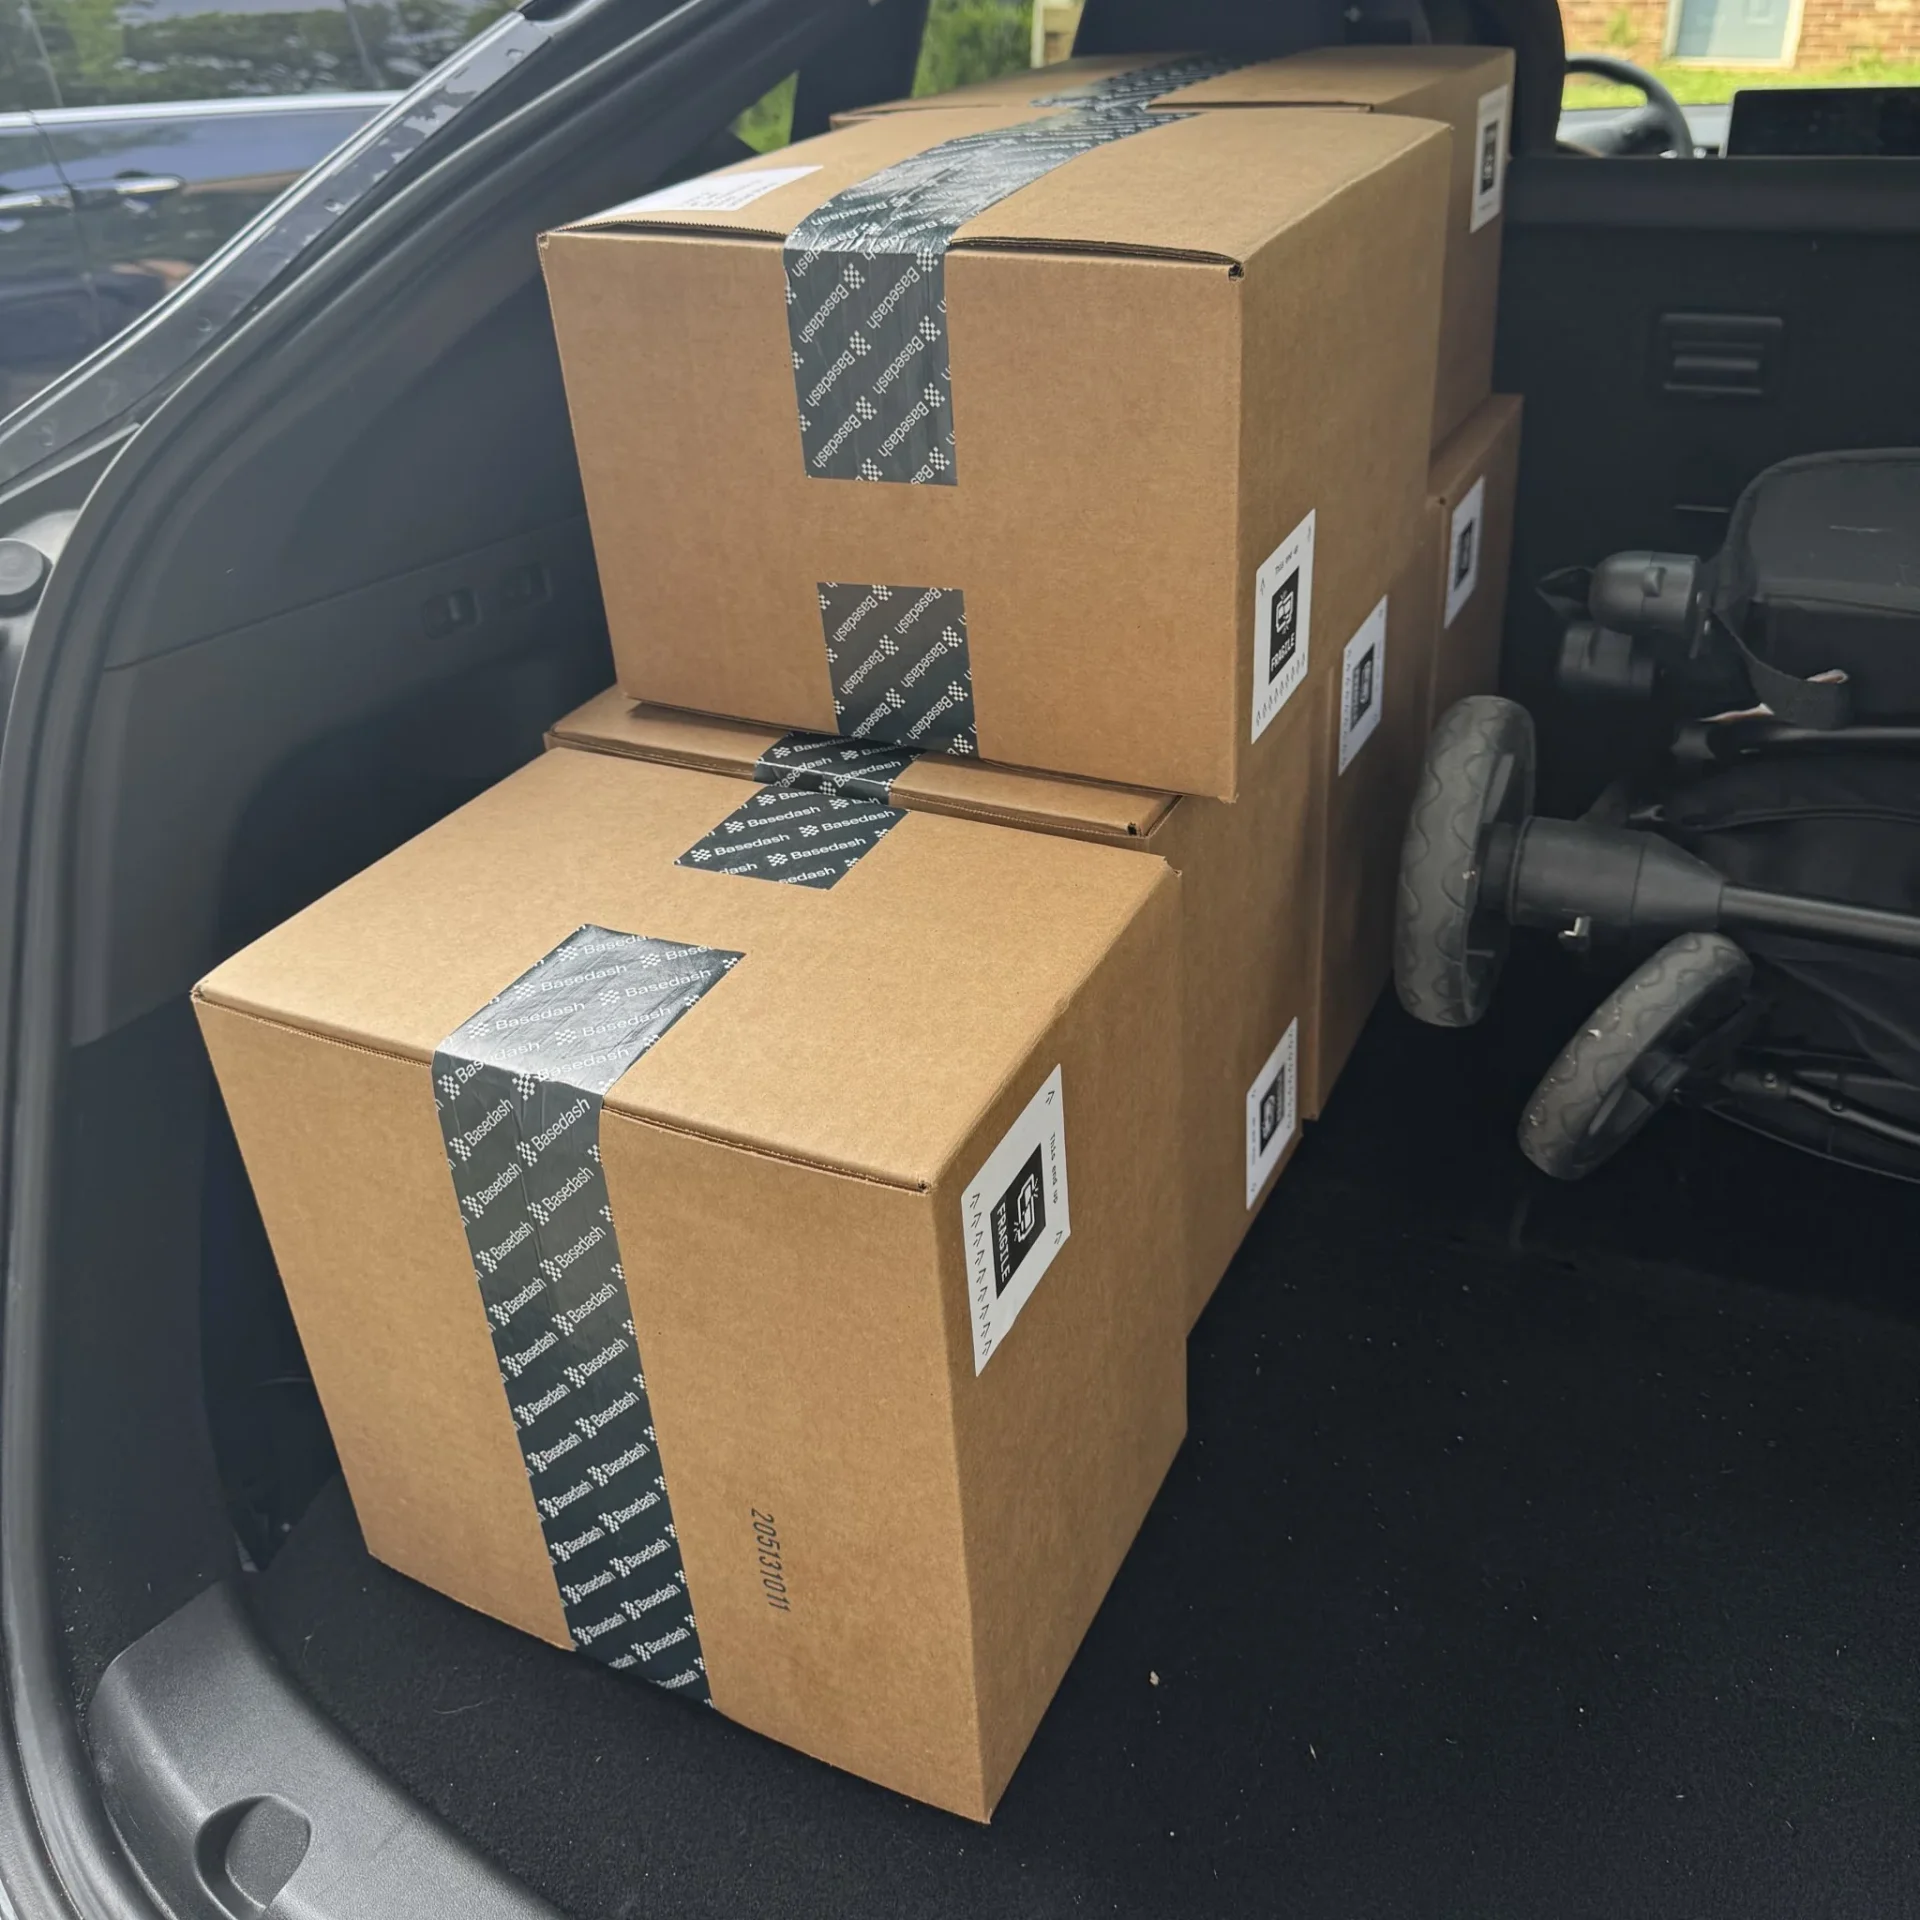
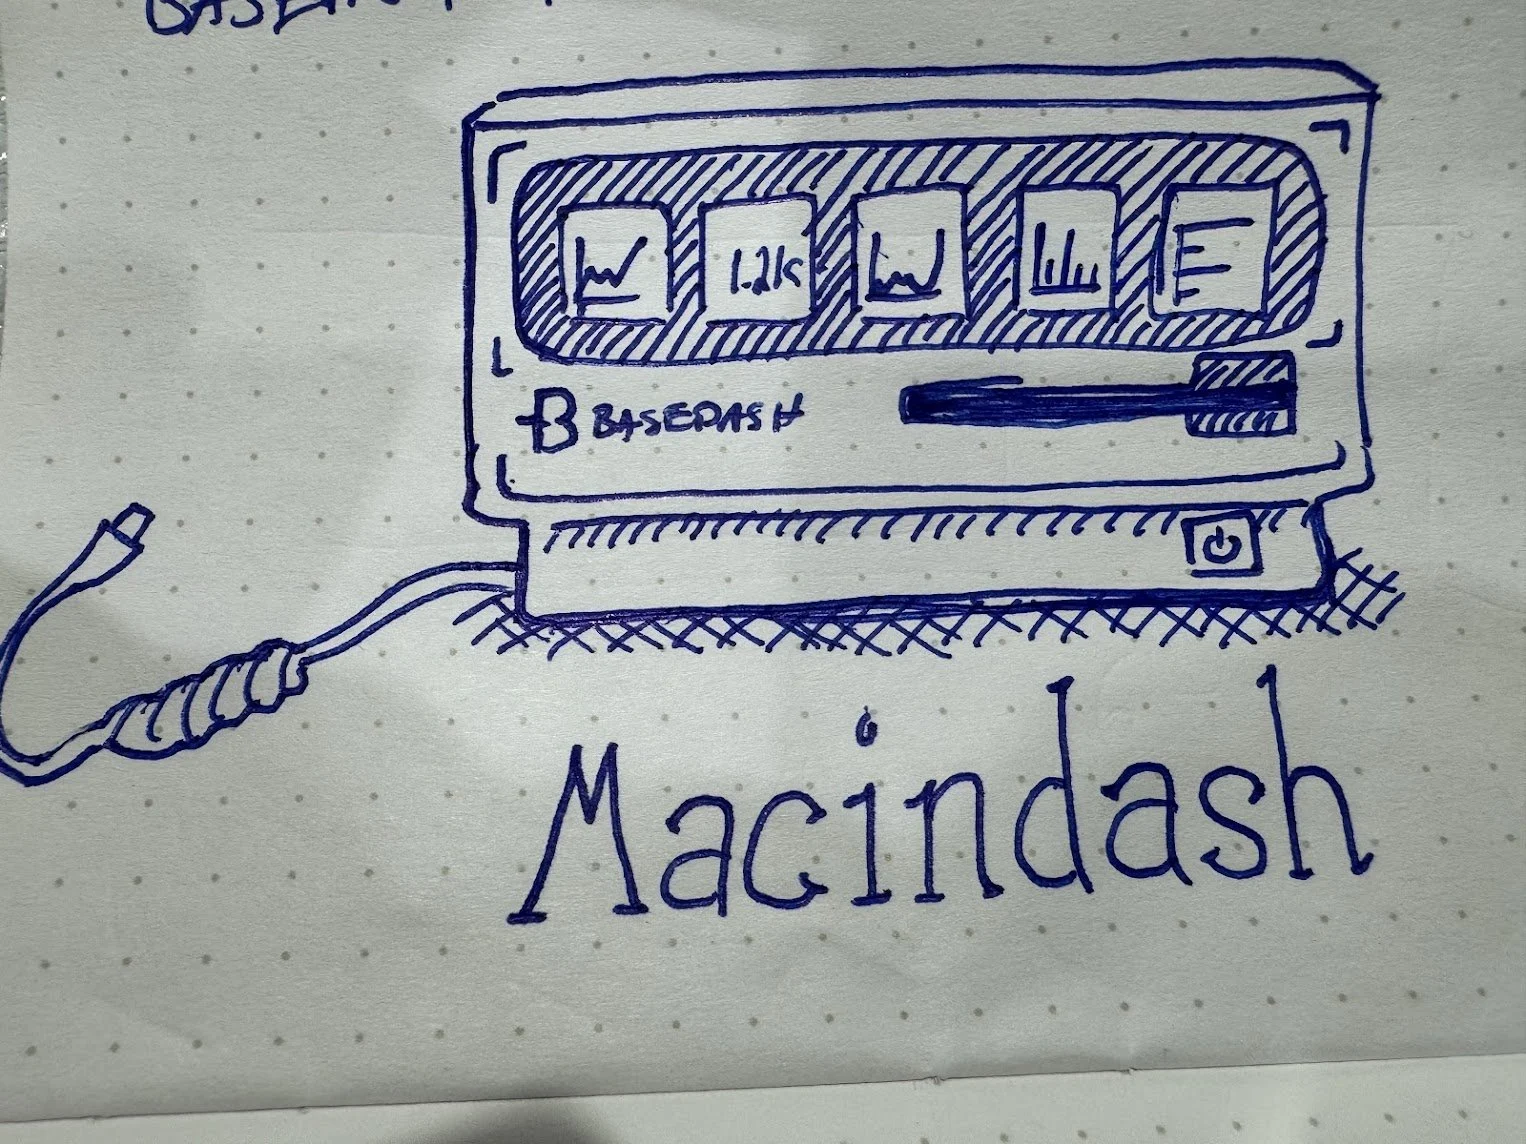
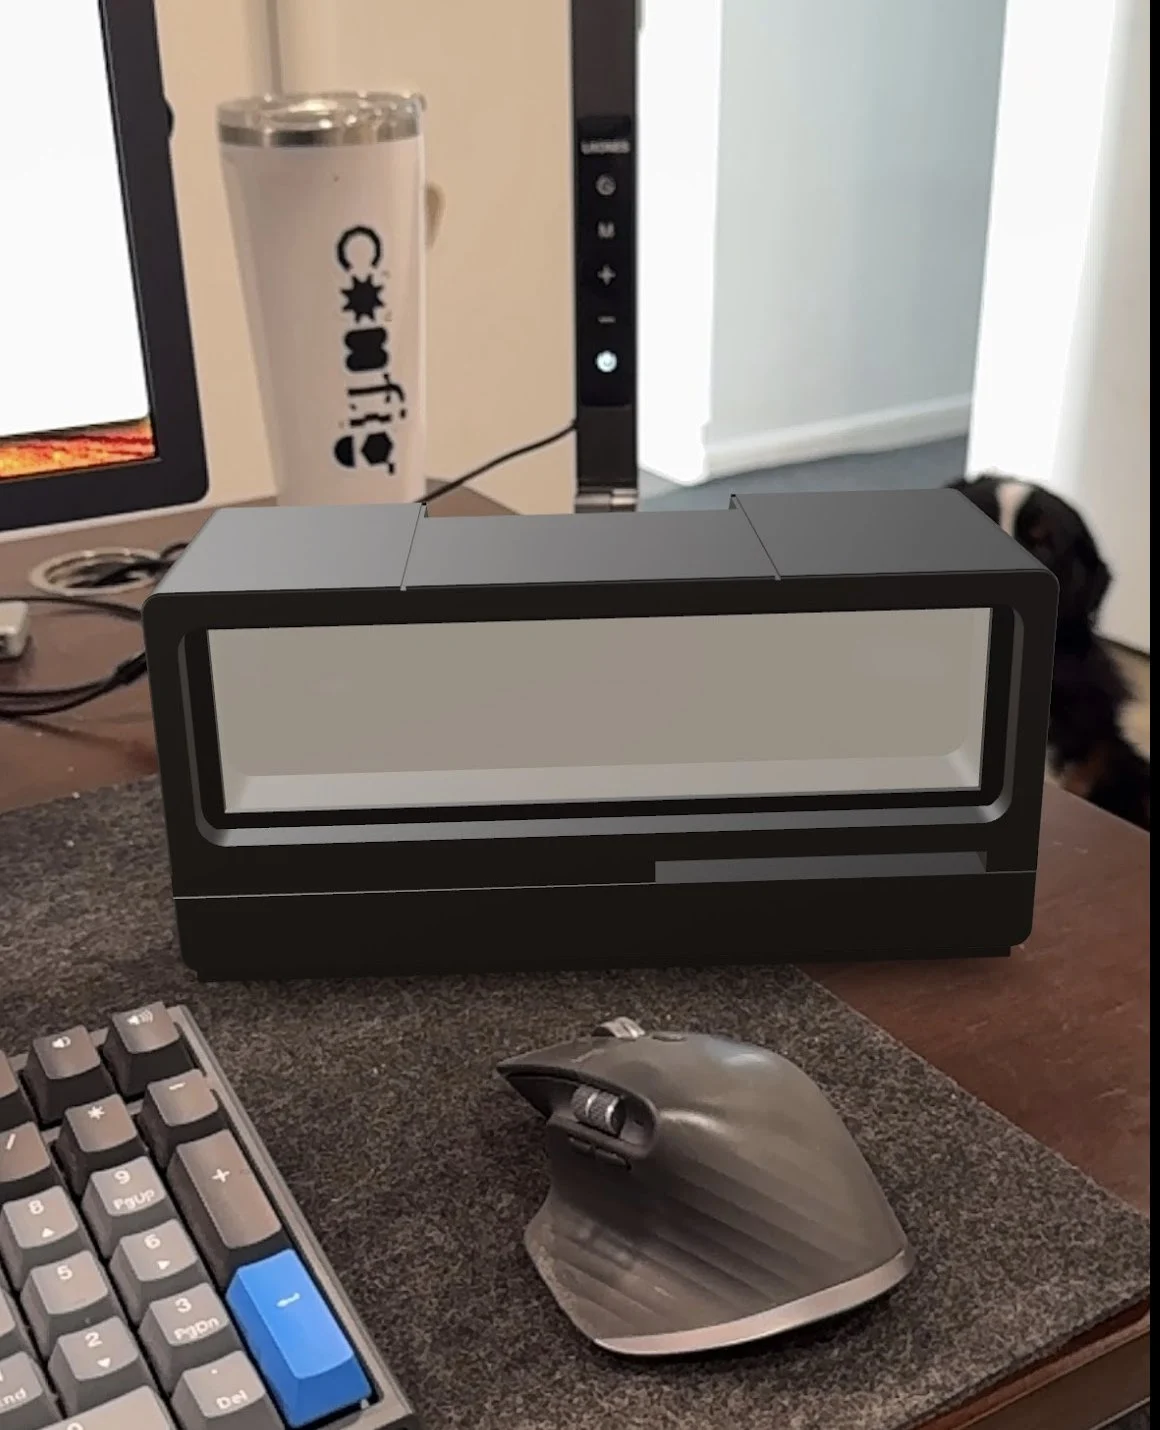
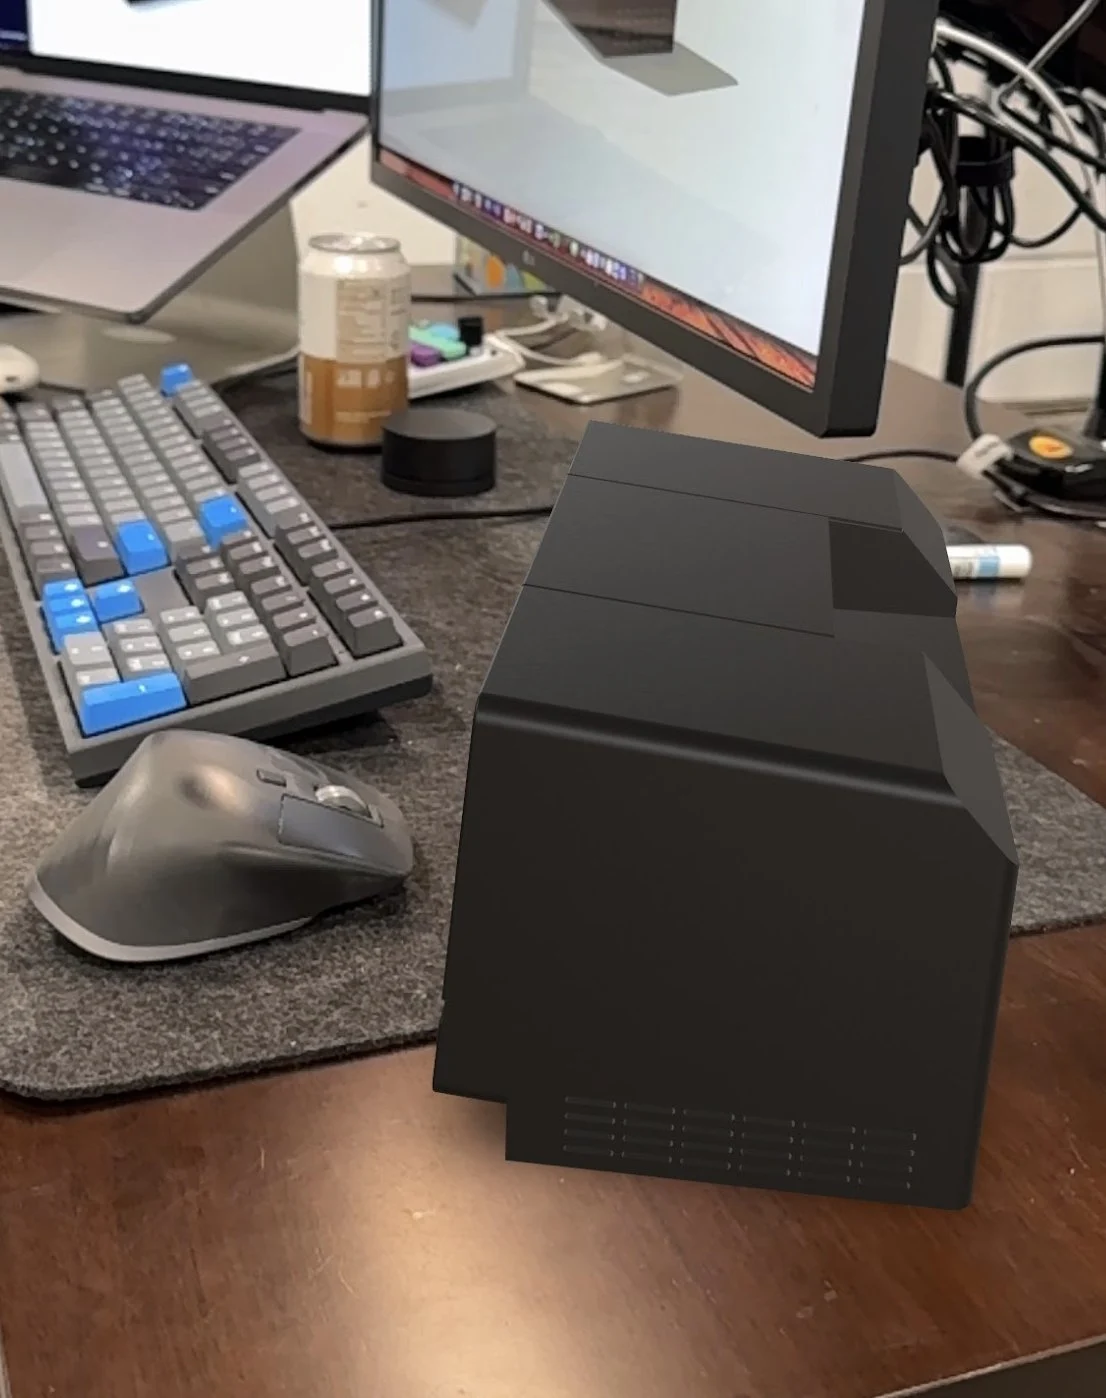
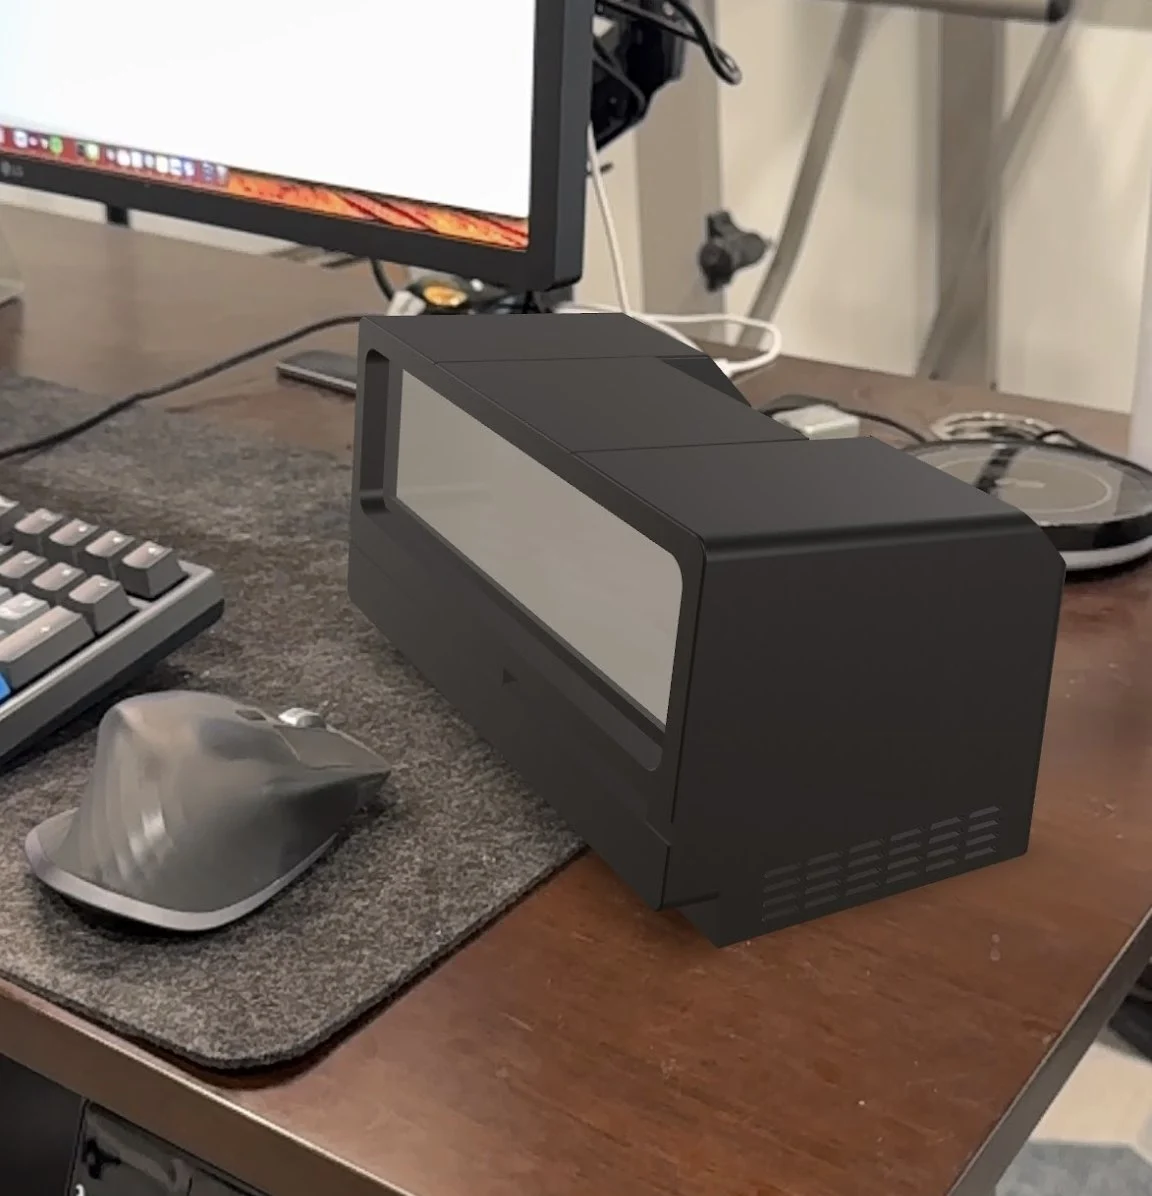
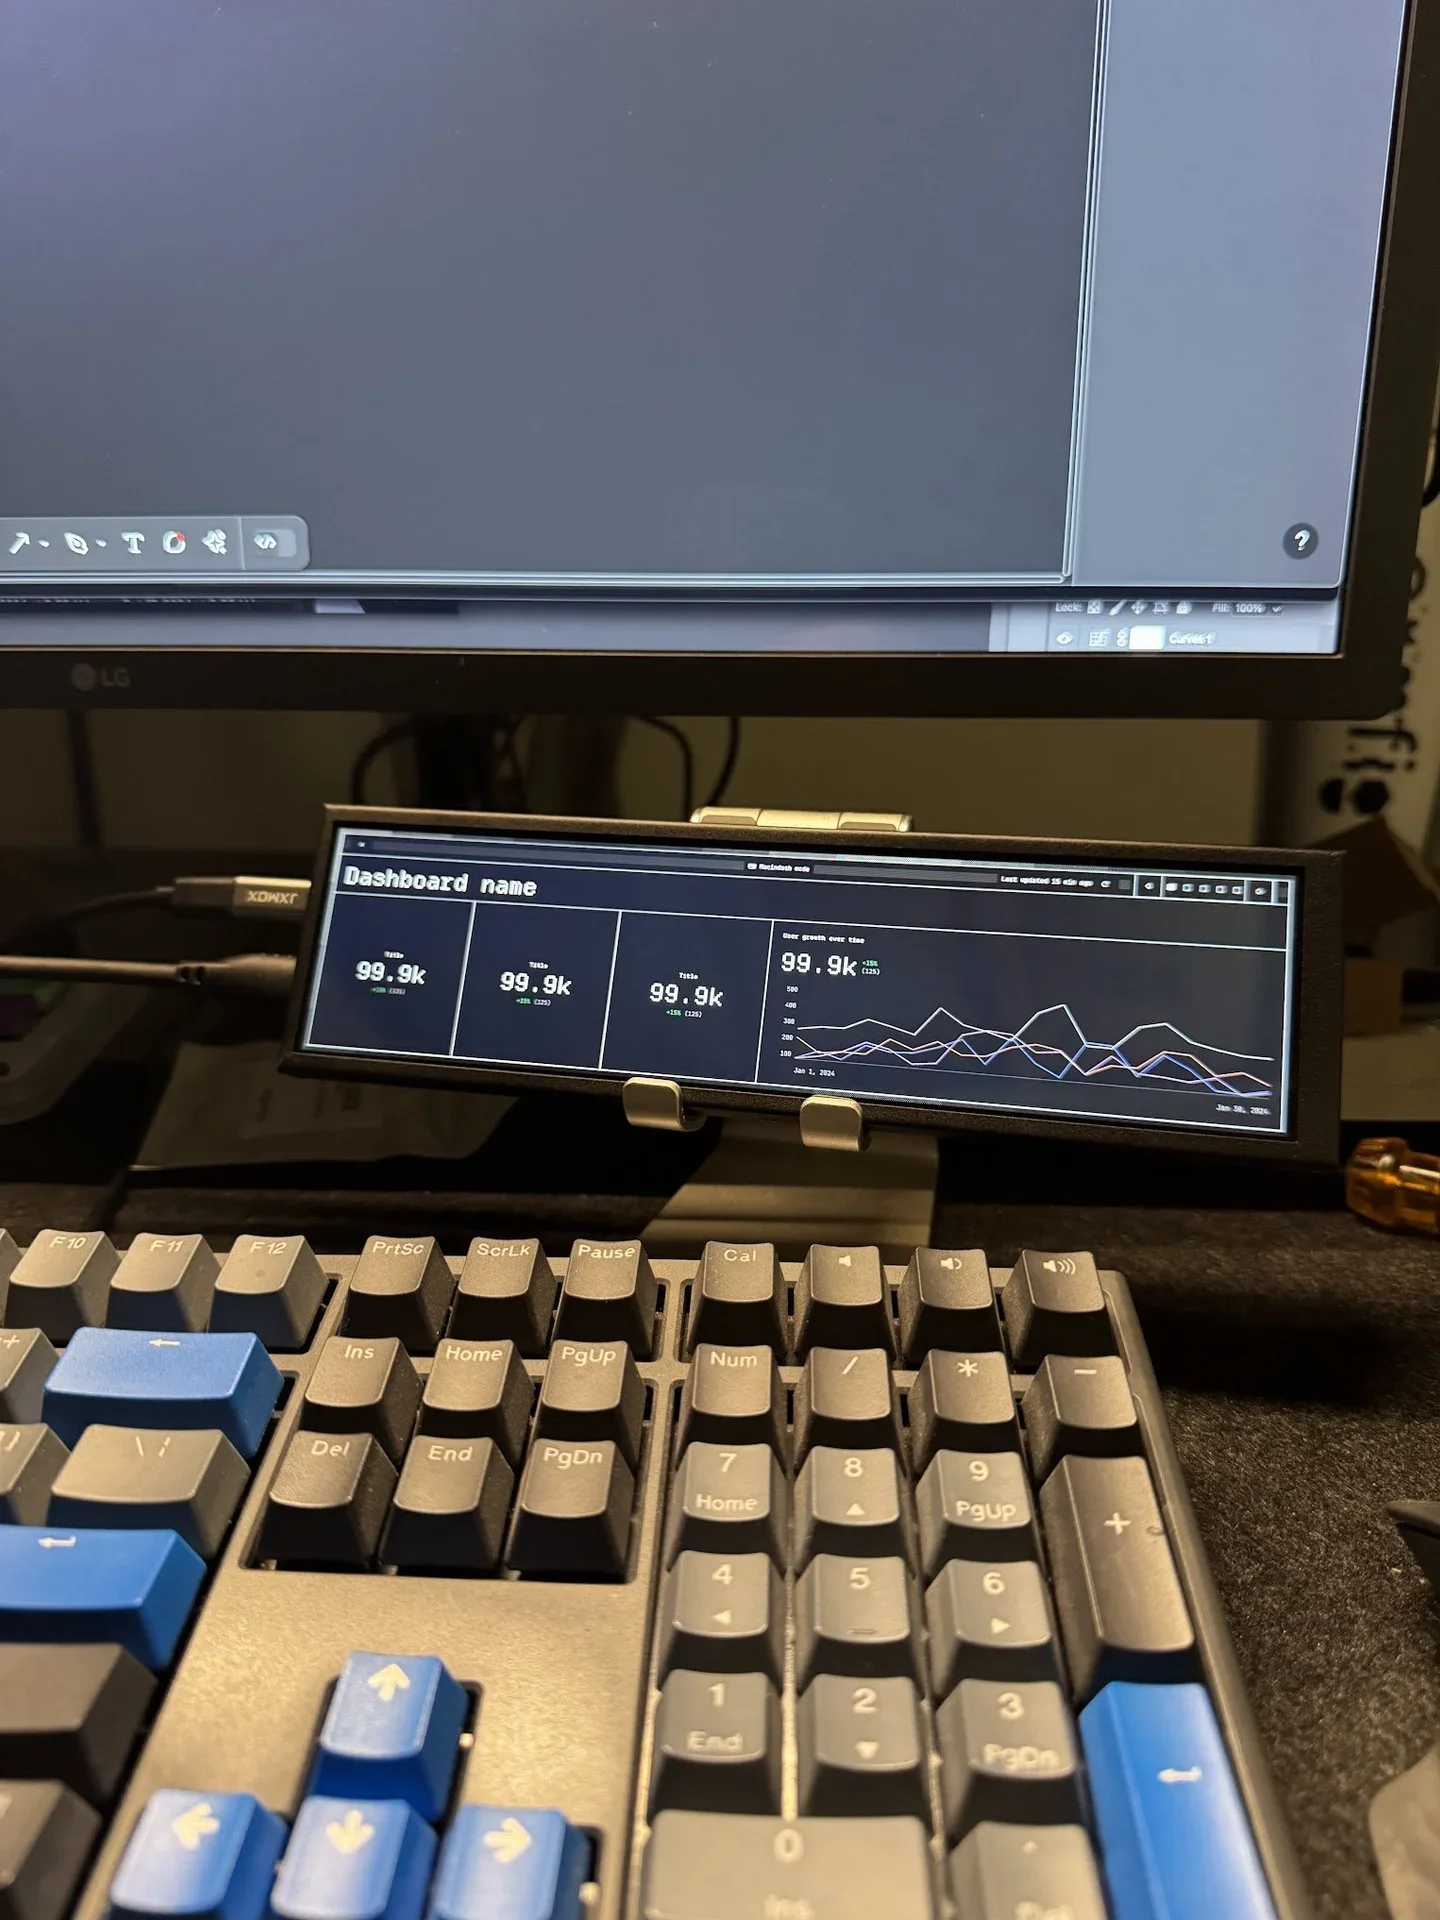
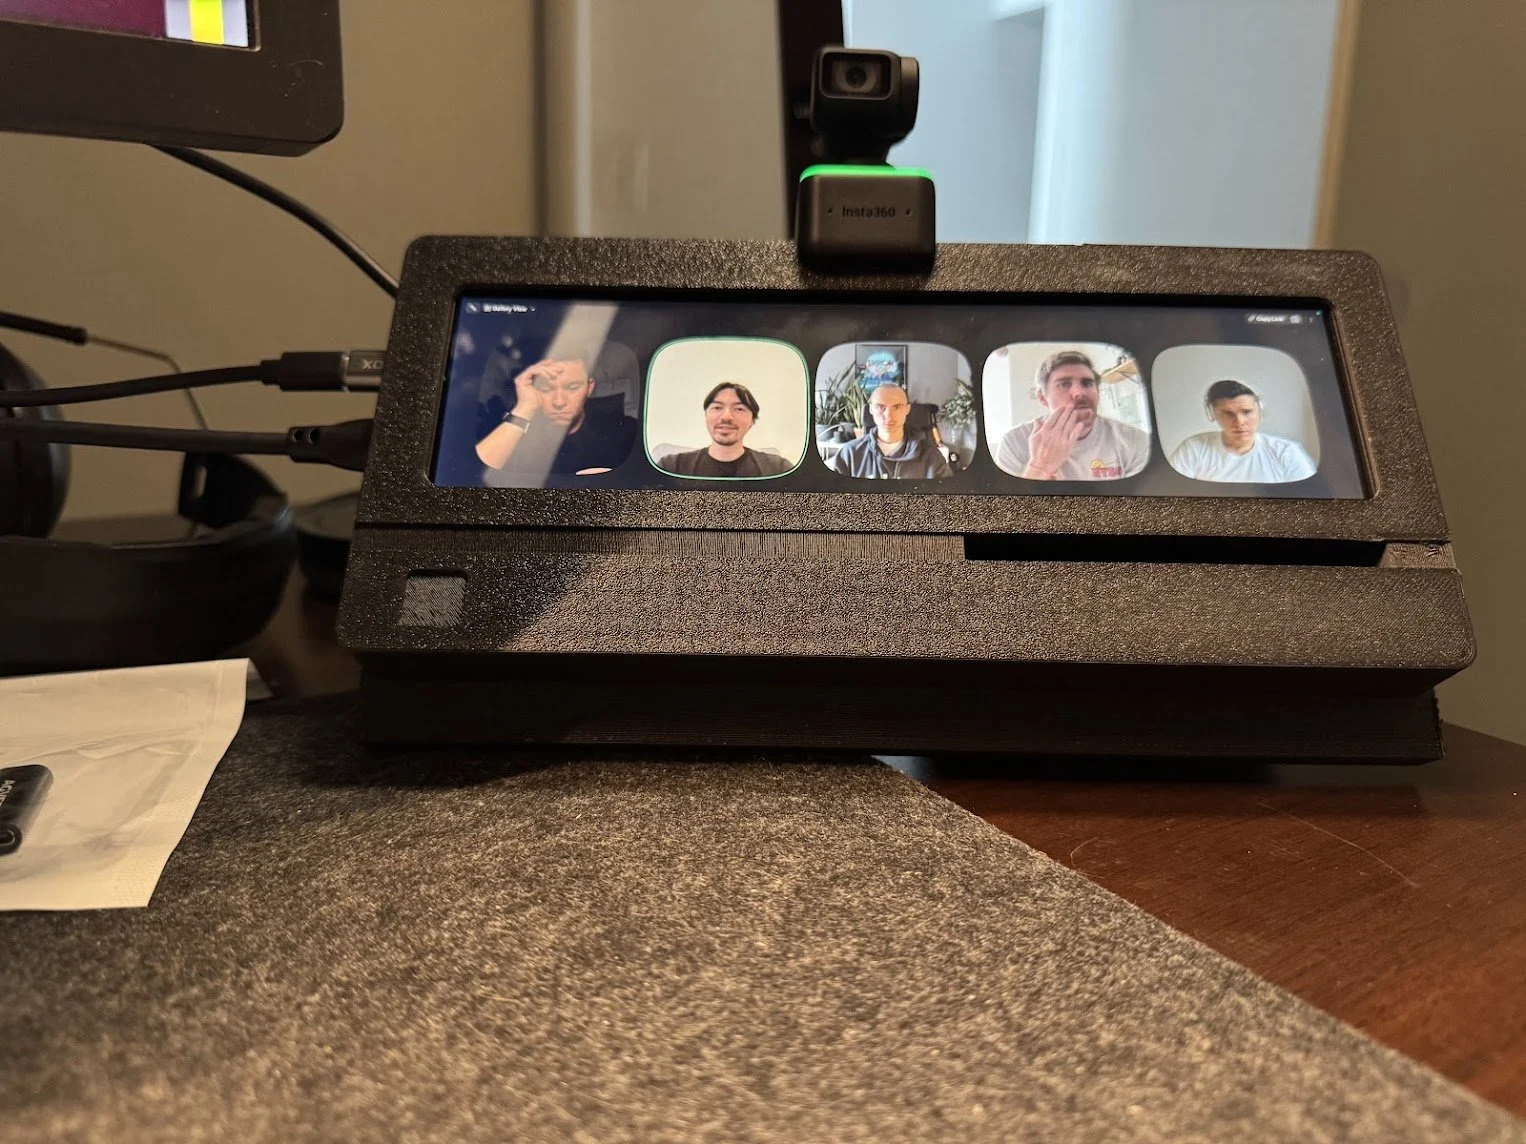
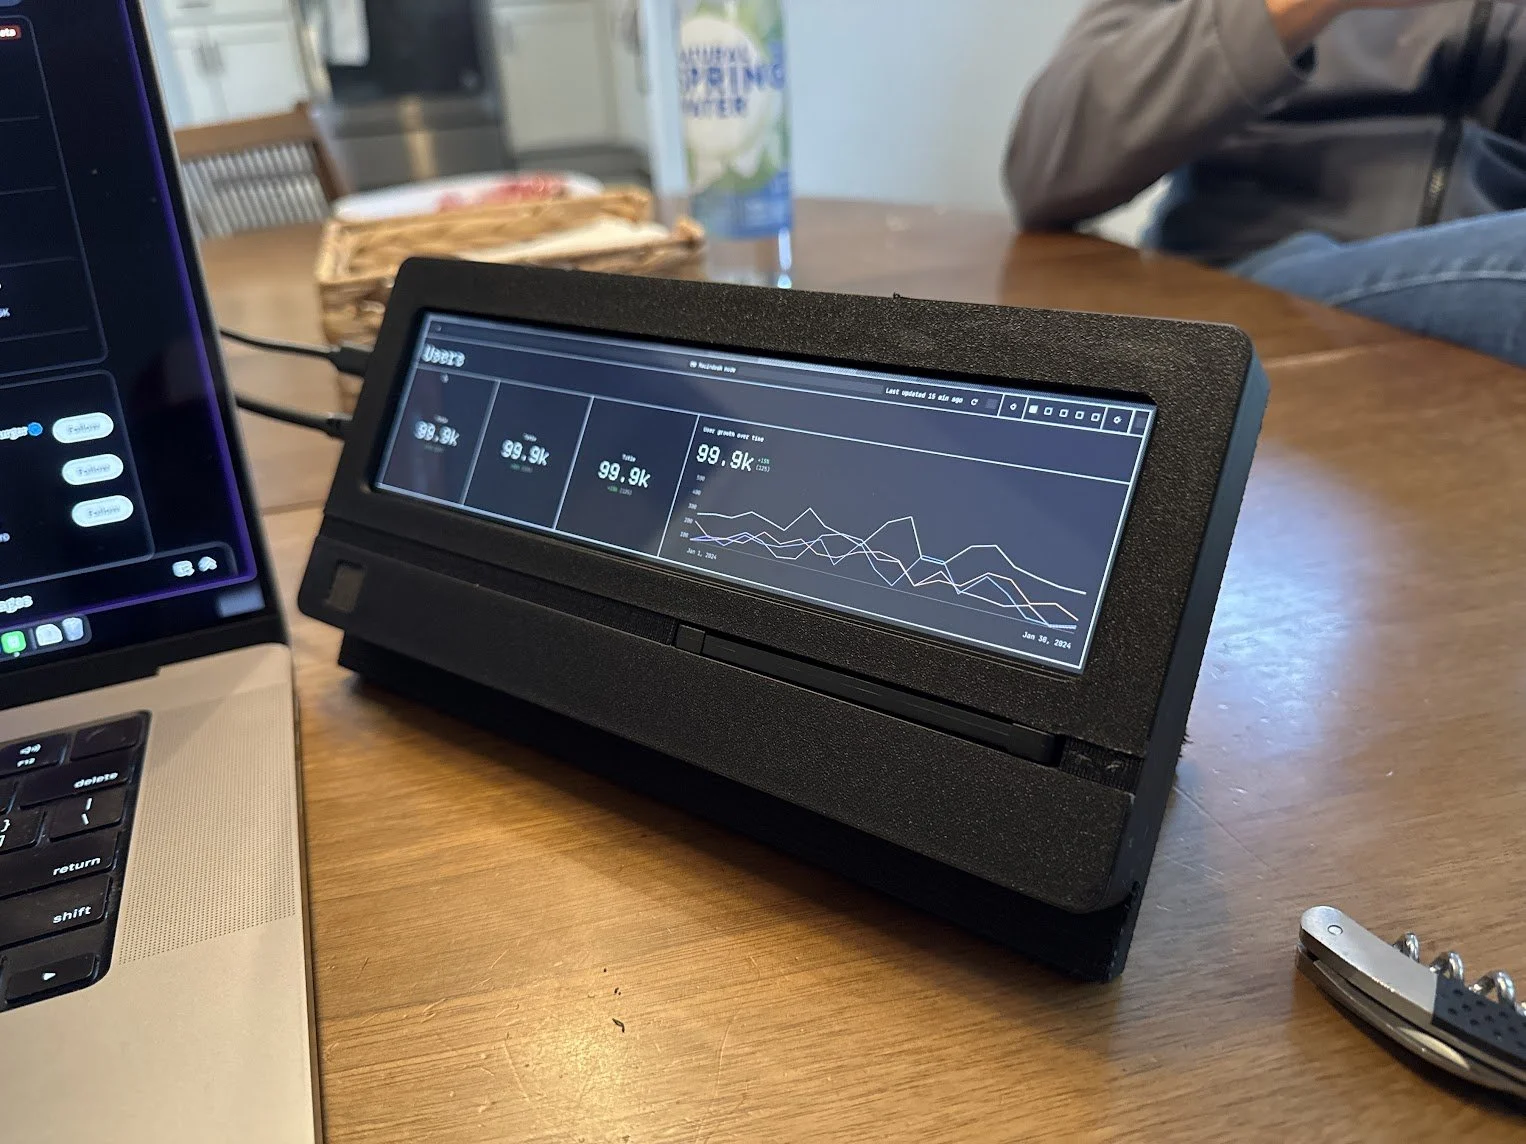
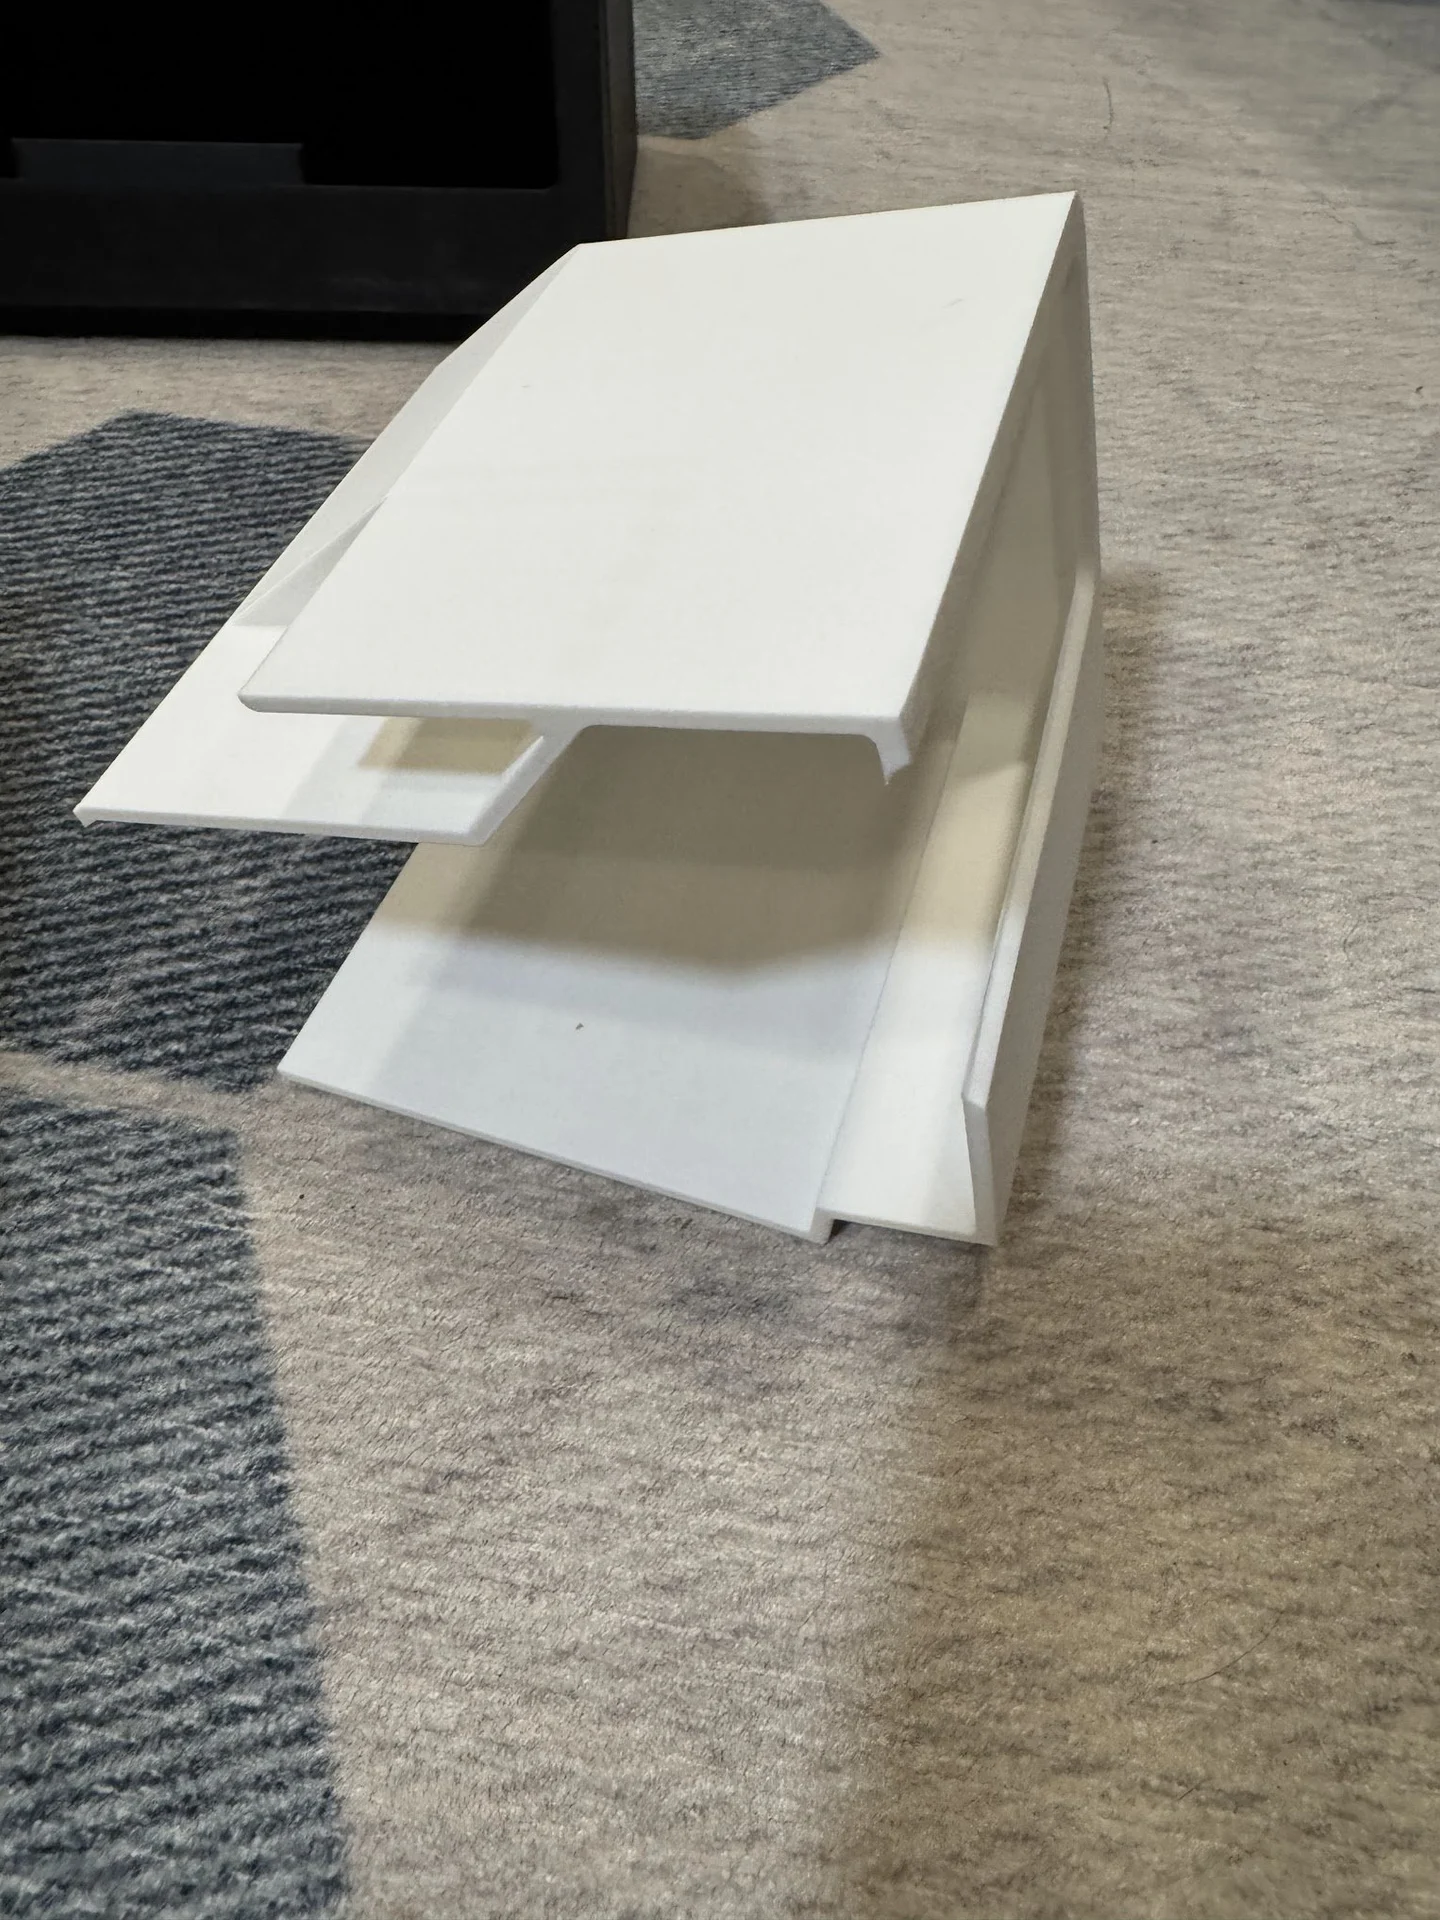
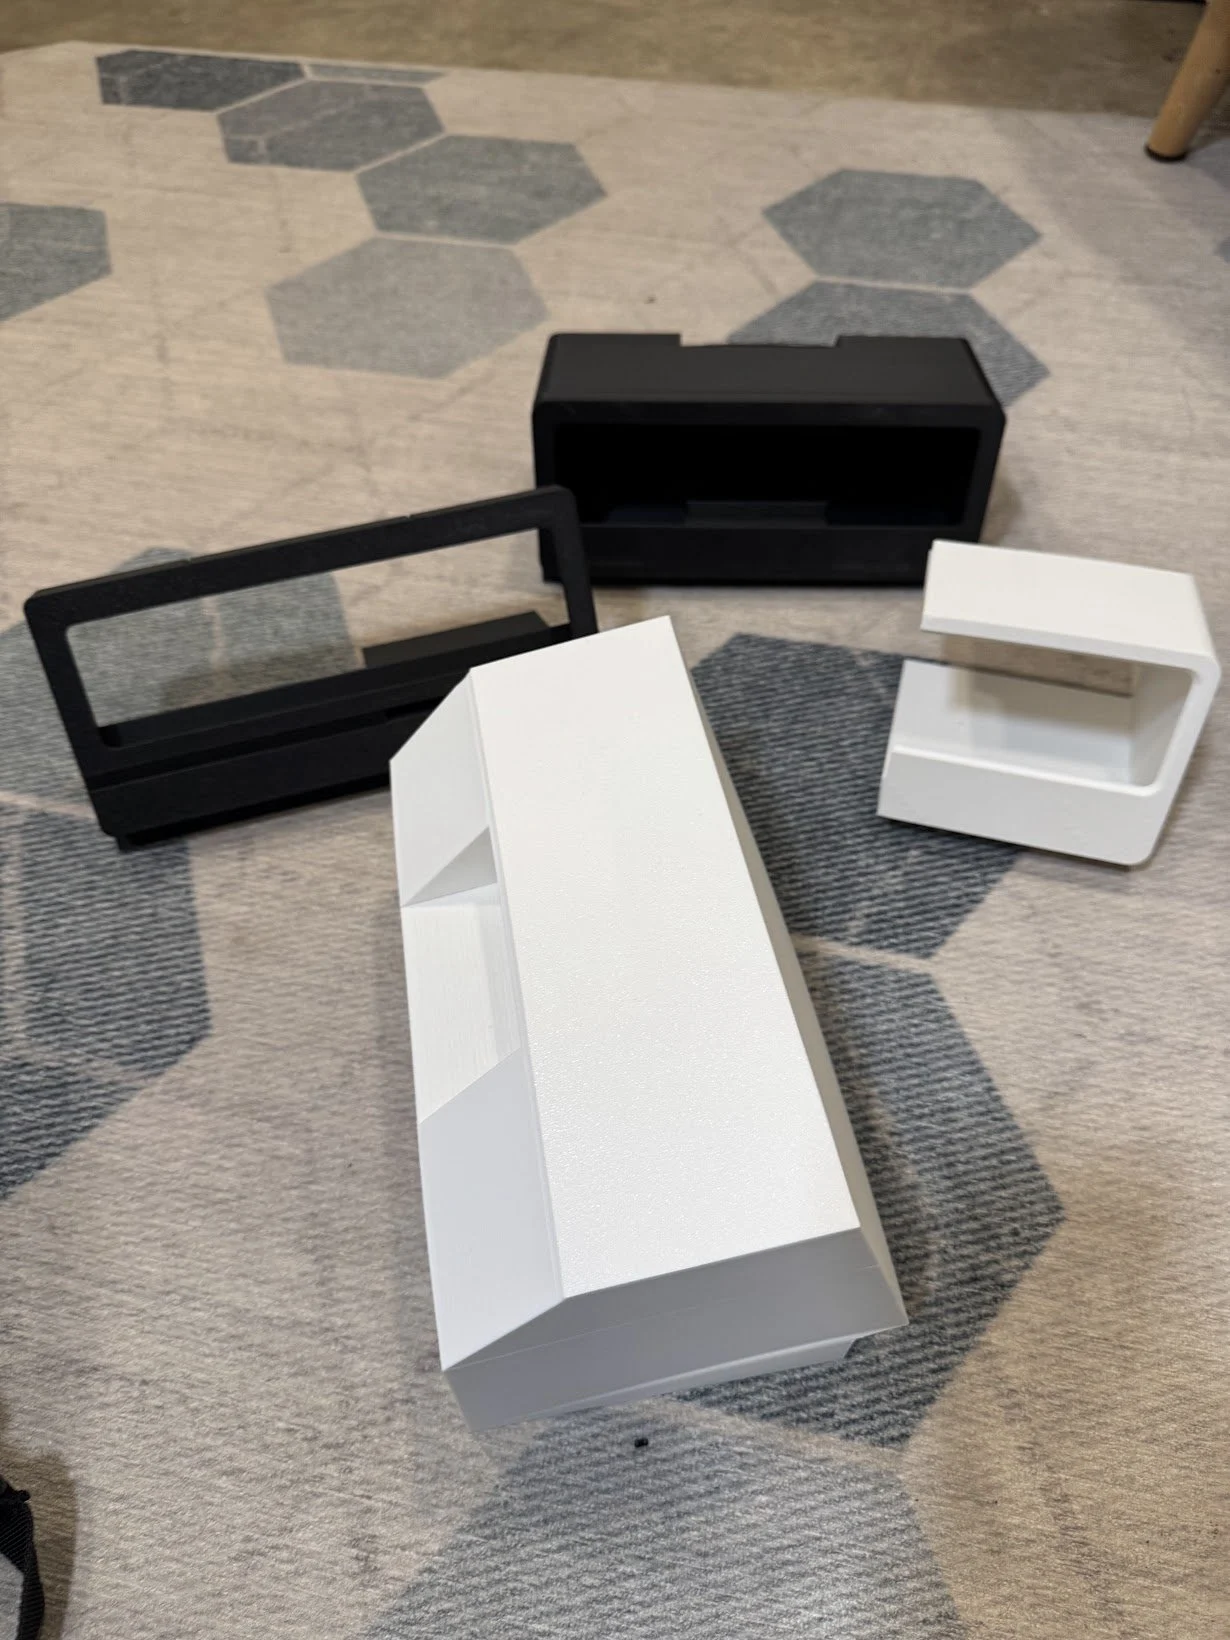
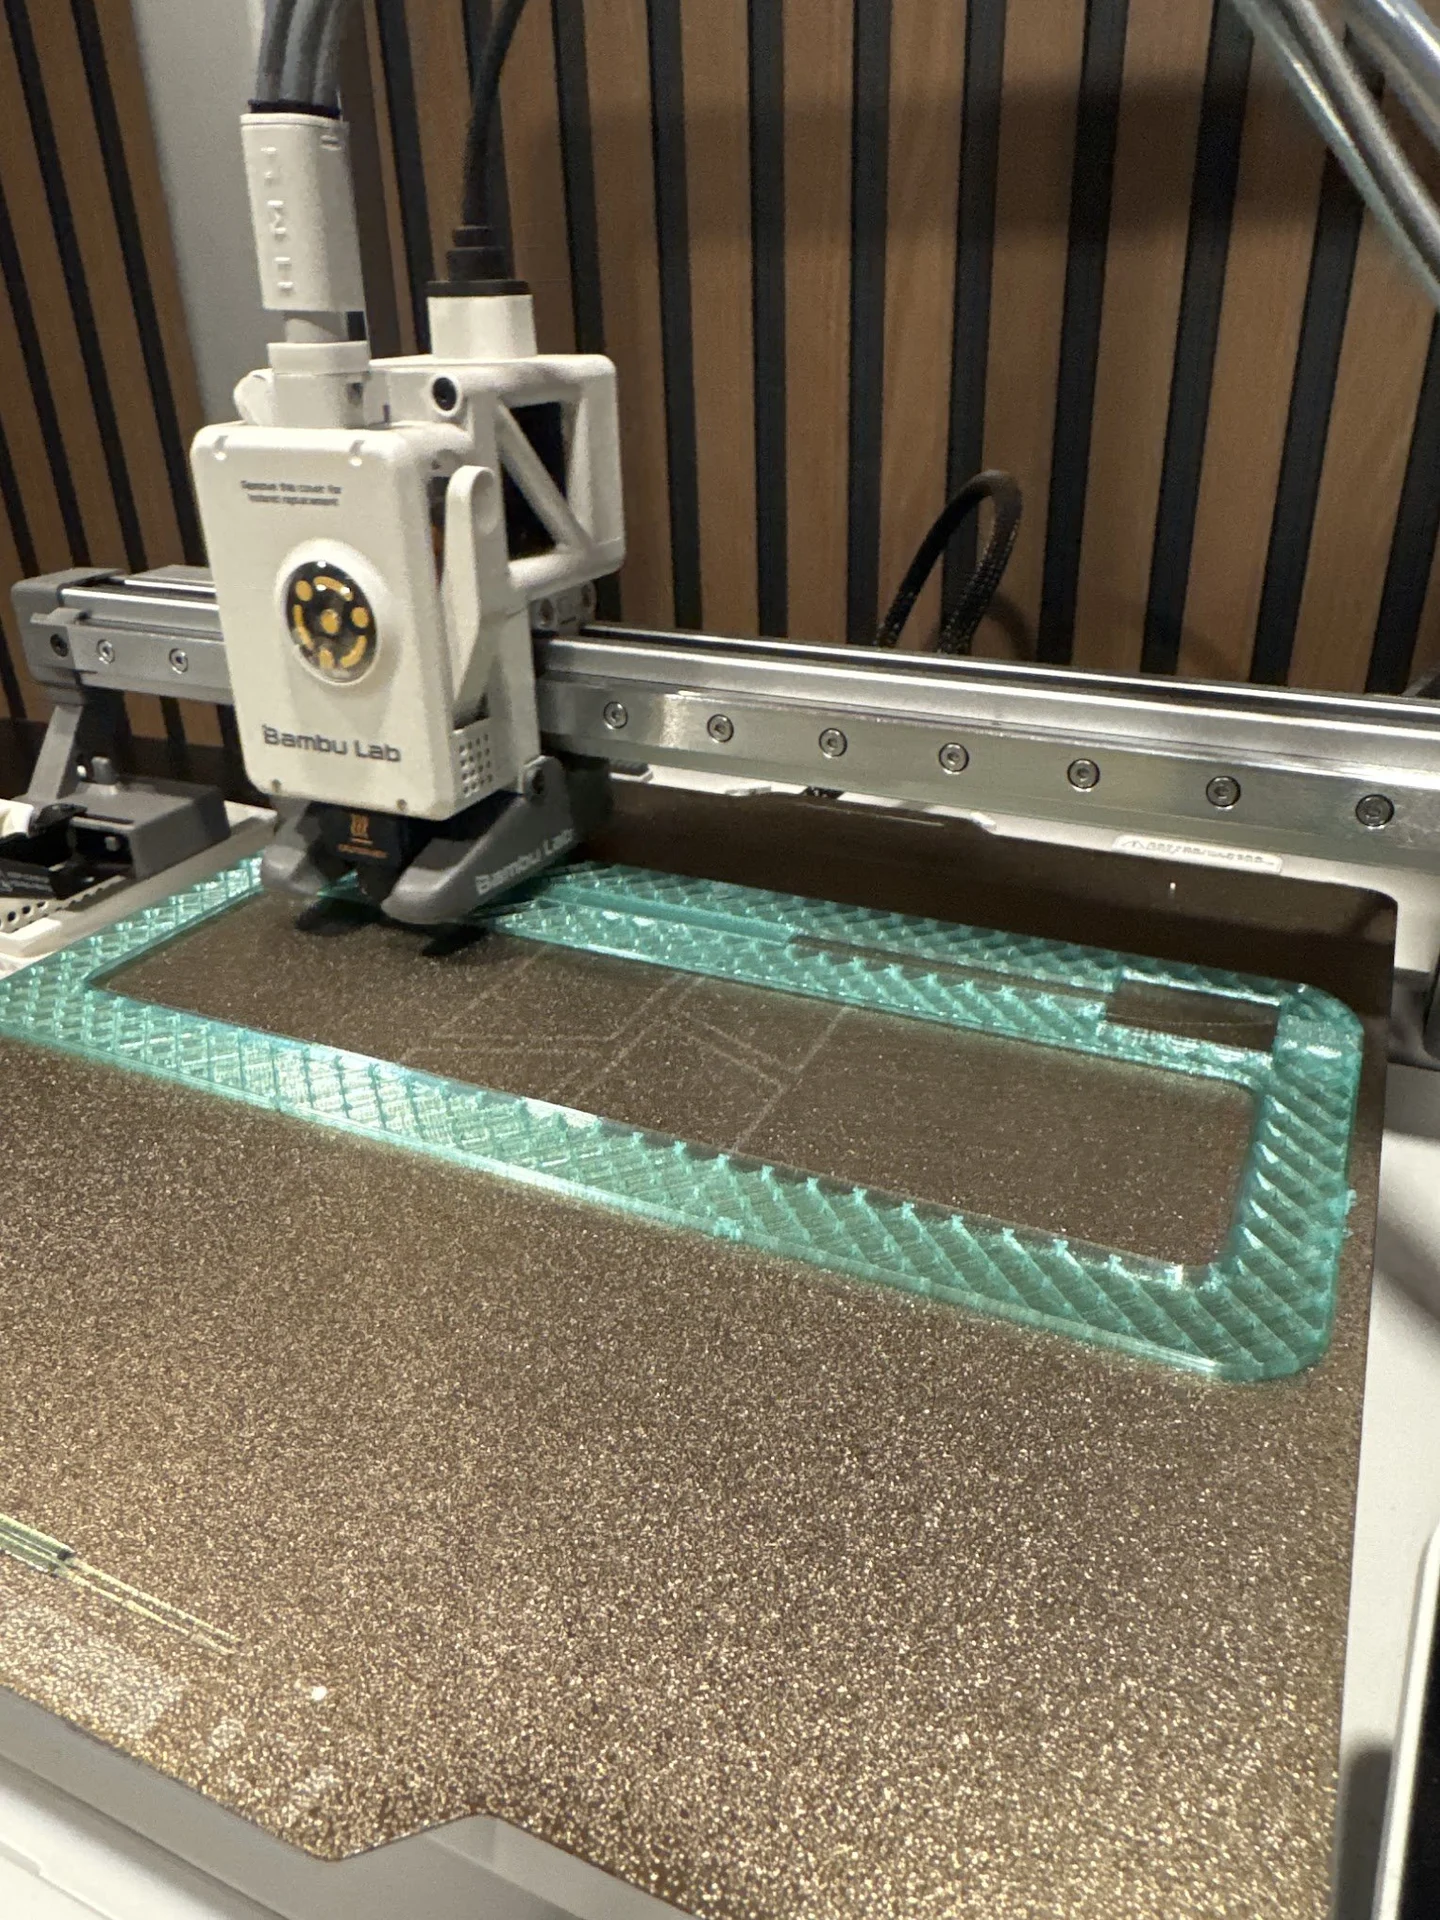
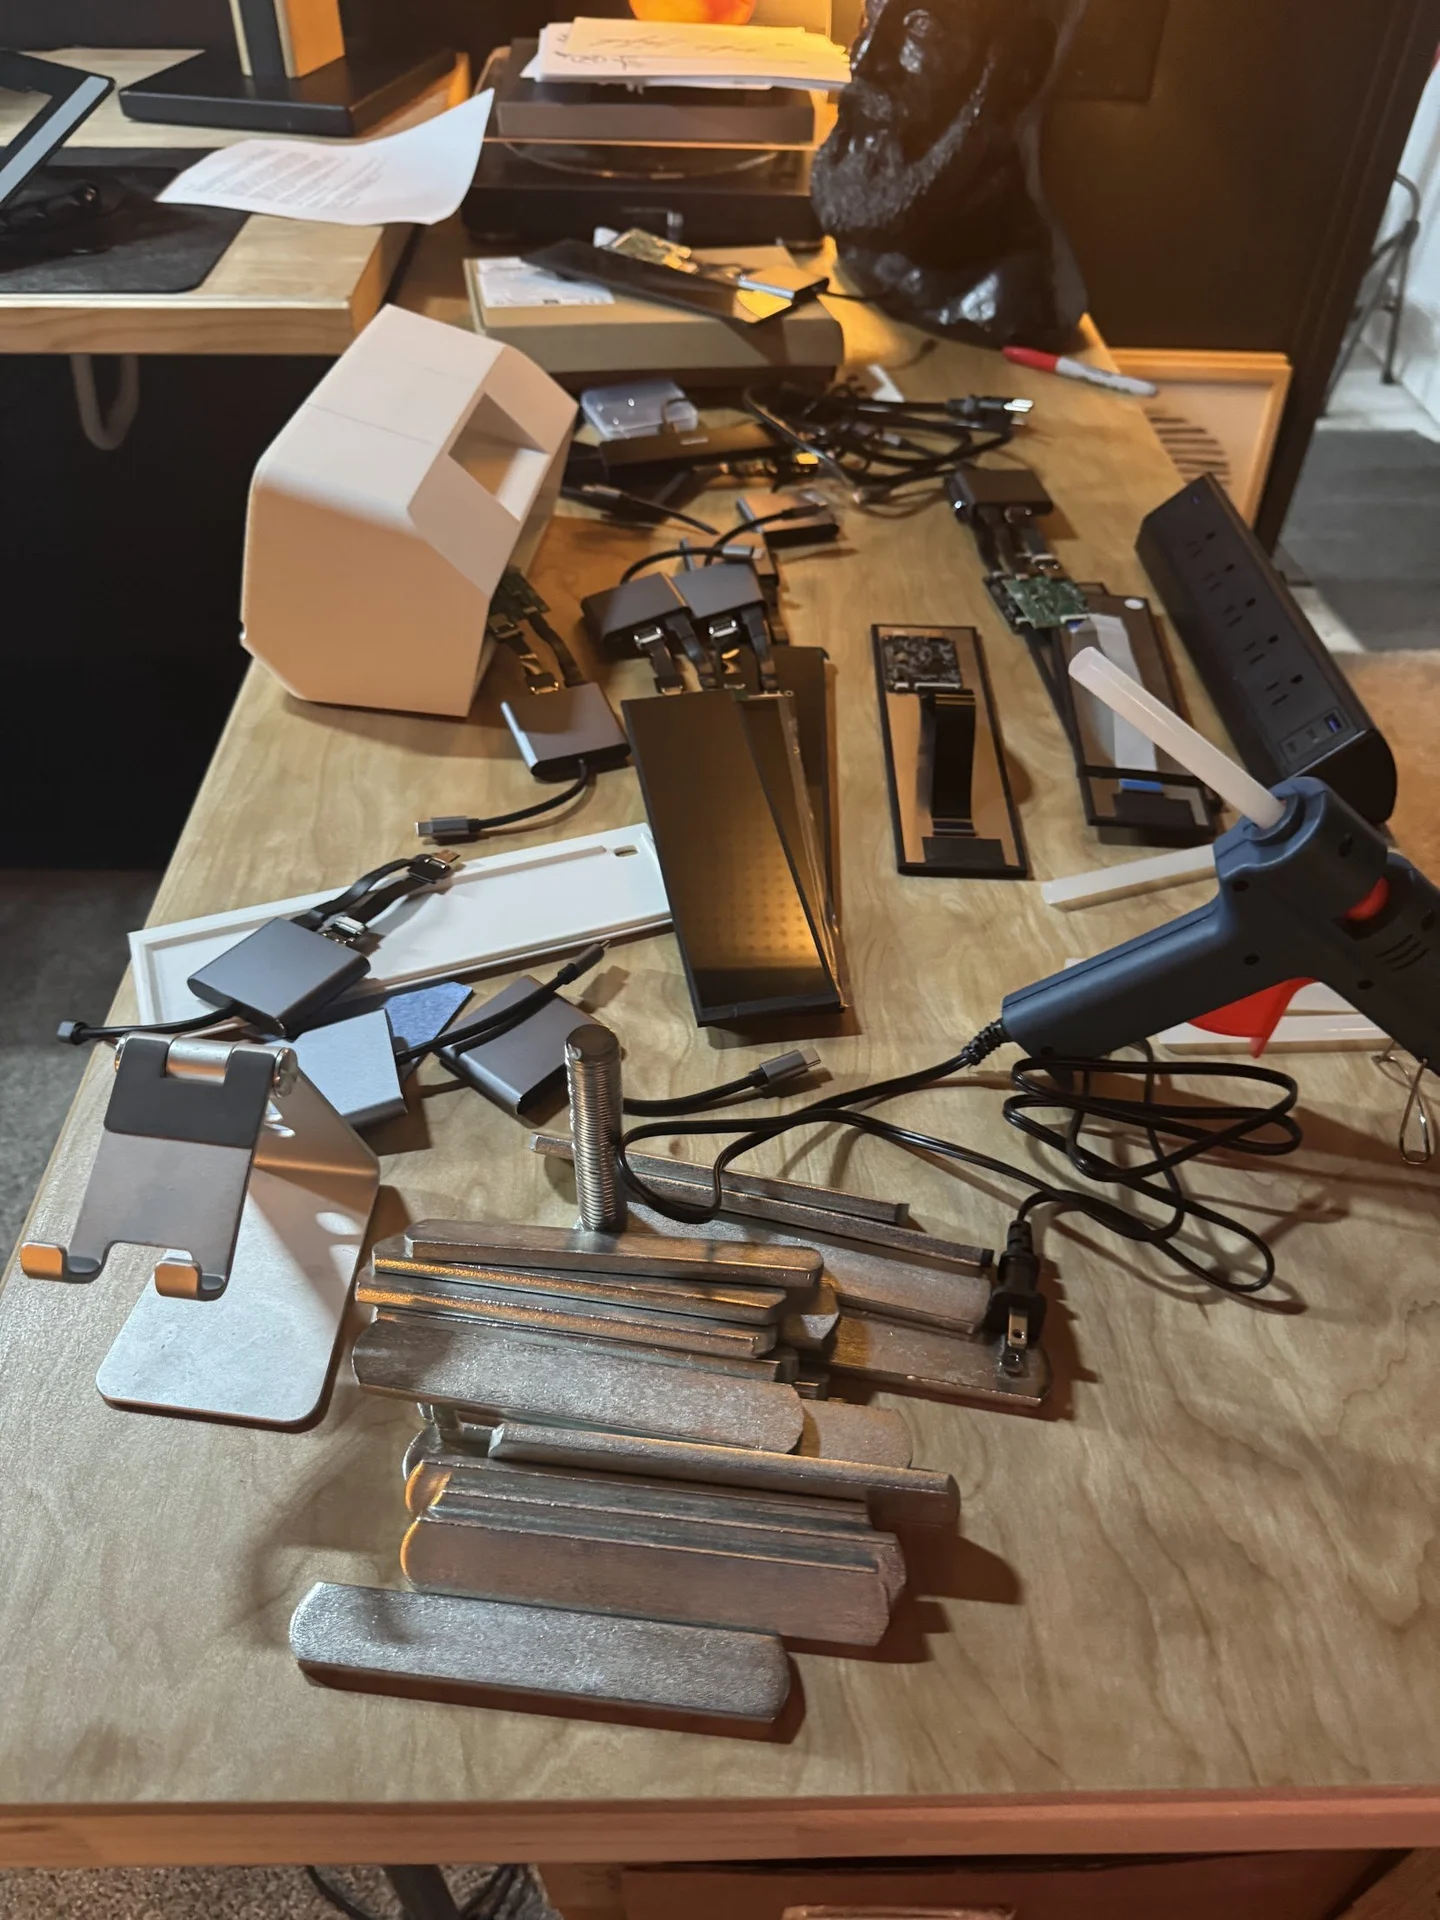
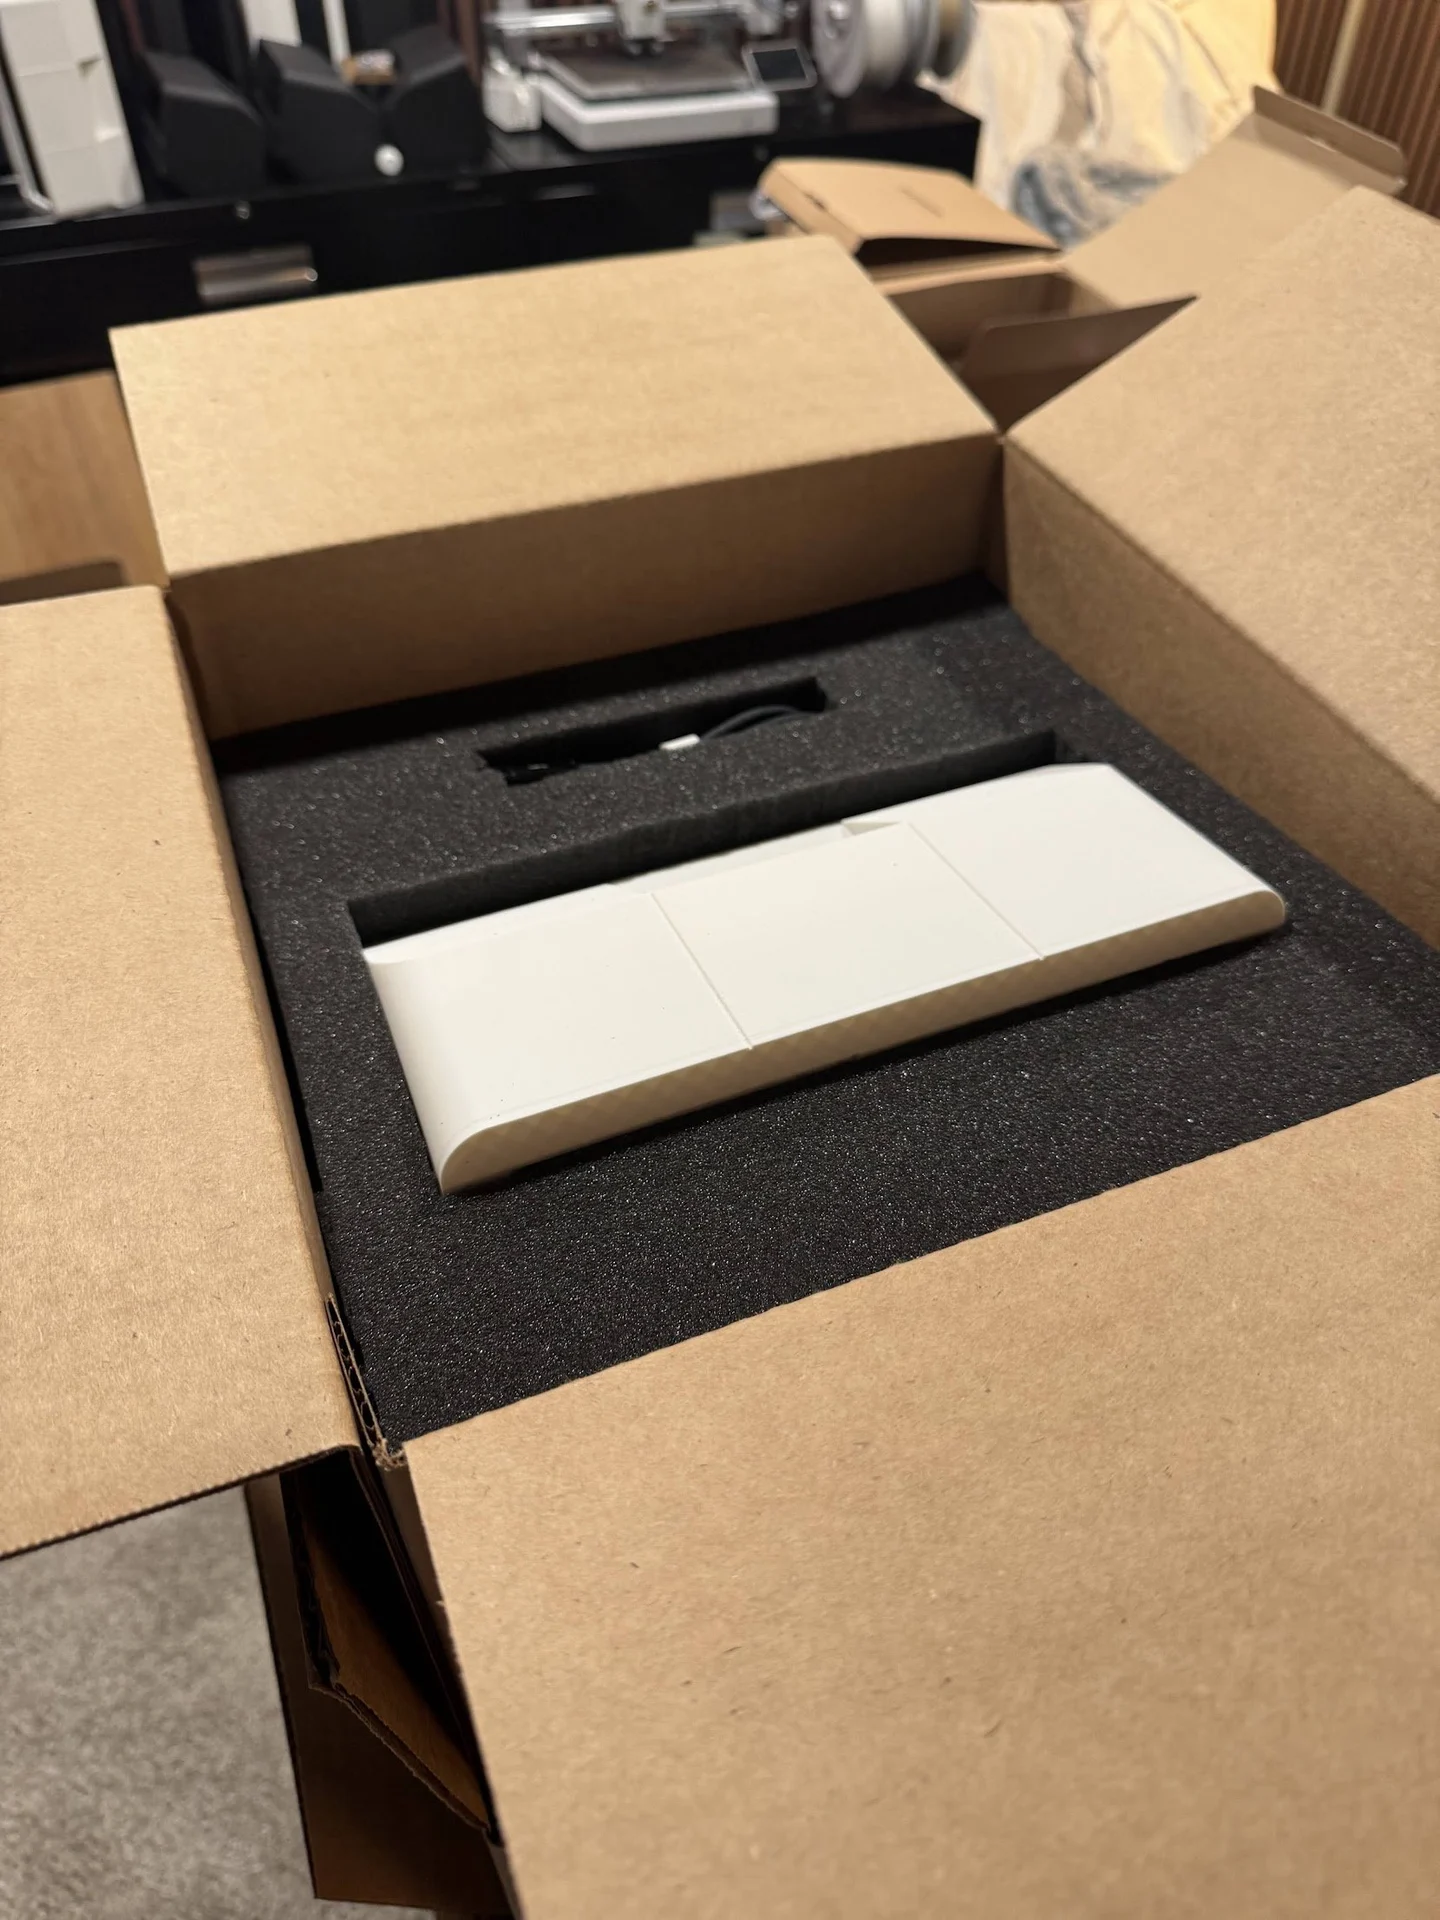
I spent five years as Basedash’s remote founding designer, helping a small team turn a database admin panel into a product for creating charts and dashboards with AI. My work spanned the product, brand, website, research, and experiments that reached all the way to a 3D-printed desktop display.
The biggest change was in what we were solving. Editing a production database brought questions of trust, access, and switching costs. People were also telling us how much they disliked their business intelligence tools. We shifted our attention to making great charts quickly, then rebuilt the experience around AI and SQL.
Projects

Talks
 Doing every Maven data drill in BasedashOct 24, 2025
 Basedash for June usersJul 10, 2025
 Demoing the Basedash SlackbotJun 25, 2025
 This tool is a cheat code for designersJun 18, 2025
 Building the same dashboards in Metabase and BasedashJun 10, 2025
 Adding logo downloads to our site with Framer AIJun 5, 2025
 My first Framer AI component for the Basedash siteMay 22, 2025
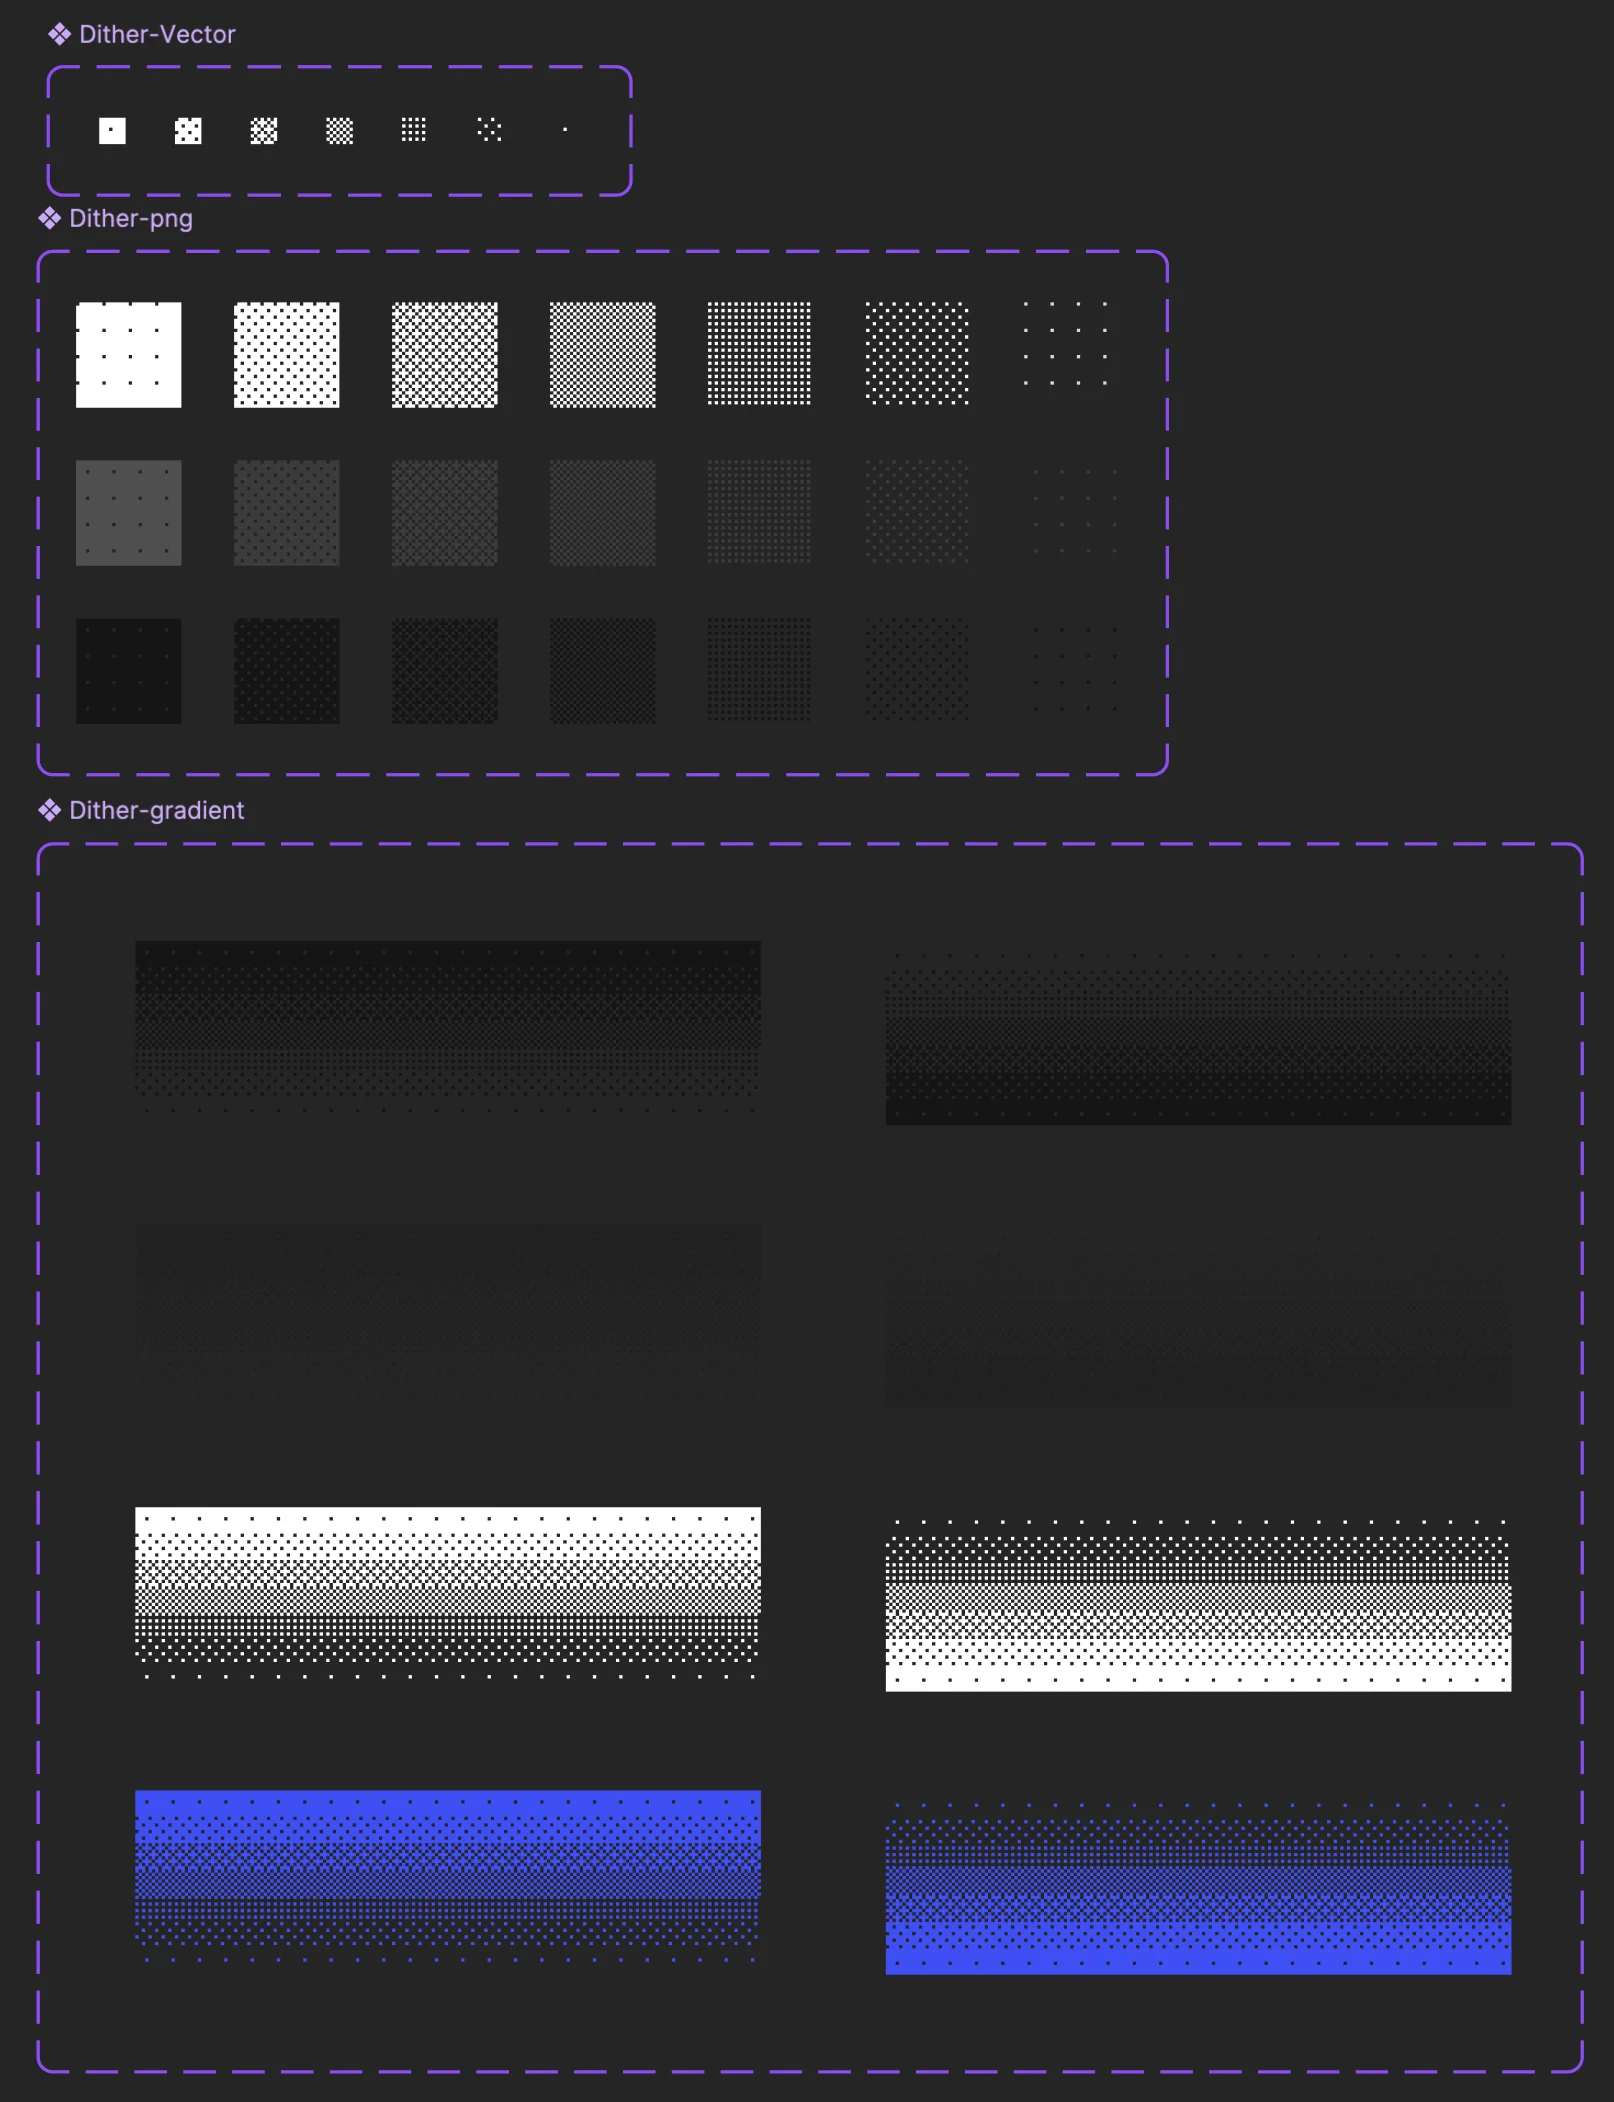
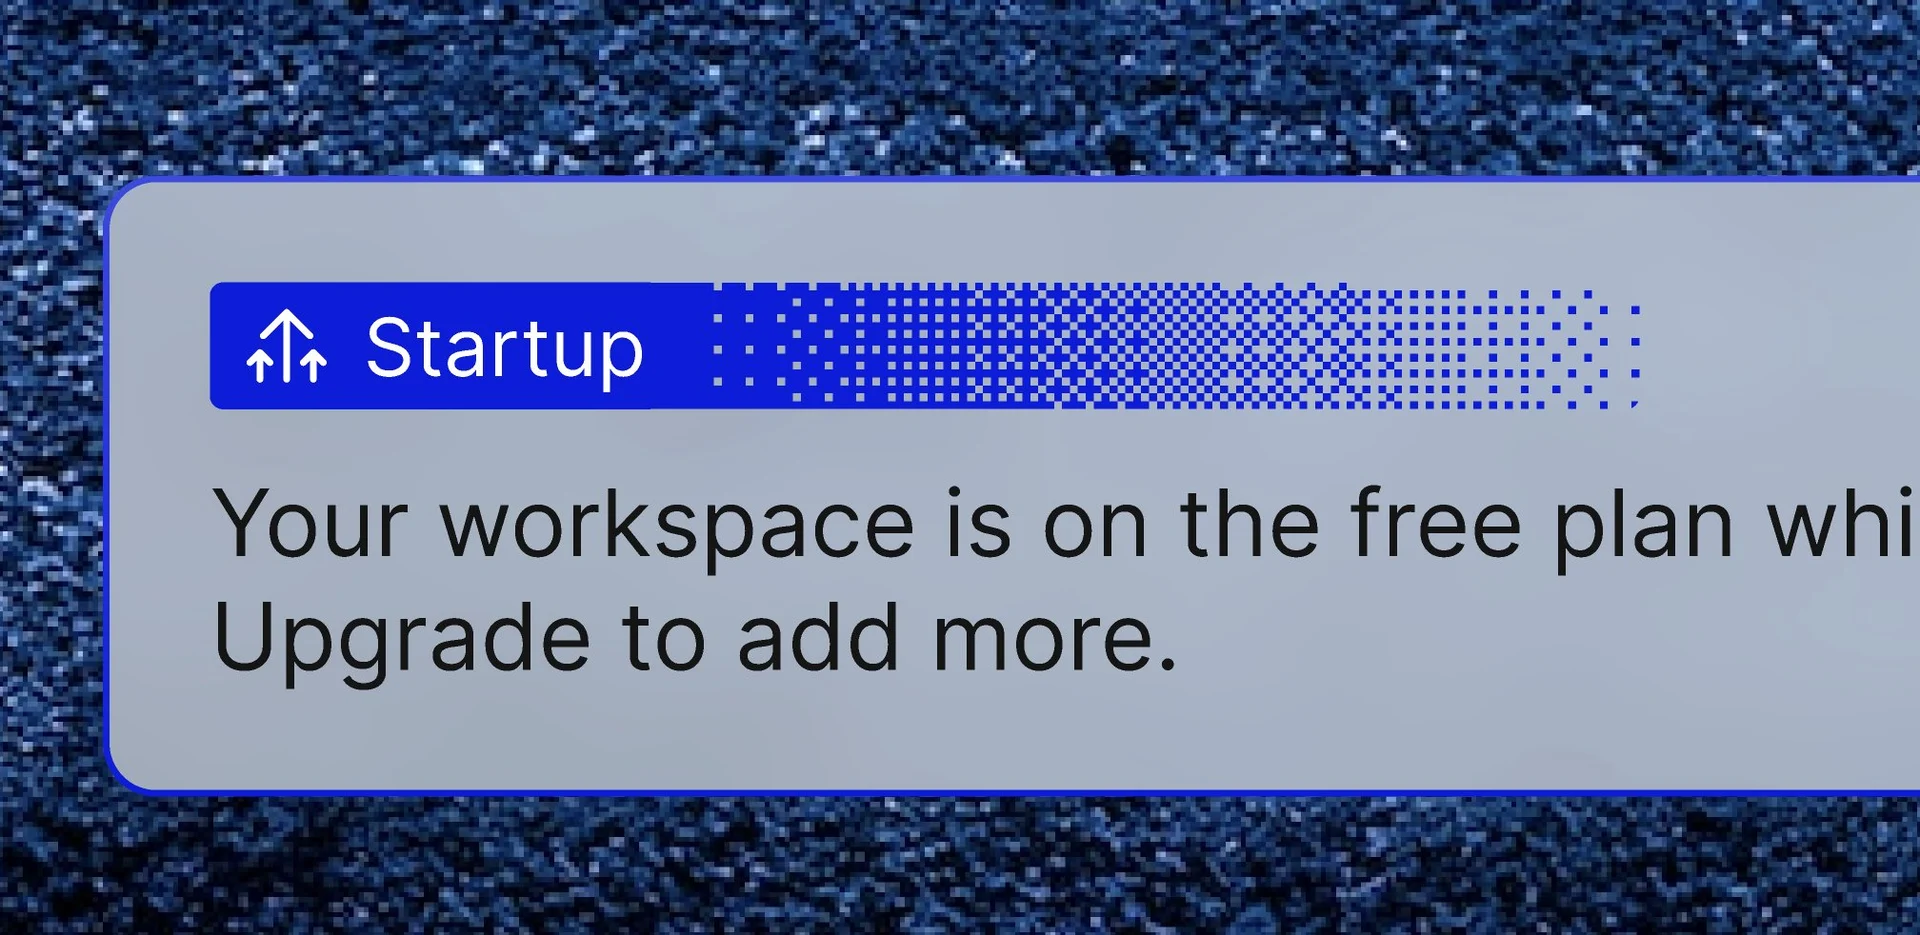
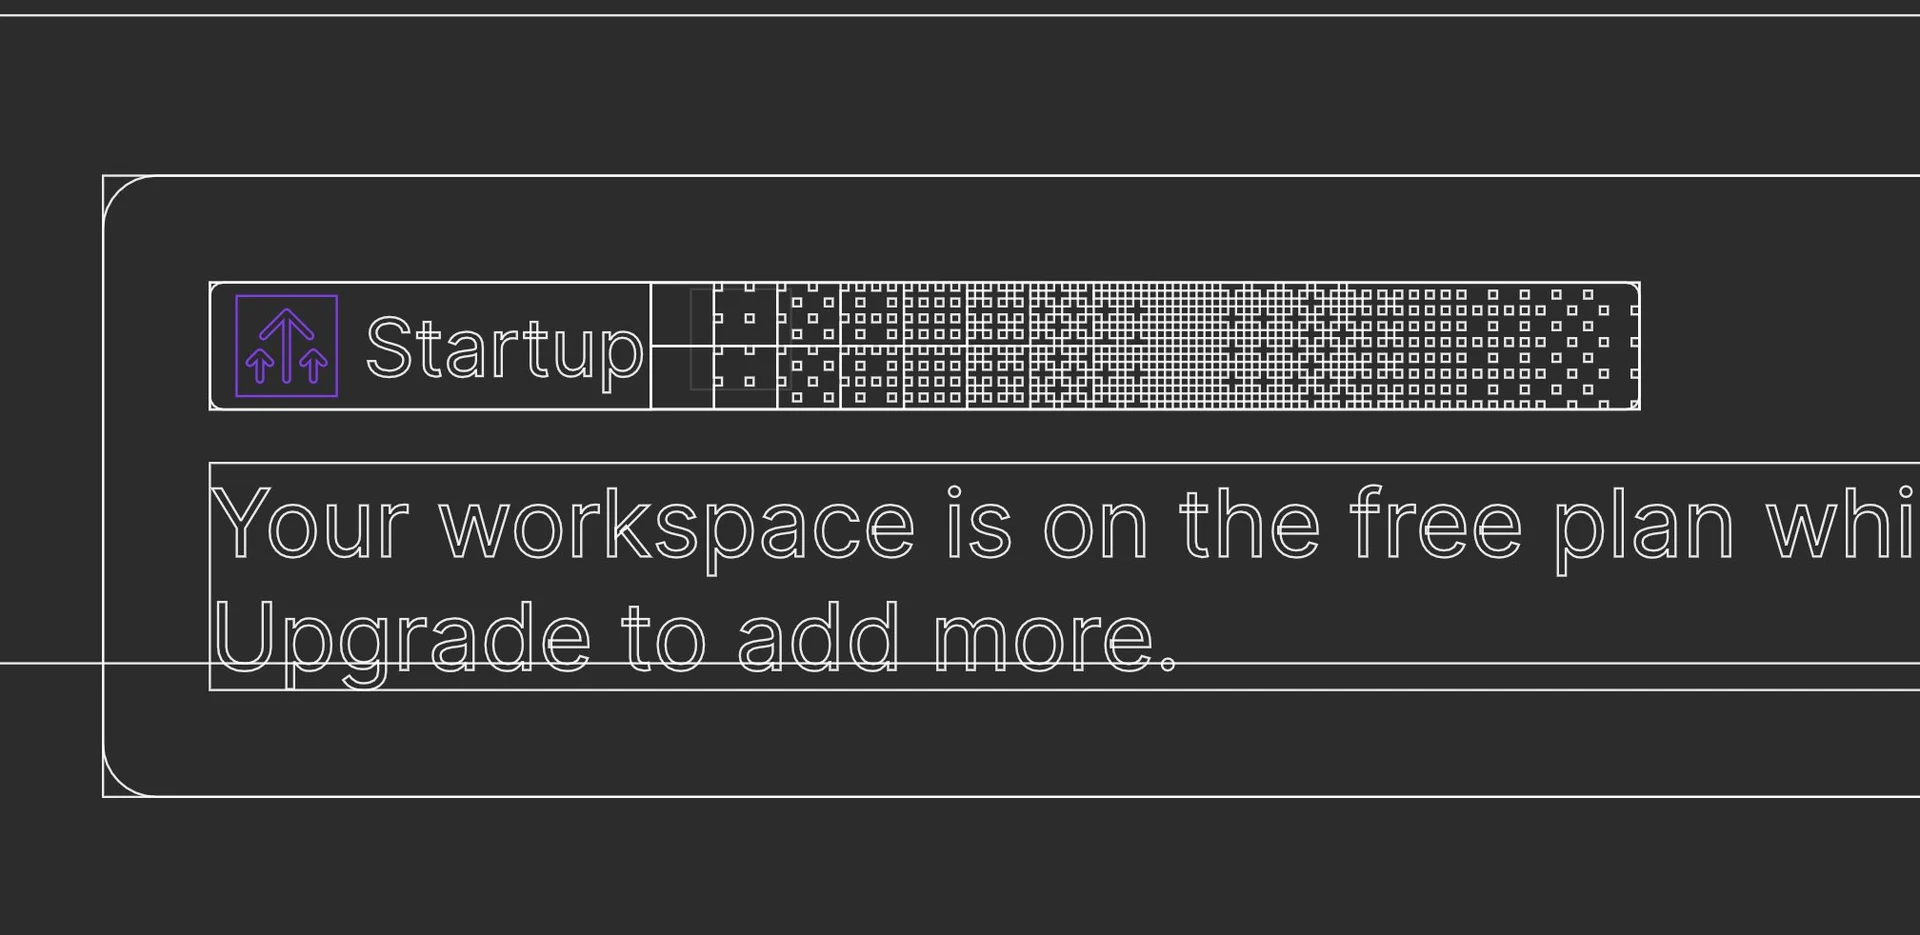
 How I made the dithered Basedash loading animationsMay 2, 2025
 Designing BasedashMay 1, 2025
 How the gold Basedash logo works in Unicorn StudioApr 25, 2025
 Designing from scratch in Unicorn StudioApr 21, 2025
 Basedash launch demo 2: ChartsJan 28, 2025
 Basedash launch demo 5: IntegrationsJan 28, 2025
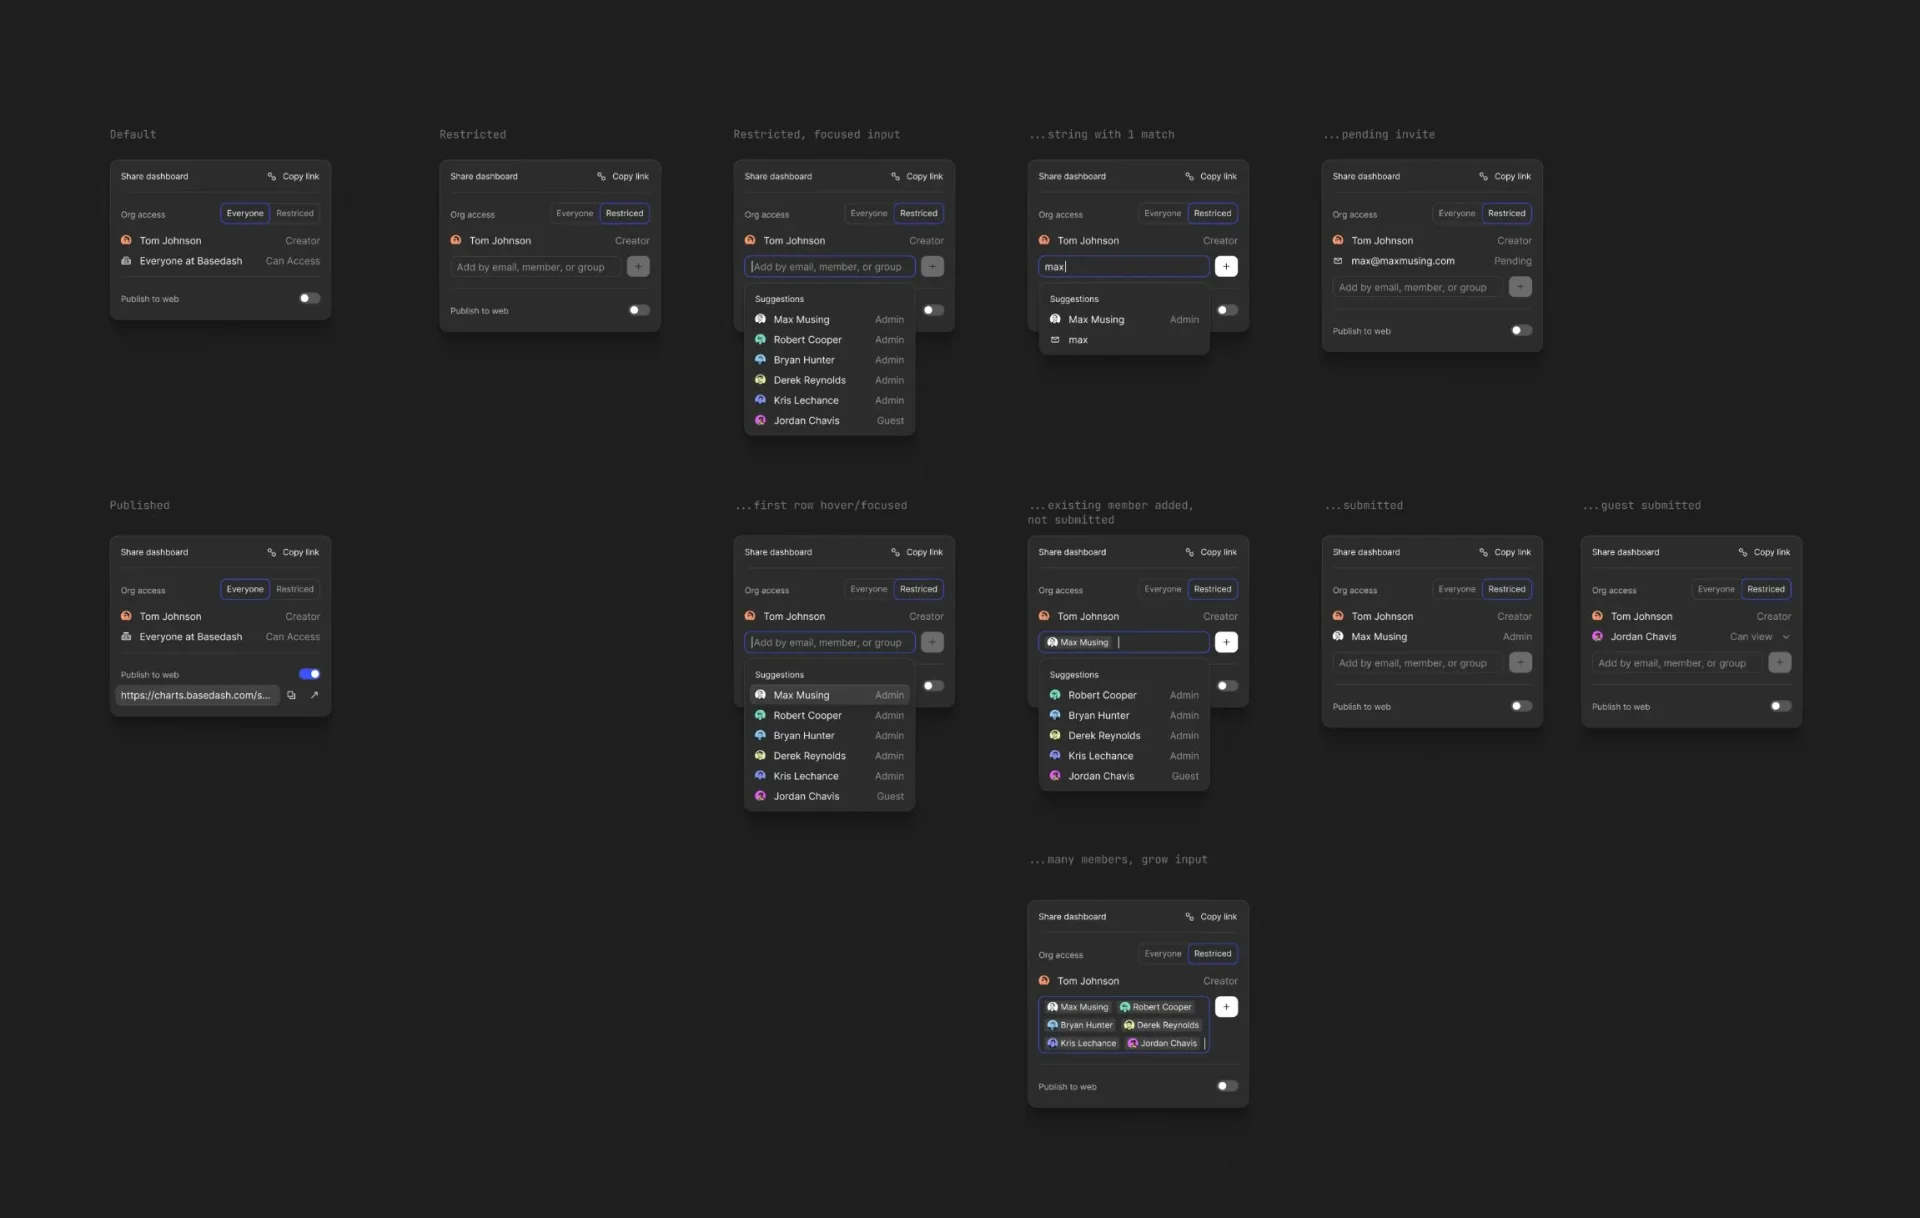
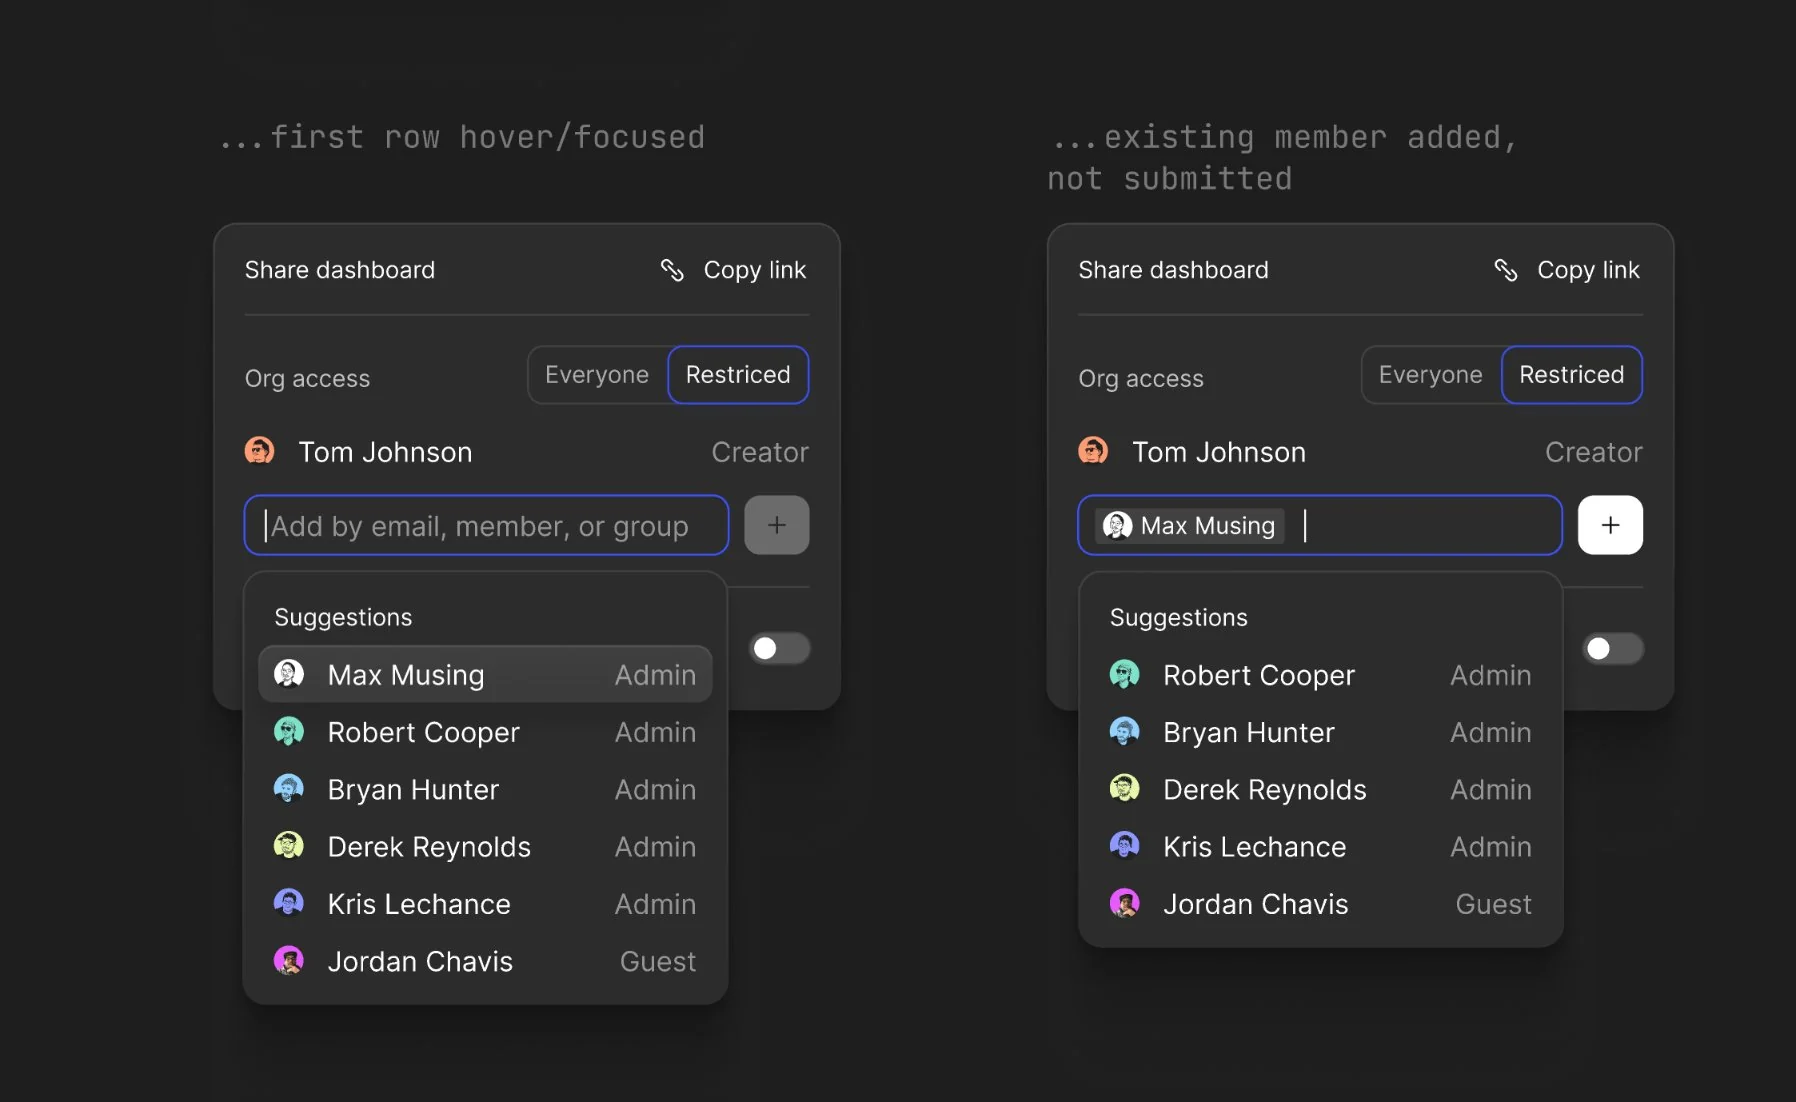
 Basedash launch demo 6: Sharing and collaborationJan 28, 2025
 Basedash launch demo 3: The SQL editorJan 28, 2025
 Basedash launch demo 4: VariablesJan 28, 2025
 Basedash launch demo 1: What is BasedashJan 28, 2025
Gallery

Looking back
This account comes from the retrospective I shared on my last day at Basedash, November 6, 2025. The work includes shipped features, discarded ideas, prototypes, and lessons learned along the way. References to the current product describe it at that point in time.
A small team, five years
On November 6, 2025, my last day at Basedash, I opened my old design files and looked back at five years as the first designer at a startup. These were the explorations, mistakes, and lessons I found before losing access to those files.
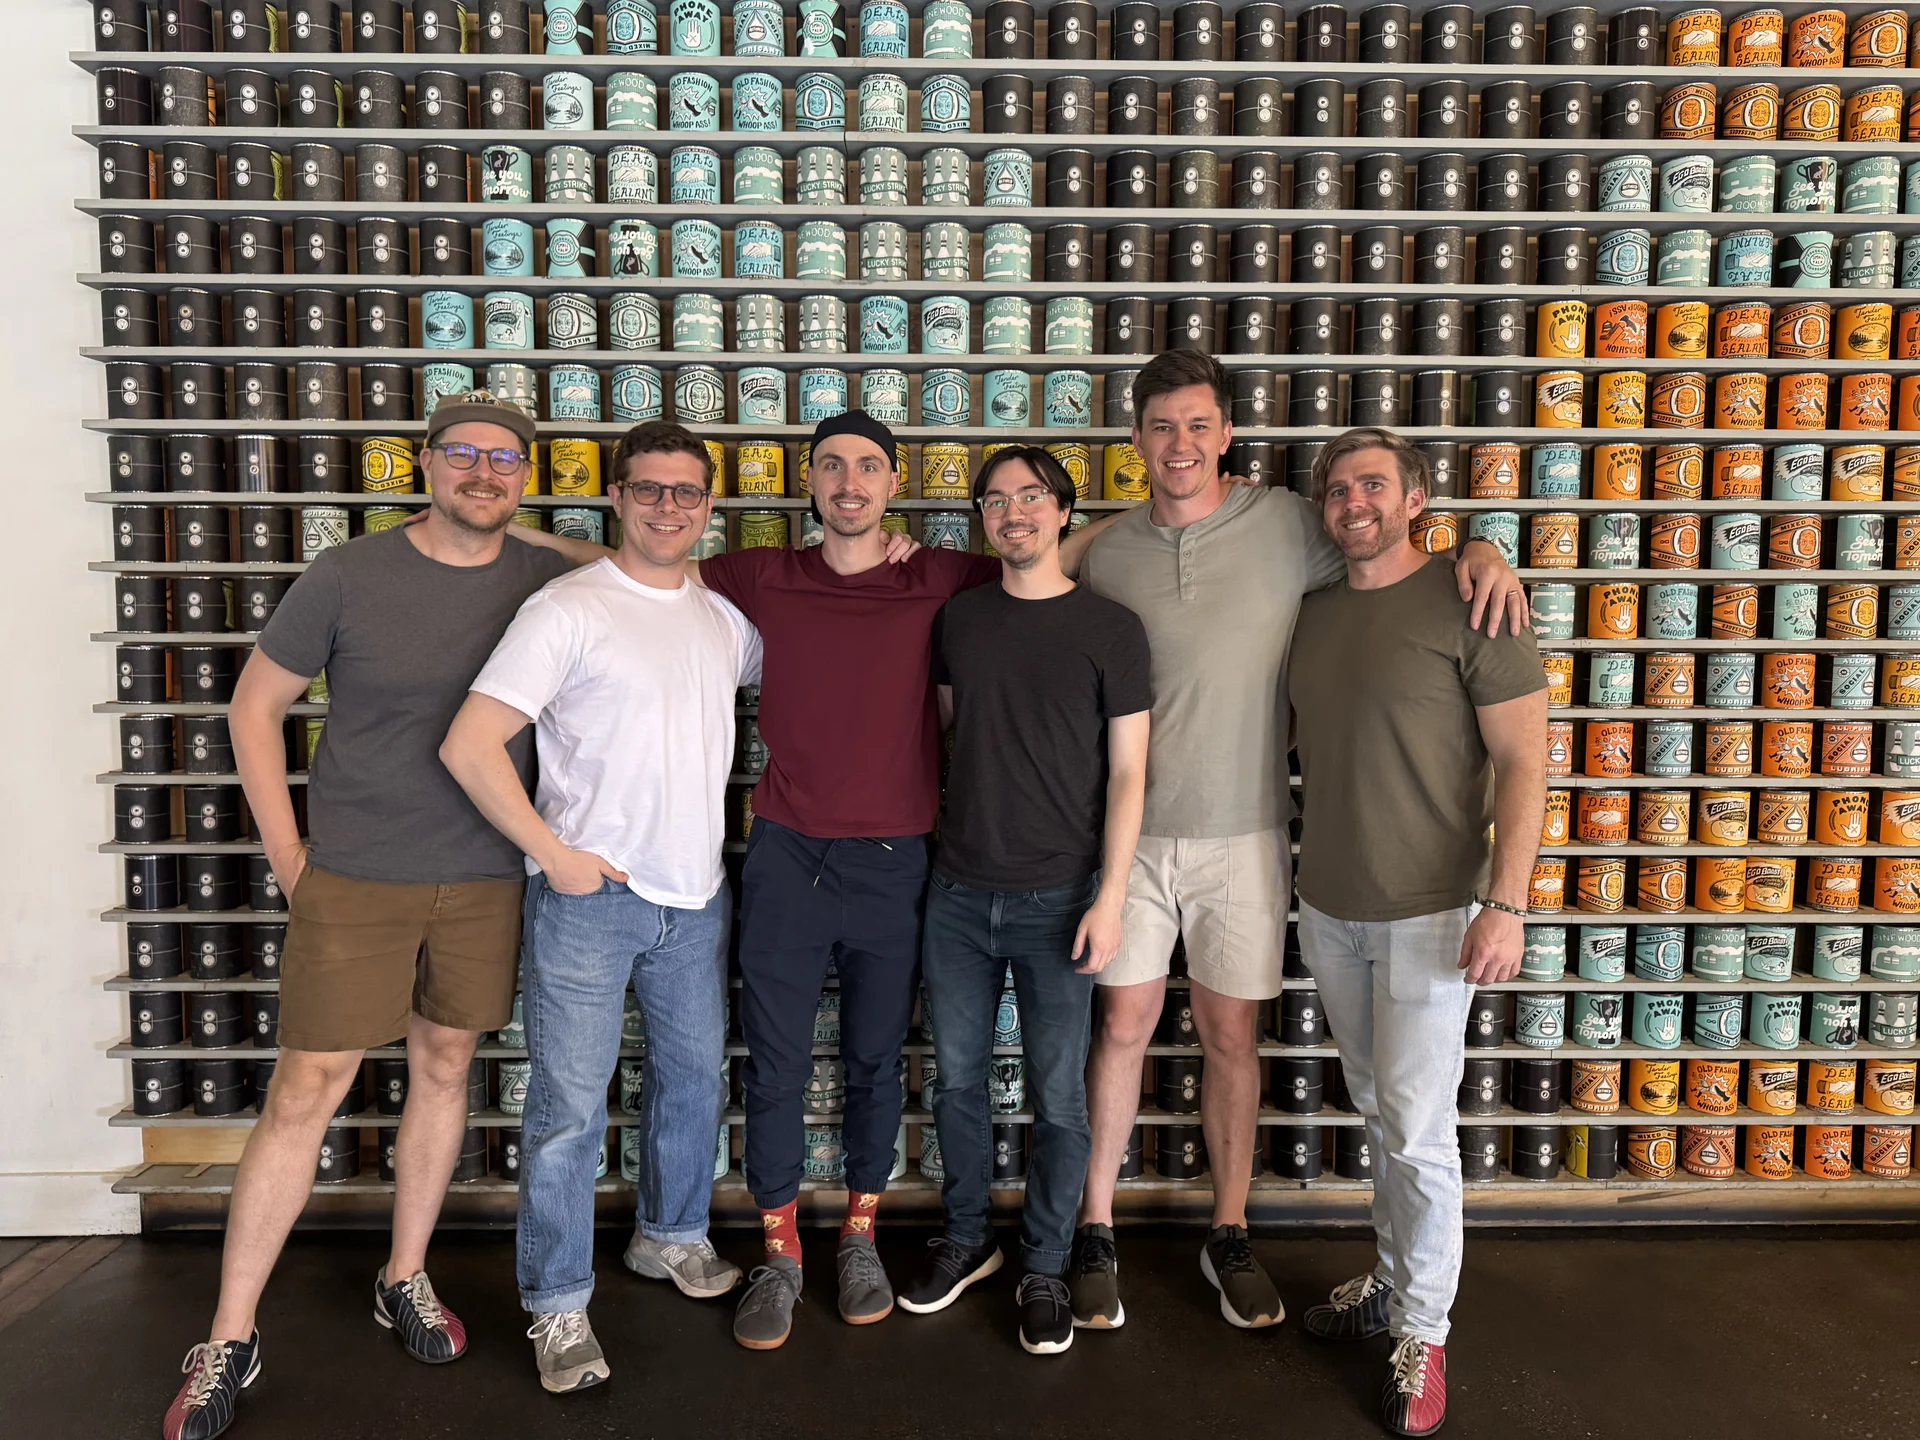
Before I do though, I want to call out and thank @MaxMusing @RobertCooper_RC @KrisLachance @drk and @BryanJacobHunte.
When people hear that Basedash is only 6 people... well they're usually surprised. I know why.
It takes incredible people with incredible talent to build a product like Basedash. Staying lean has allowed us to stay focused, and has kept us all close to the work and our users. I'm sure they'll grow in the future, but we've shipped a remarkable and technically crazy product.
A while ago we had a call with a public company executive for a demo. He said it best, "There's no way we could build this ourselves."
Small teams ship.
Thanks for all of the great times. It's been an incredible ride.

The first hire and the first admin panel
Now let's look back. Let's look at the first versions of Basedash circa early 2021, when I was the first hire out of @ycombinator after leaving @asurion.
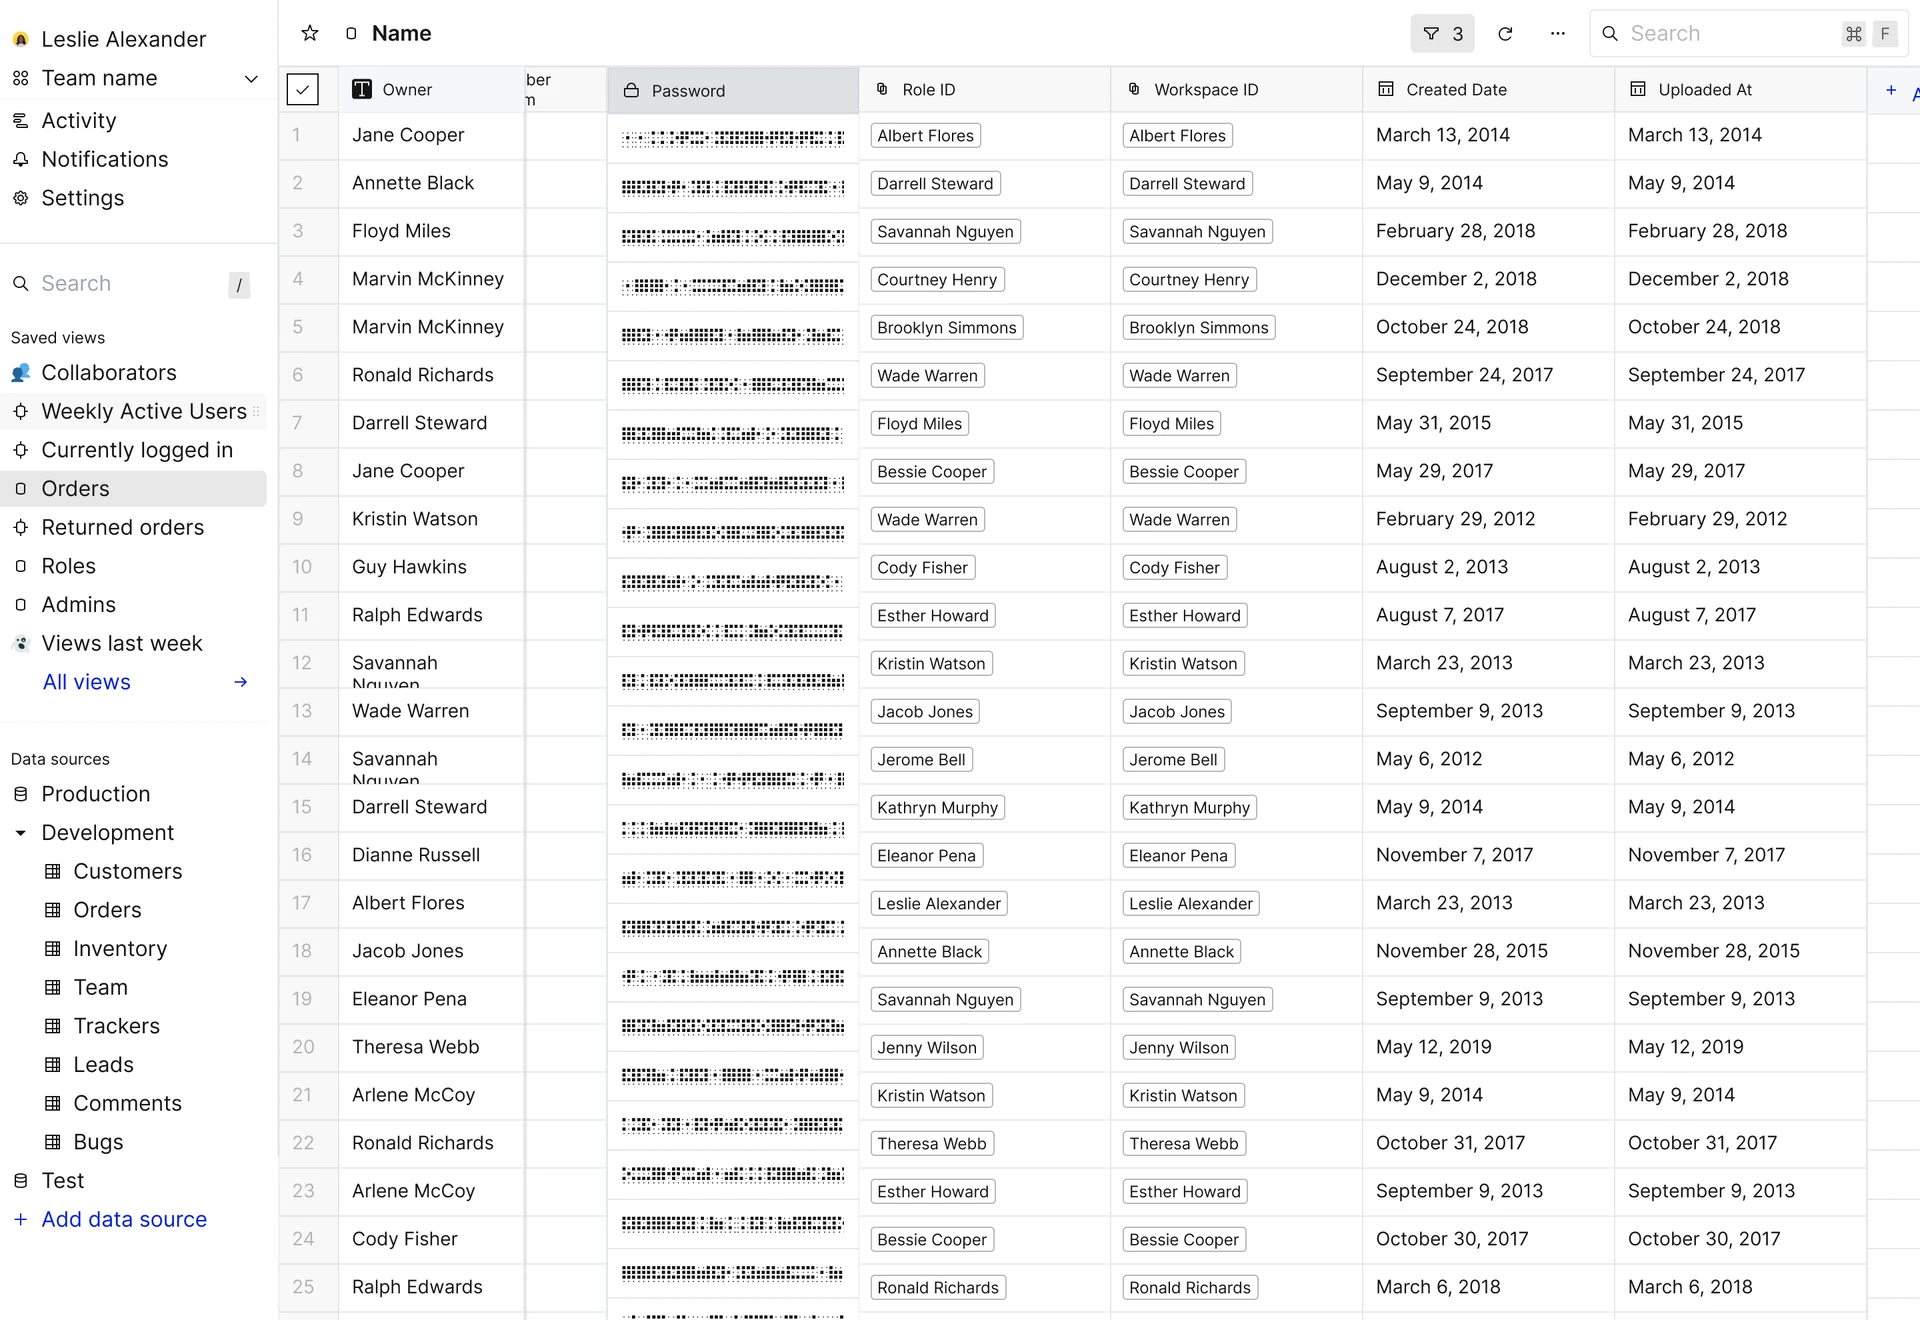
There were just 2 of us. Basedash at that time was a data editing admin panel. "edit your database with the ease of a spreadsheet"
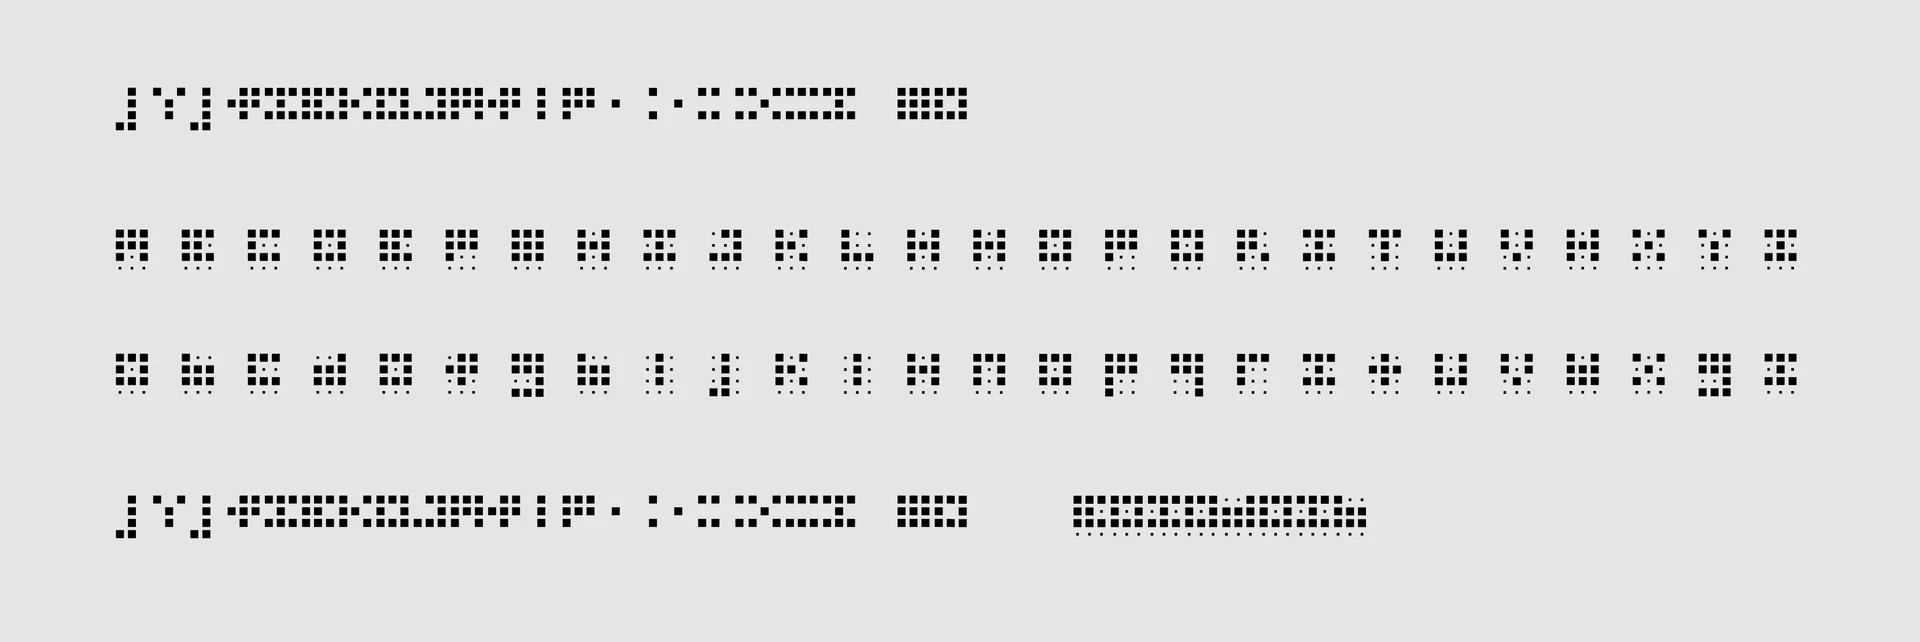
This screen was showing a way of obscuring sensitive data, like passwords, PII, etc. I actually designed a custom font for it, called "Basehash" that we would use to put over a random set of hashed characters. Early dither exploration here.
Finding the first brand
There's also a ton of exploration around a new brand that the incredible team at @form_cap helped us put together.
Shoutout to @michaelbrooksjr @jw for believing in Basedash and working through the first new logo and brand direction. I still like some of these website ideas, now that I look at them...
Internal tools that build themselves
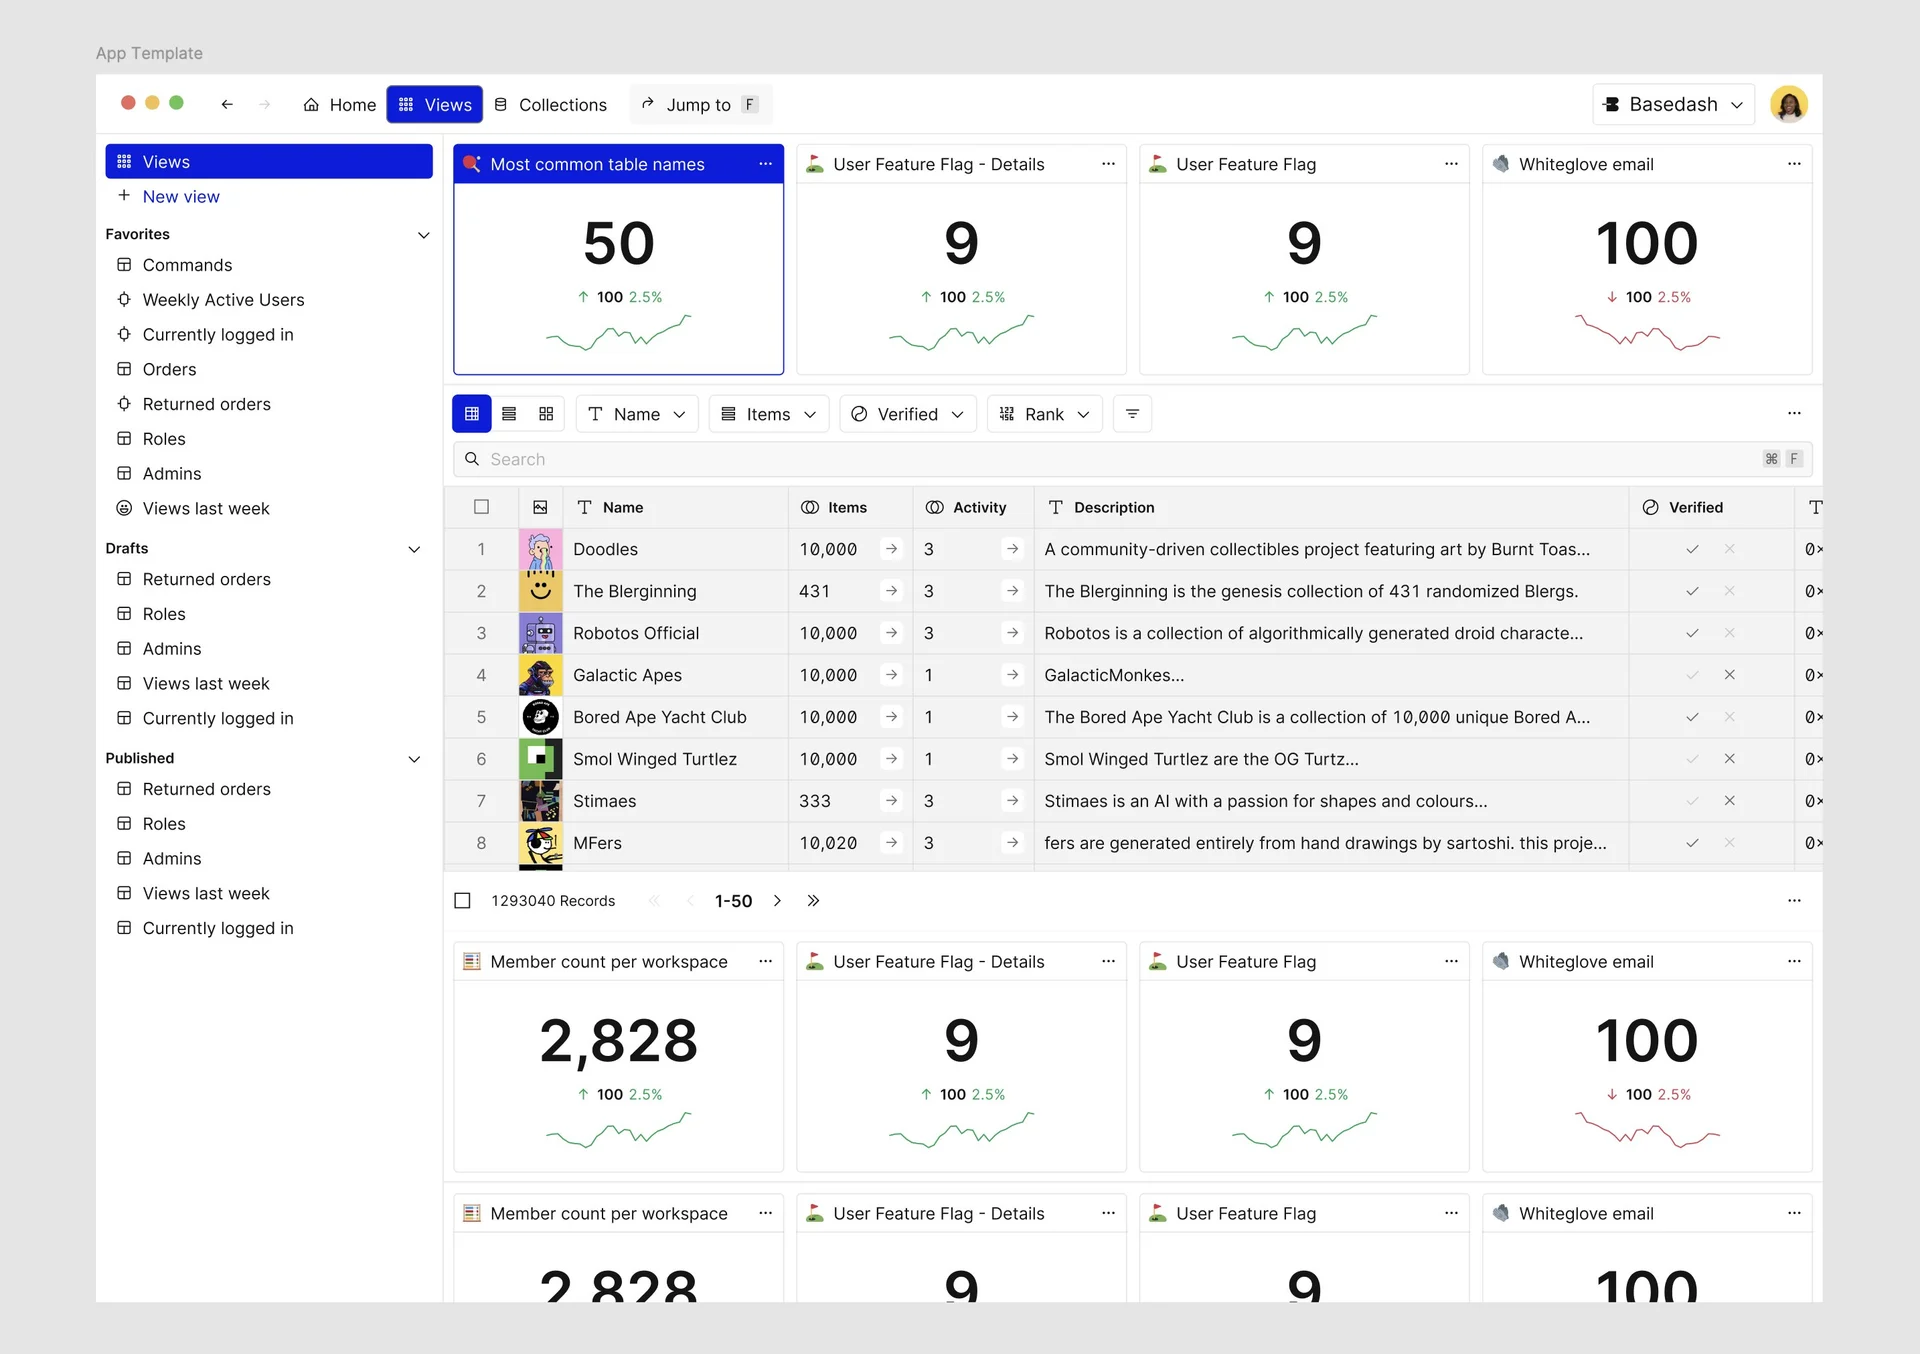
Lots of exploration around what internals would be, how to make them build themselves, very data dense.
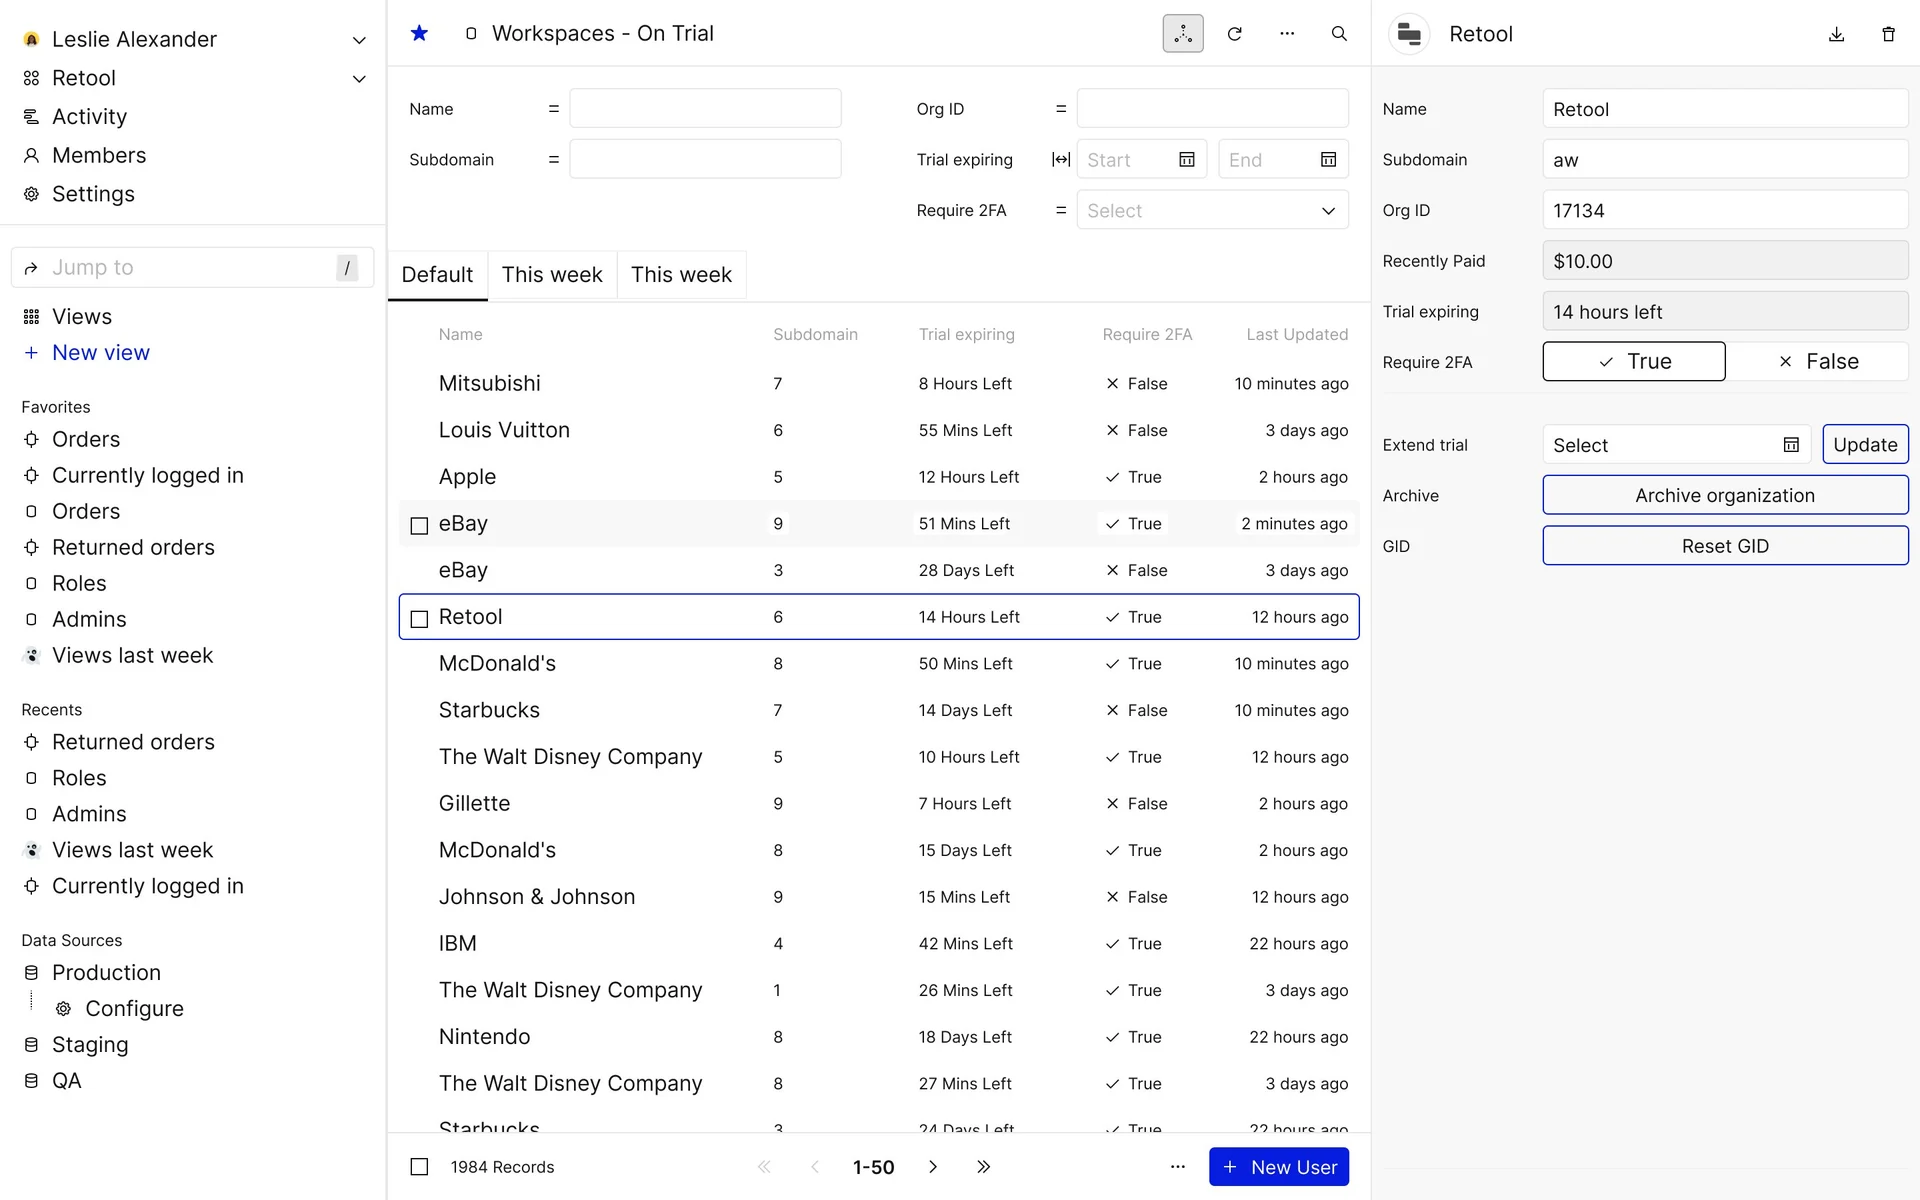
Did a lot of digging into @retool at the time to try to see how they worked with internal tools, so you can see their branding even made it into my mock data. They're still a quasi-competitor, but at the time, I was very focused on differentiating from them
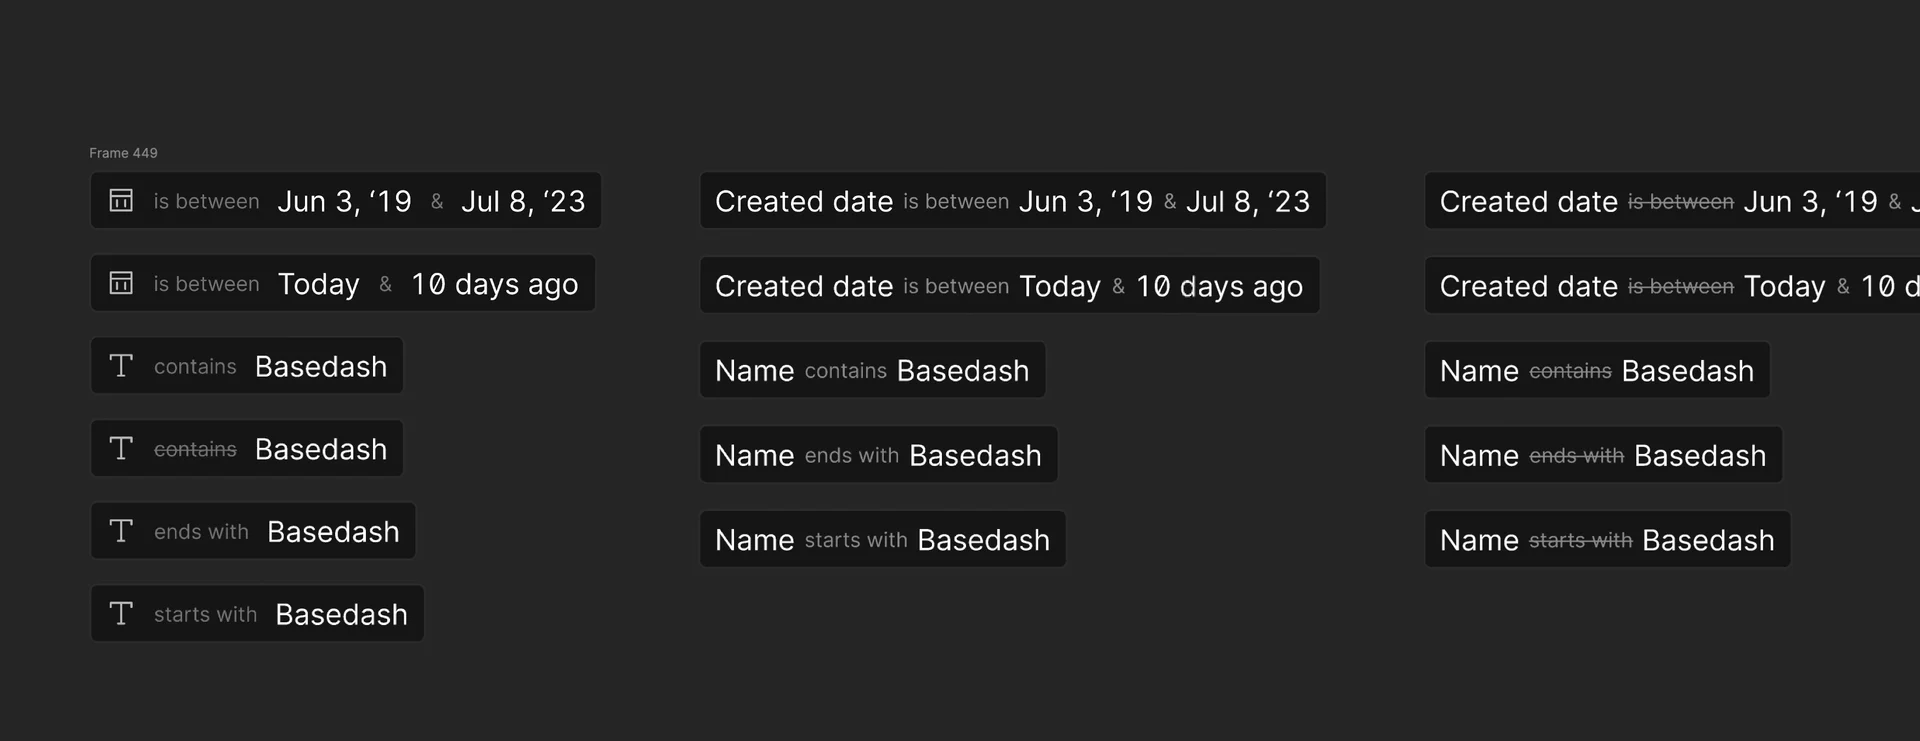
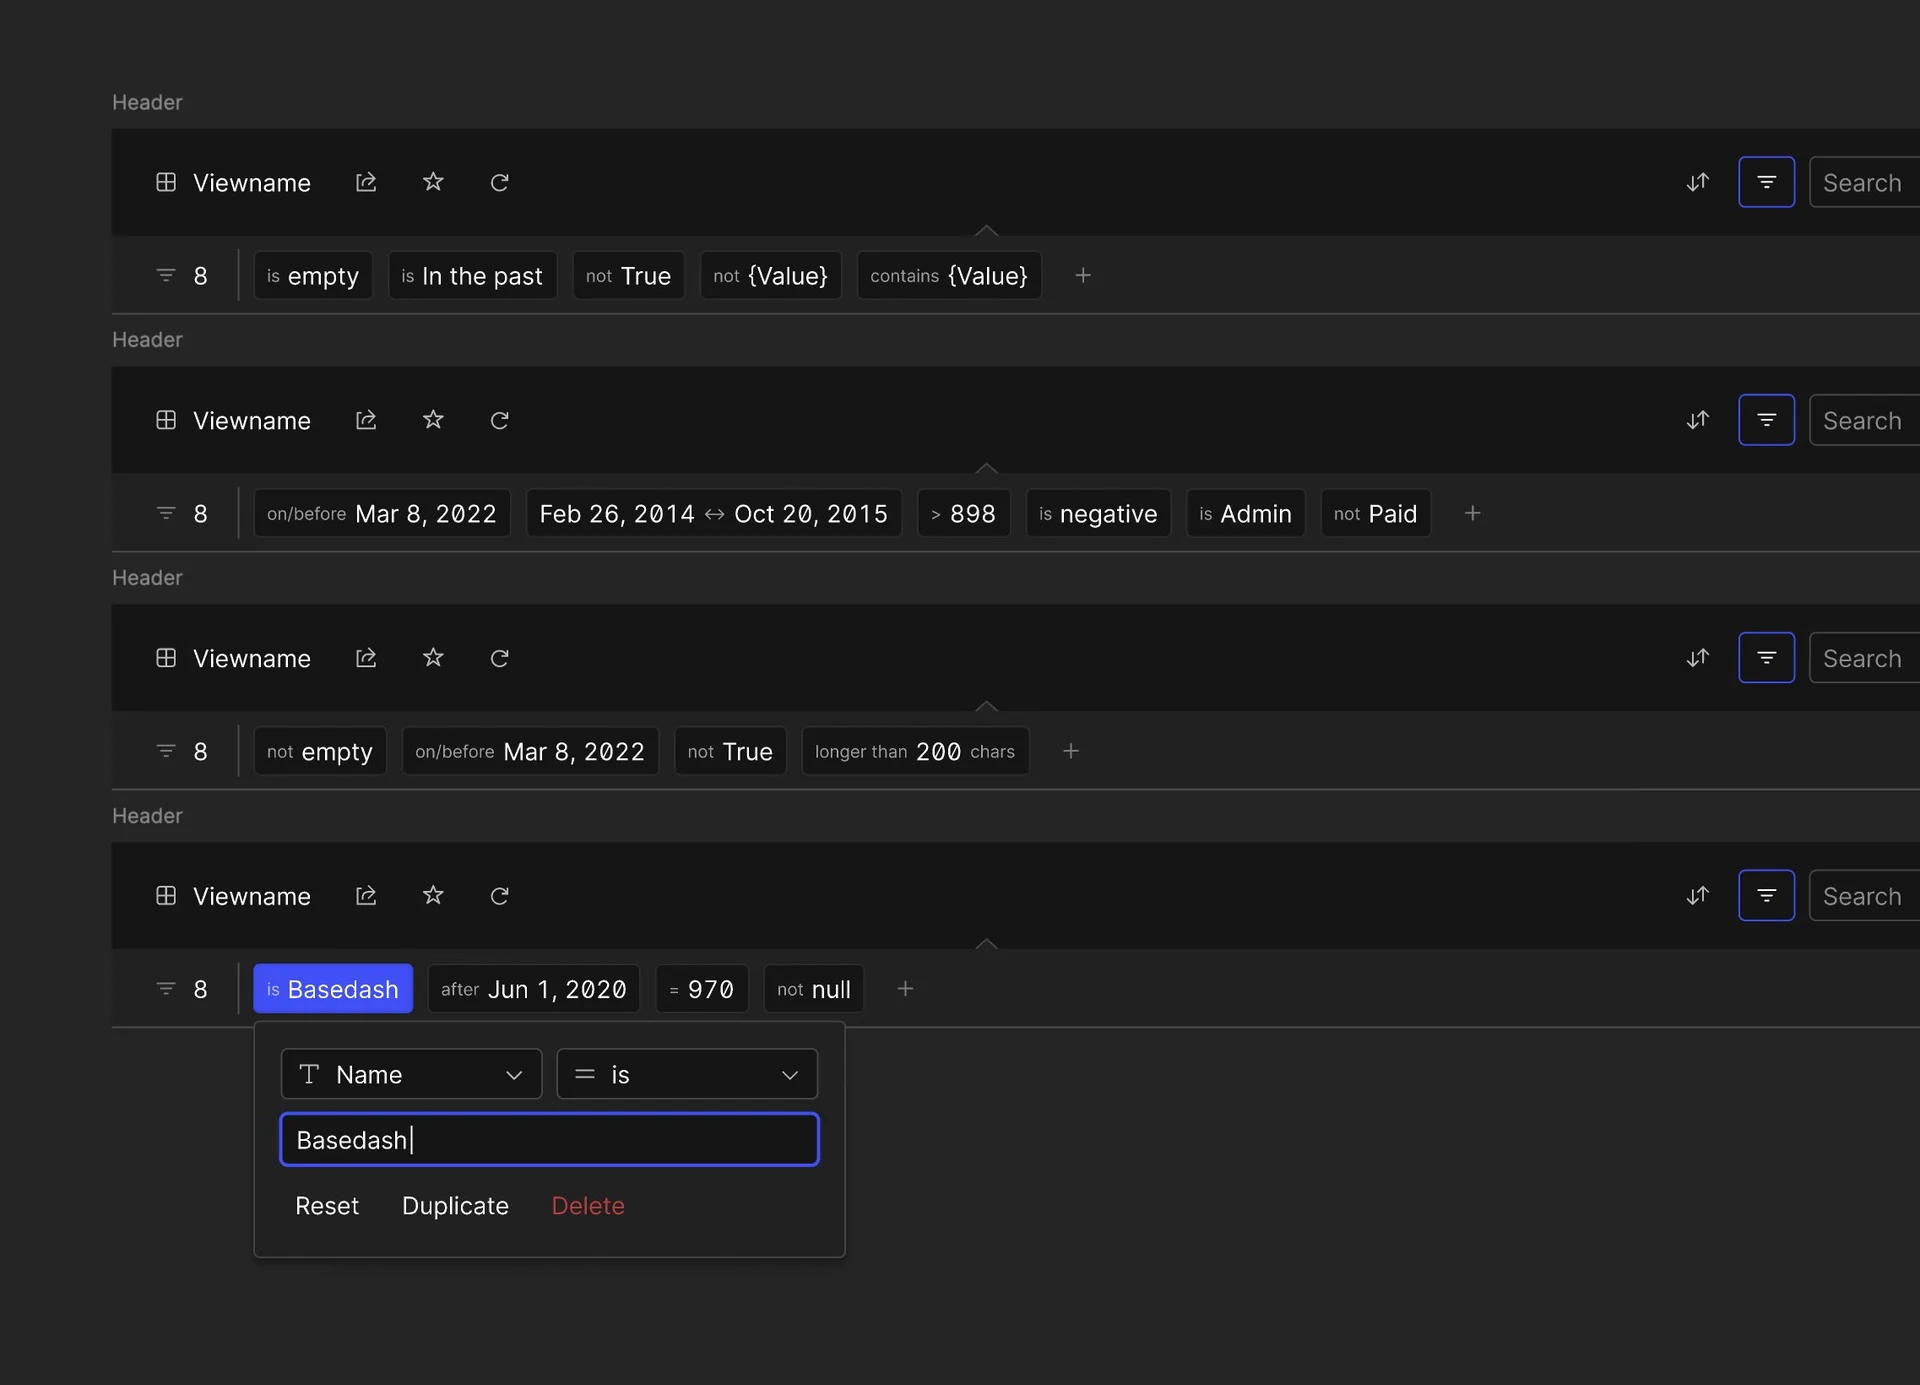
The first screenshot is showing some filter designs that, in hindsight, are terrible. But also some inline actions that I didn't have good solutions for how they would be created.
I was also trying to explore how to represent data in different ways. We use the terminology "view" which ended up being probably a bad decision. Developers would get confused with our definition of the view versus what a data view was in a DB. But I'm still to this day not sure what we would have called it. Page, filter, etc wasn't correct. Naming things is hard.
Navigation, hierarchy, and the cost of hiding complexity
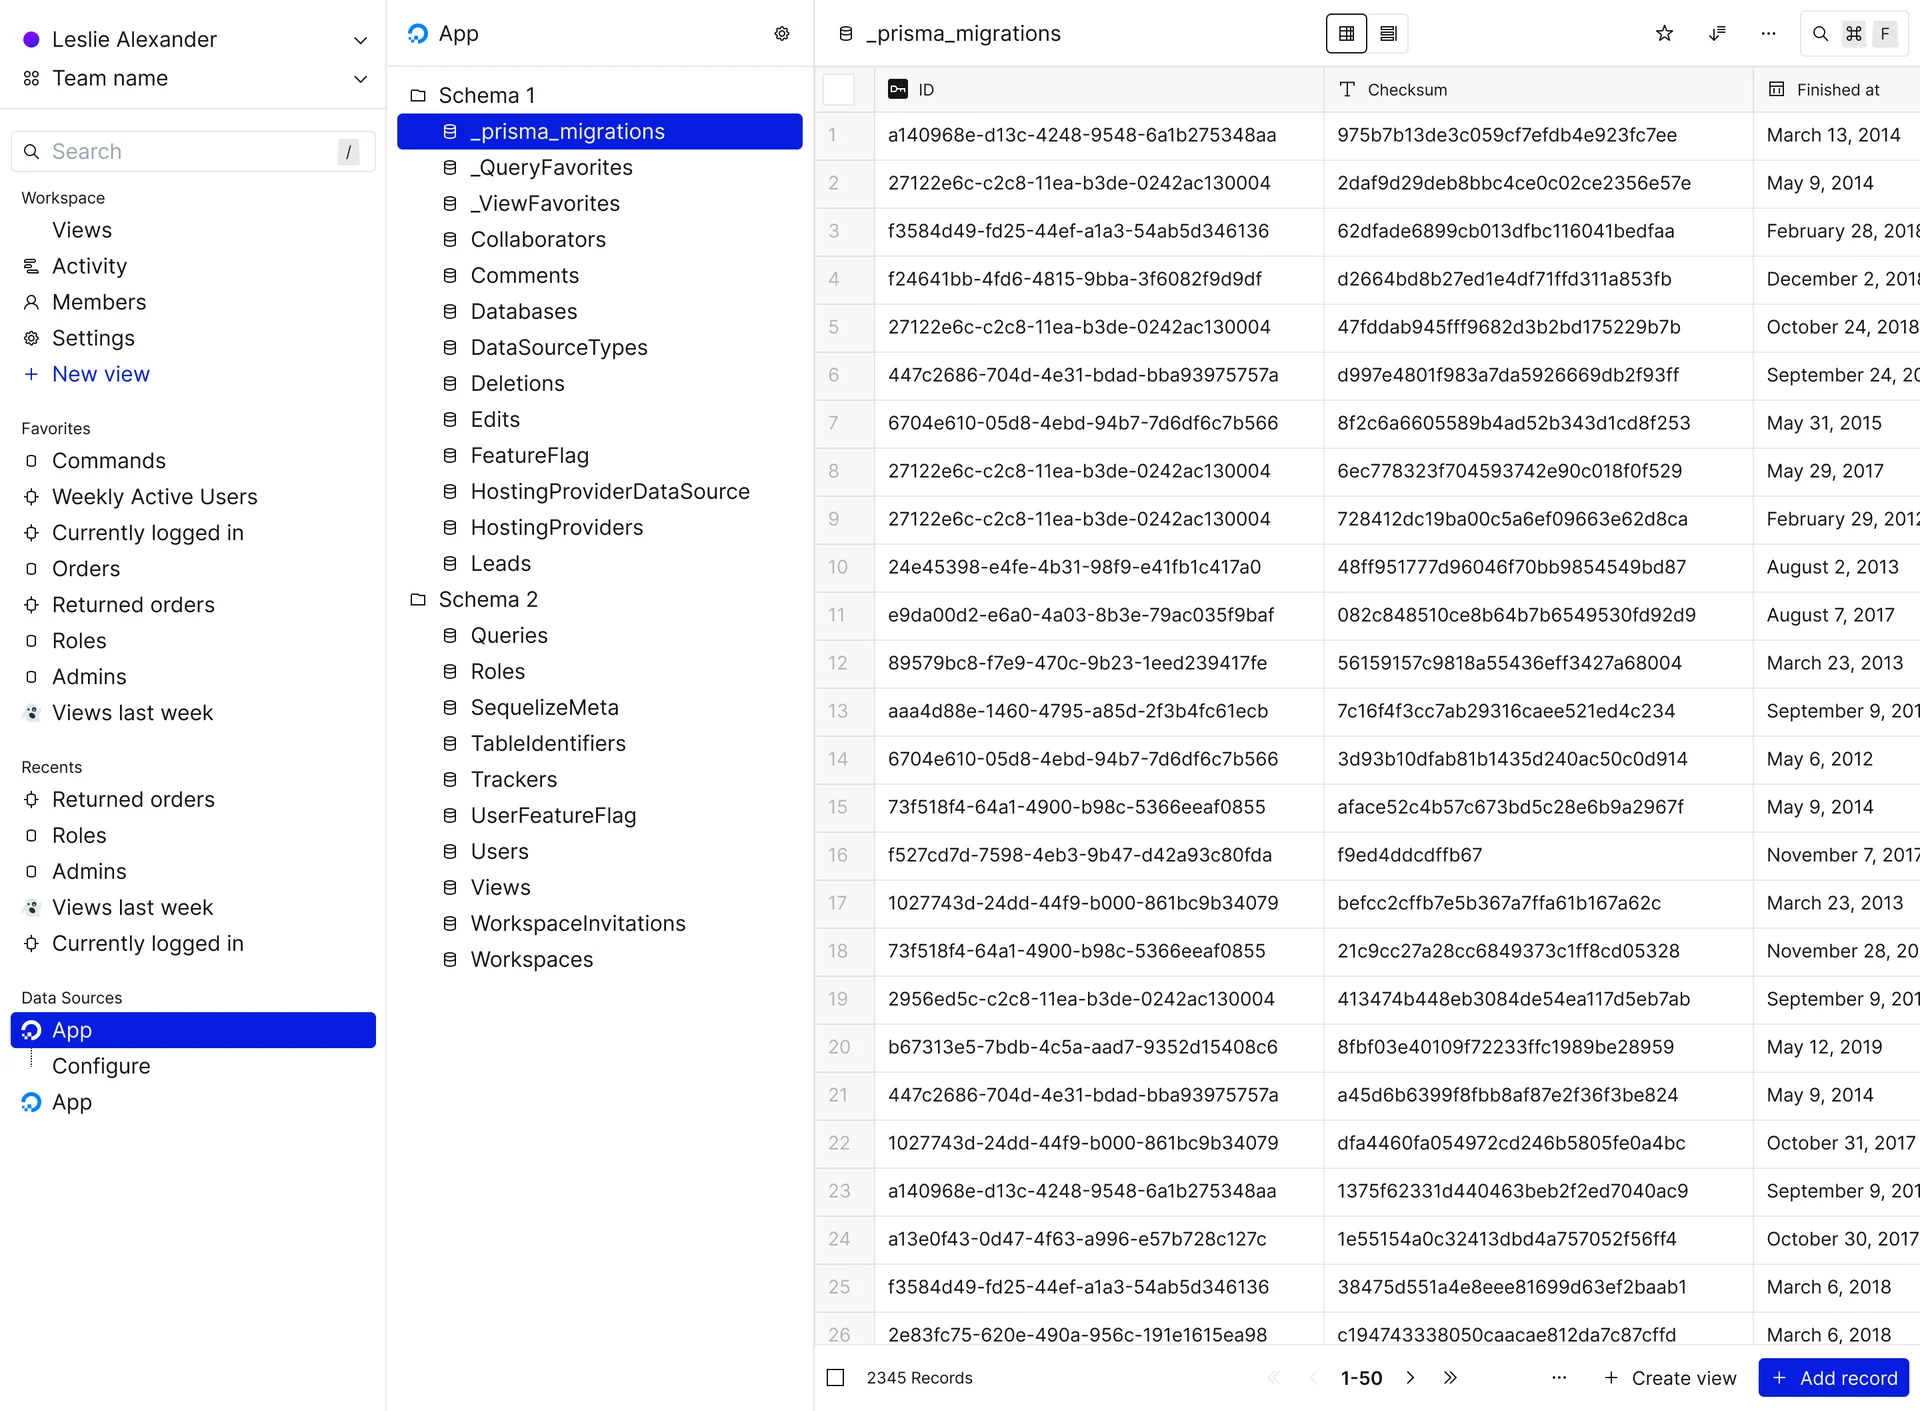
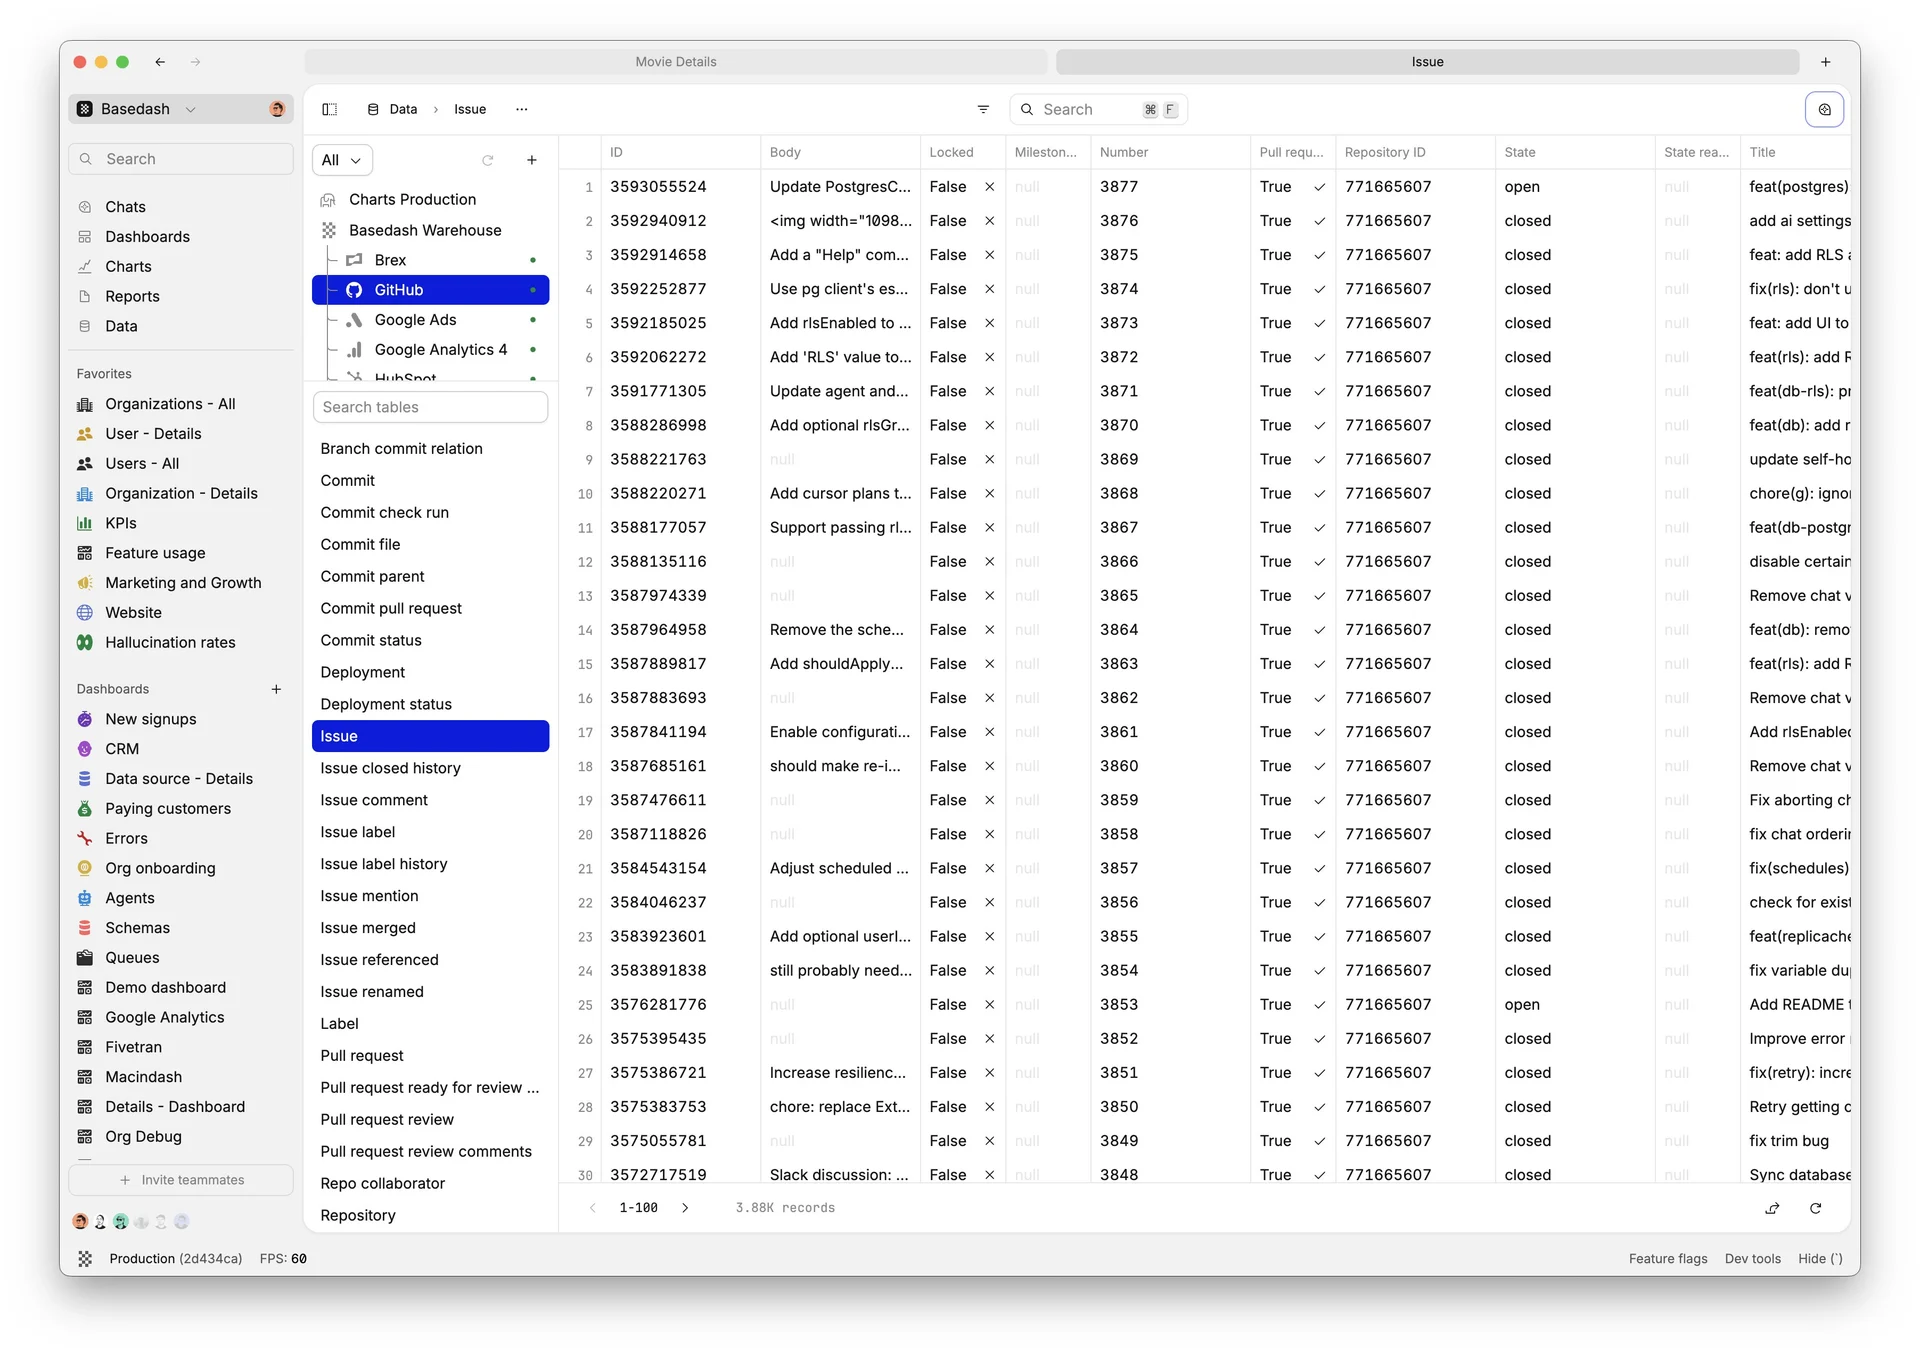
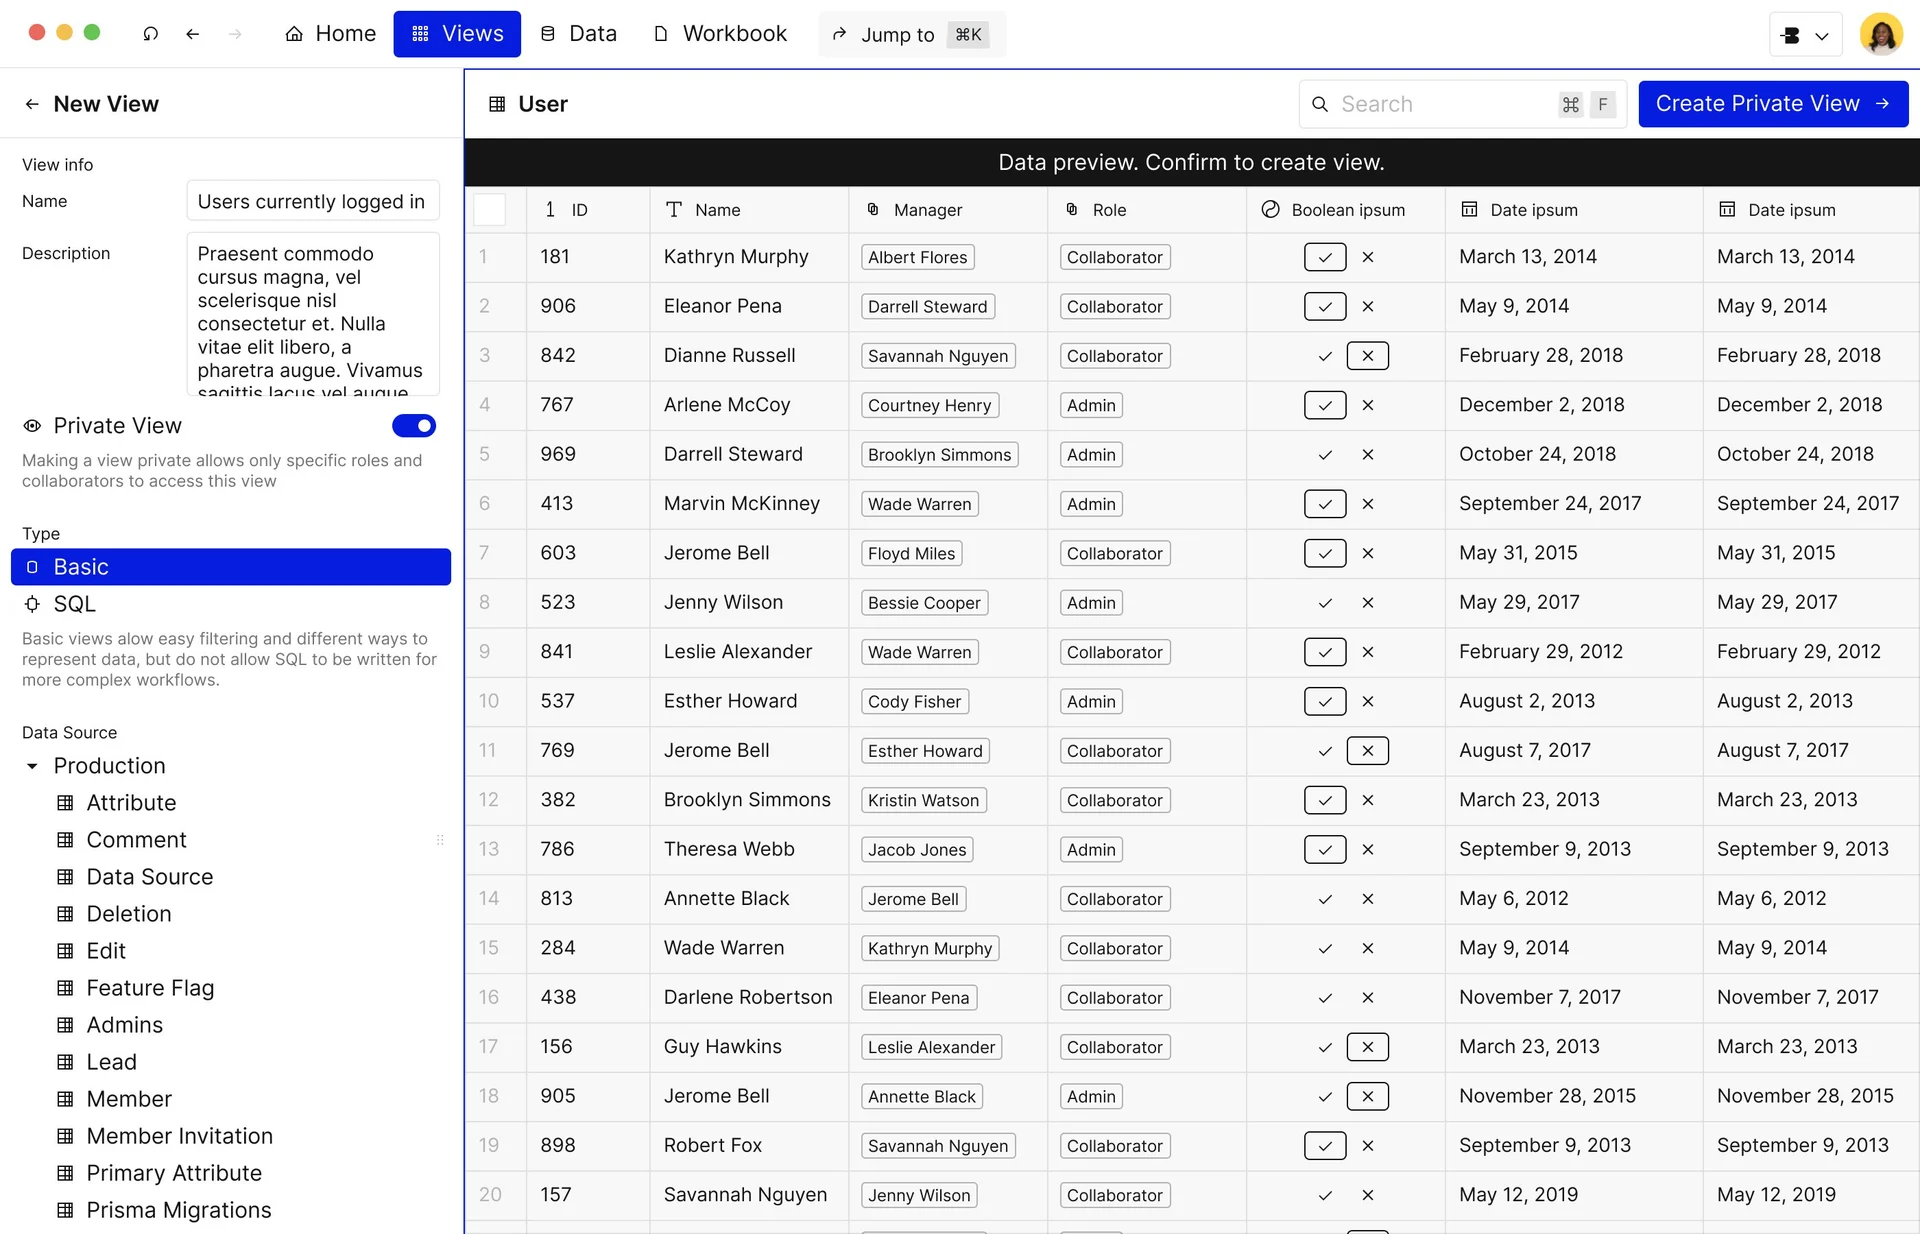
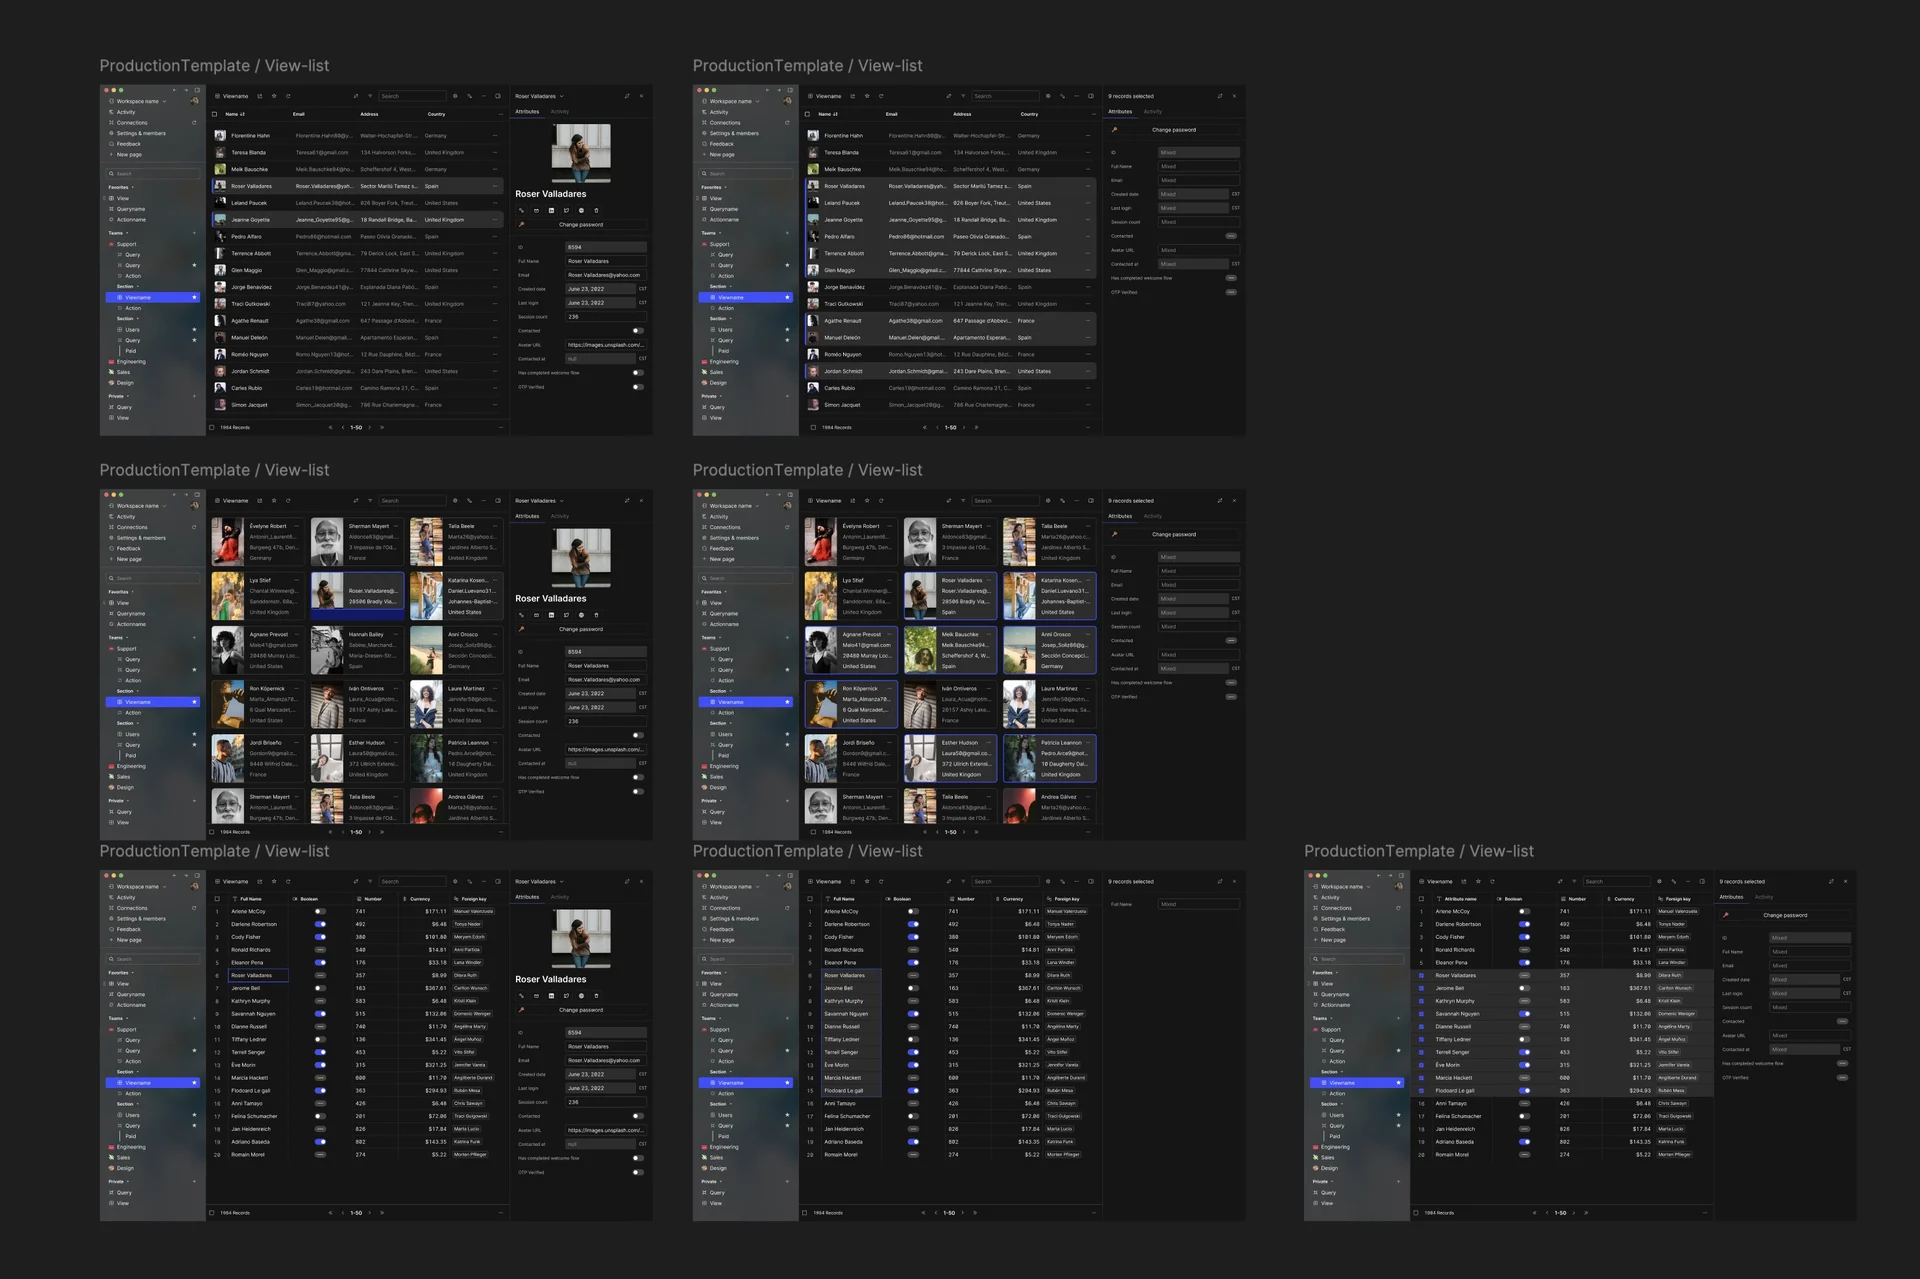
It's interesting to see that a lot of these concepts haven't really changed in four years, specifically around the data explorer. Here's a screenshot of what we had then versus what Basedash looks like now.
The thing I know definitively is that navigation is one of the most important things about an application. Making sure that it's as flat as possible so that people can bounce around quickly and find what they're looking for, rather than burying things in submenus and nested behaviors. Early on I tried to bury a lot of complexity by doing this, but what happened was that ended up burying a lot of functionality, and made it difficult to discover.
So many tiny tweaks to make things easy to navigate when you've got massive data sets.
It's also worth noting that in the last screenshot, the thing that jumps out to me is how the app itself shares hierarchy with the content.
One thing we did in the last maybe six months was to separate the user content into the white backdrop and make sure that the application always felt like it was a backdrop.
It really frames the dashboards or data much more effectively and makes it clear that there is what you have brought to the table versus what the application is rendering. Feels a lot cleaner.
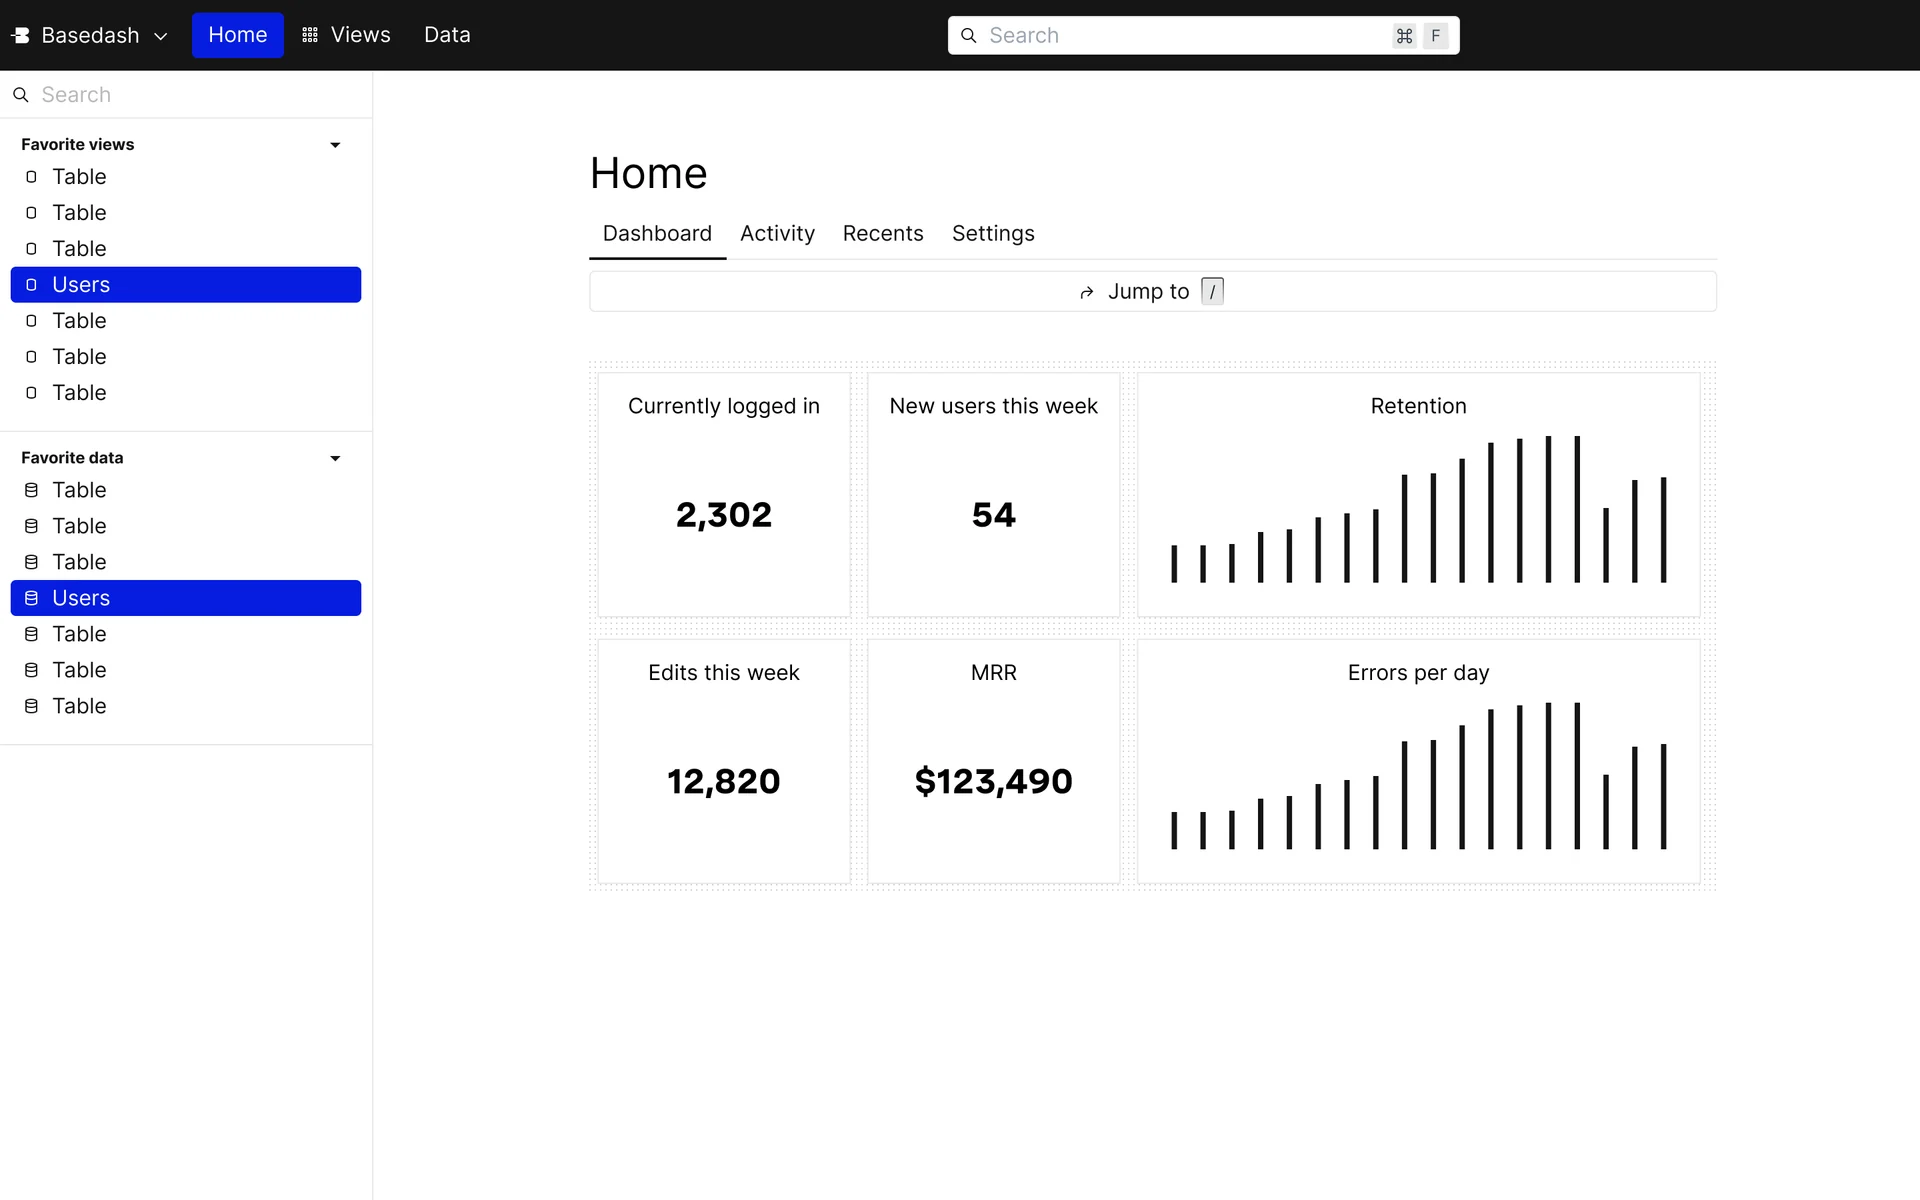
Speaking of navigation, here's a top nav that existed for a while. Notice I'm also using the same color for selection of items as I am for primary buttons. That was a big mistake and it took me a while to unlearn that.
I figured a primary color being high contrast would be great for both situations, but in the end it just leads to confusing patterns.
Also, this top nav made it so that we couldn't do actual tabs, so we went back to the side nav. I advocated for it because it was a gain of horizontal real estate, but in hindsight, it was the wrong solution to that. I also tried to get rid of navigation altogether when we pivoted to a BI tool, but pretty quickly learned that users needed a persistent nav.
Data settings and the first onboarding concepts
Oh man, another one that really bothered me for a long time.
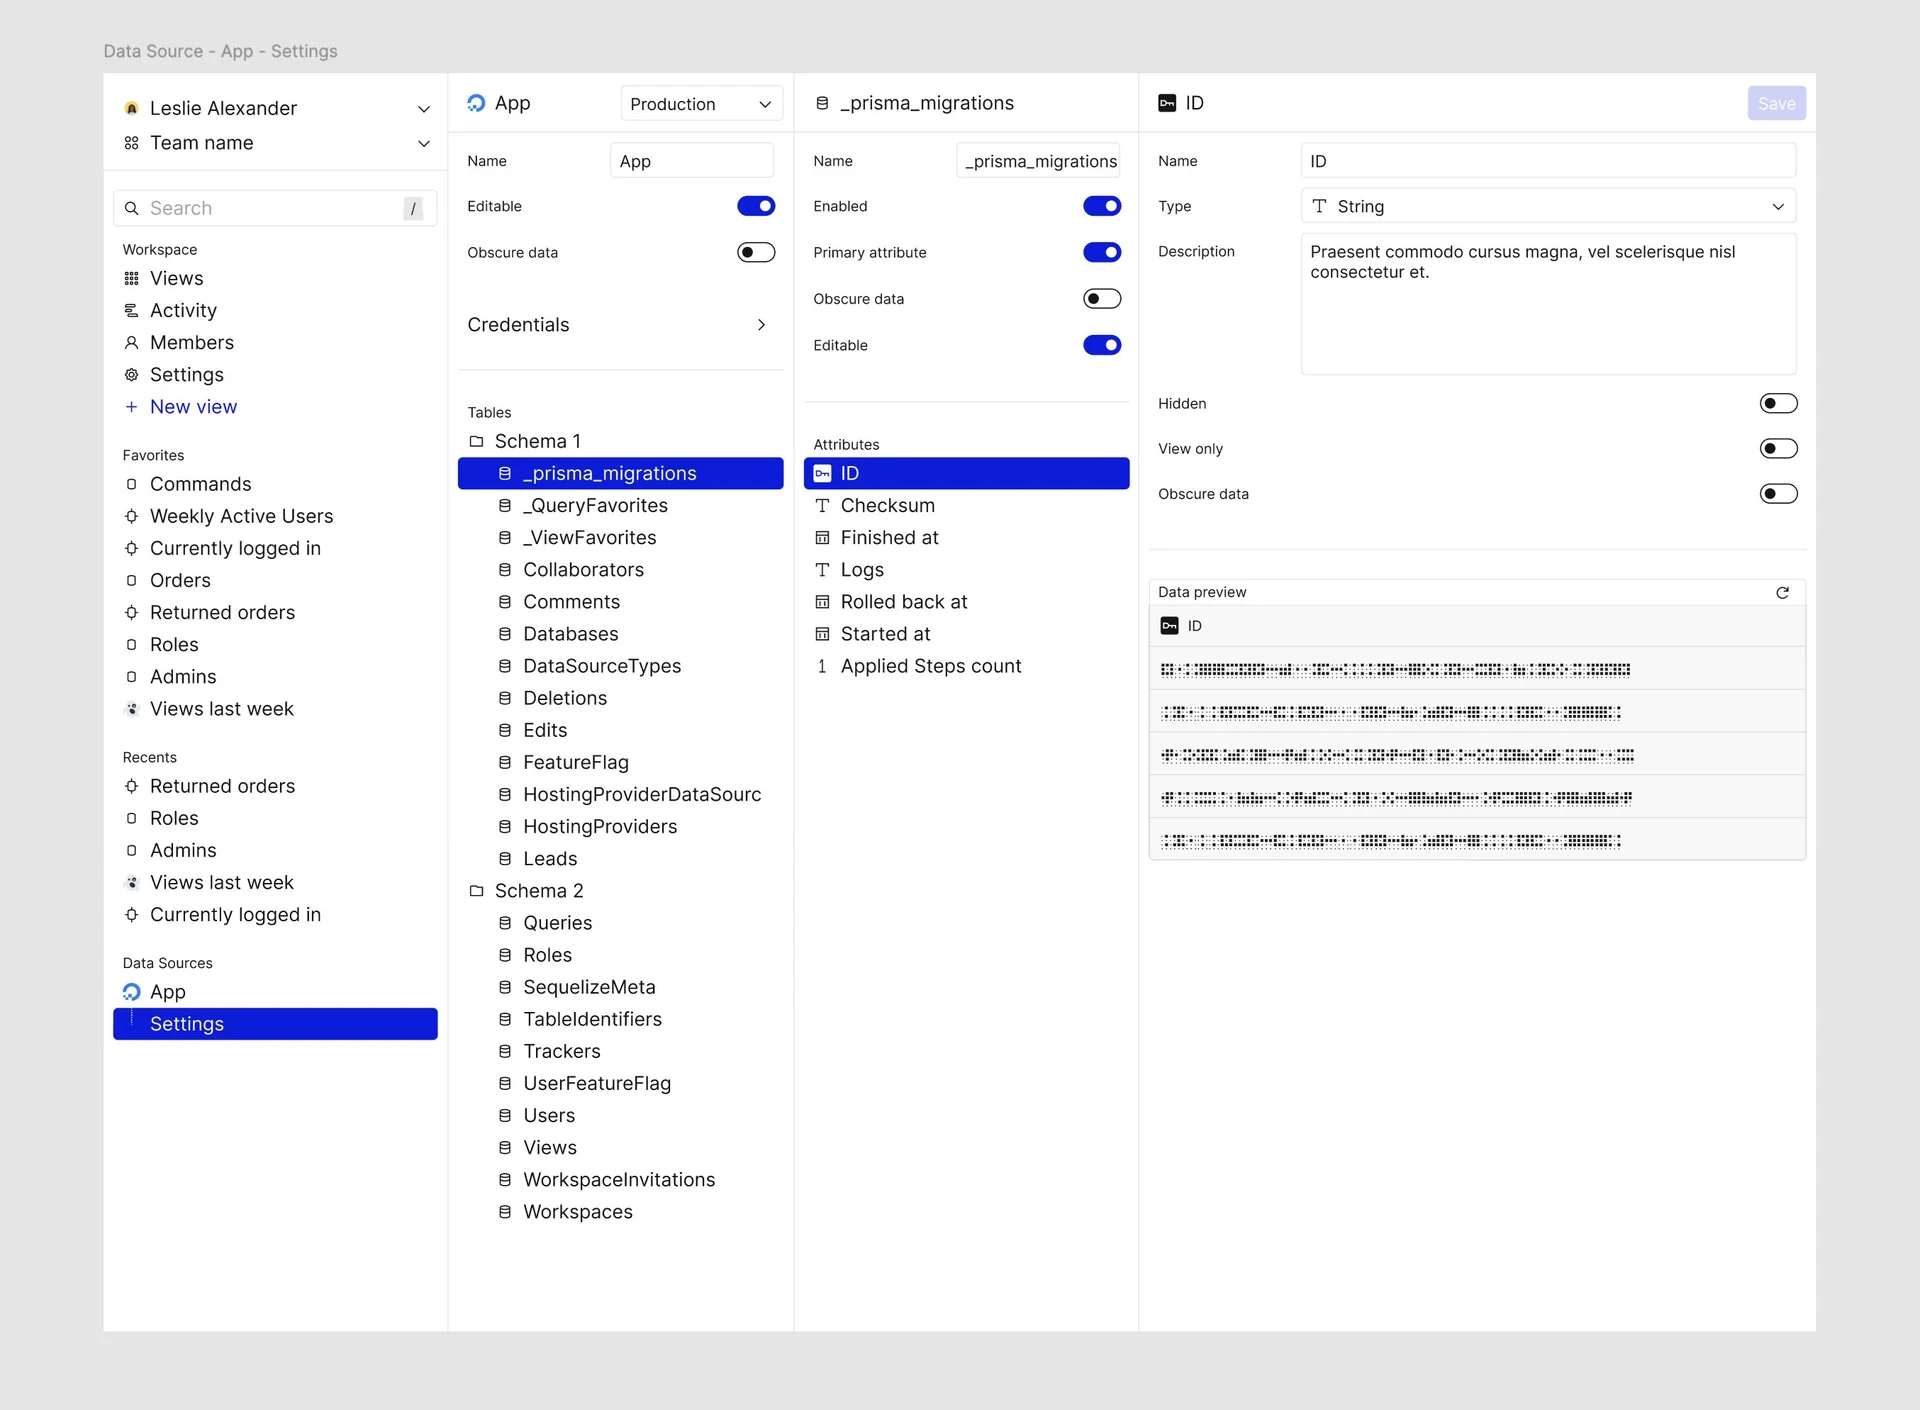
This is how we used to have data source settings for schemas, tables, and columns, with the data preview. I was trying to pull inspiration from the way Finder works with nested folders in the cascading column view, but what ended up happening was a really confusing layout, difficult resizability, and people getting lost in multiple layers of data configuration. It seemed like a more elegant pattern, but in these regards, a clear nesting structure works out better.
The second recording shows how we do things now. It is higher friction, to be sure. And that's some feedback that we do get. It's like, "I don't want to have to click so many times." But at the end of the day, these are very unused settings that can still be accessed by right-clicking on column titles. It's more clicks, but less visual noise. Very clear what you're defining versus what you're not defining. Also, better to be in a modal because then we can layer this at any experience, as opposed to it being a page where we'd have to navigate you to and potentially break the chain of flow that you were in.
Making modals and settings is hard.
Ohhh original logo.
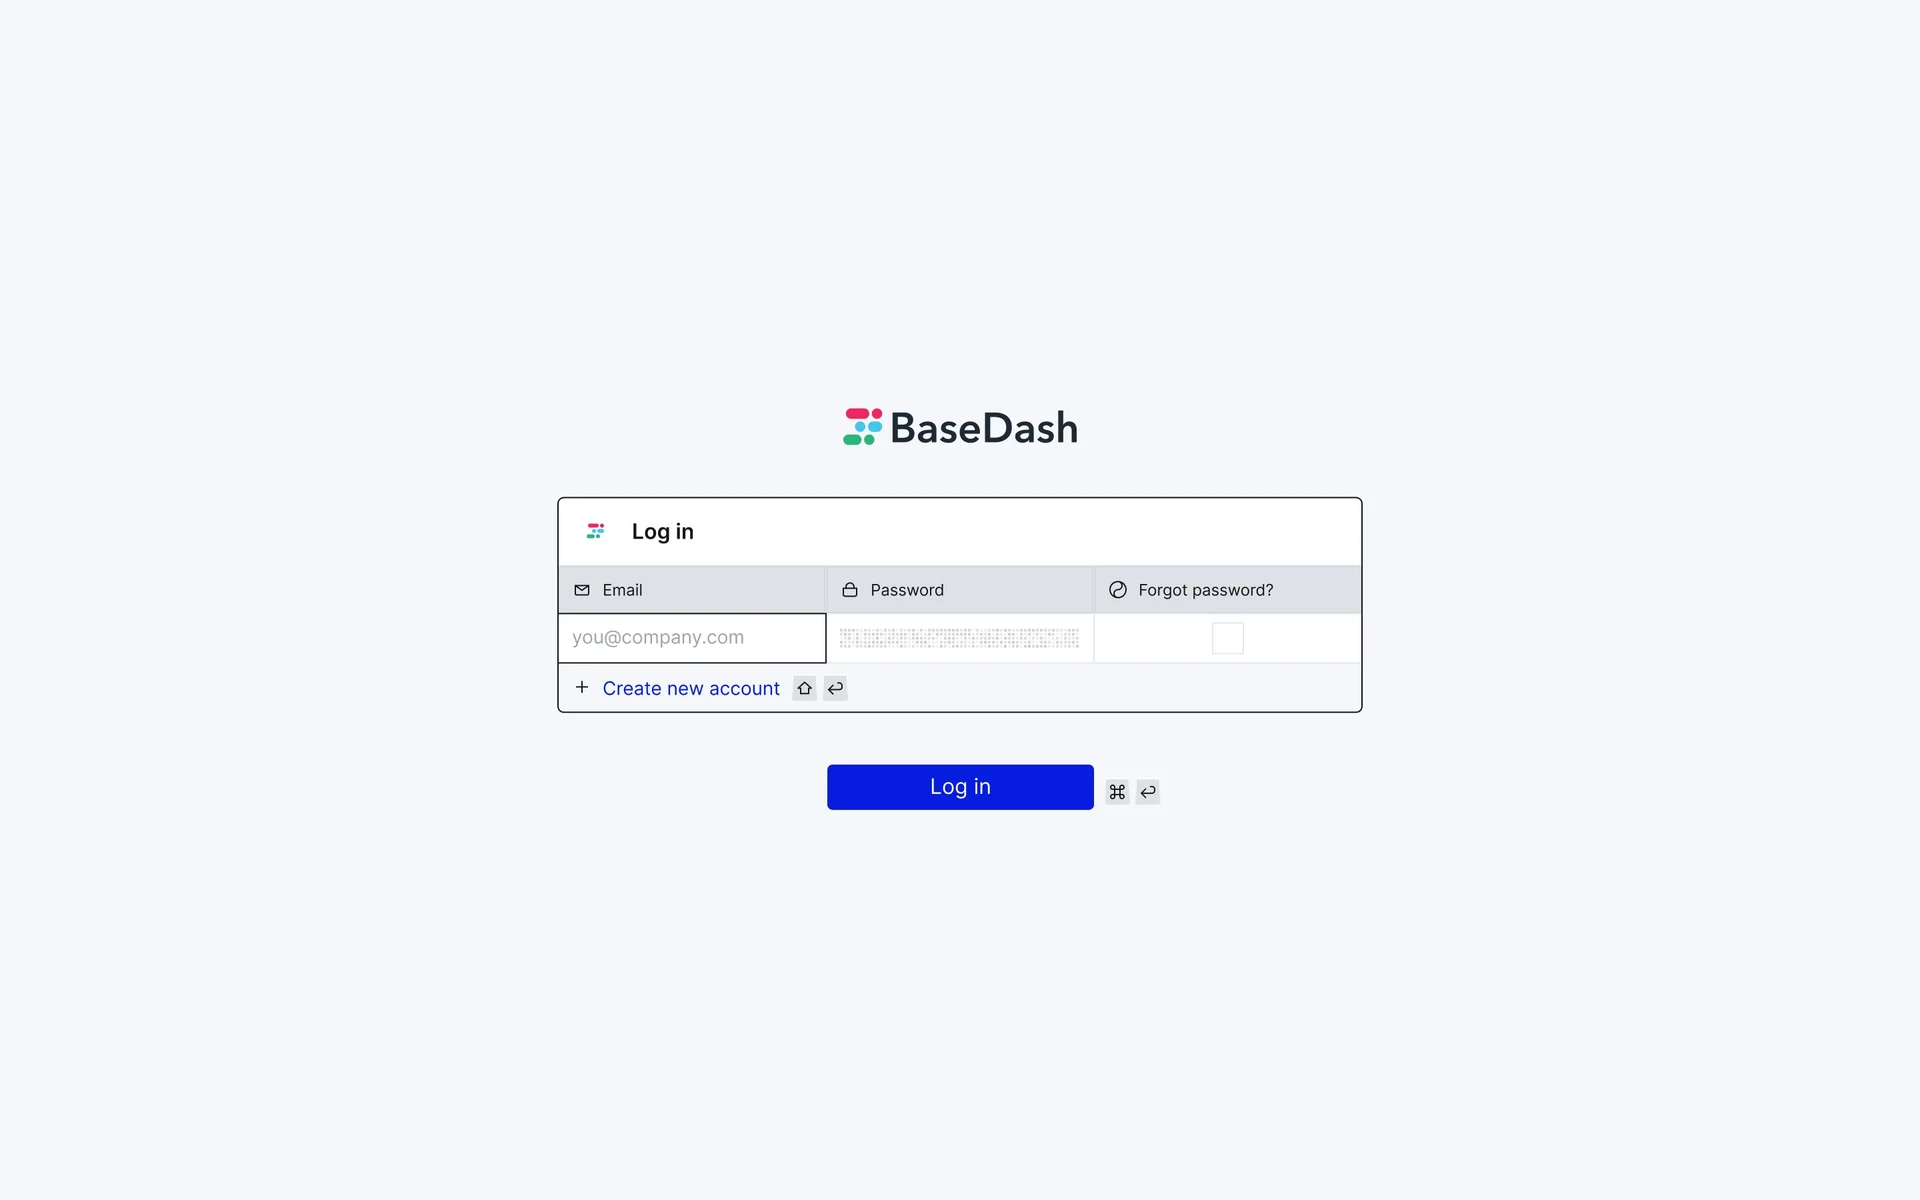
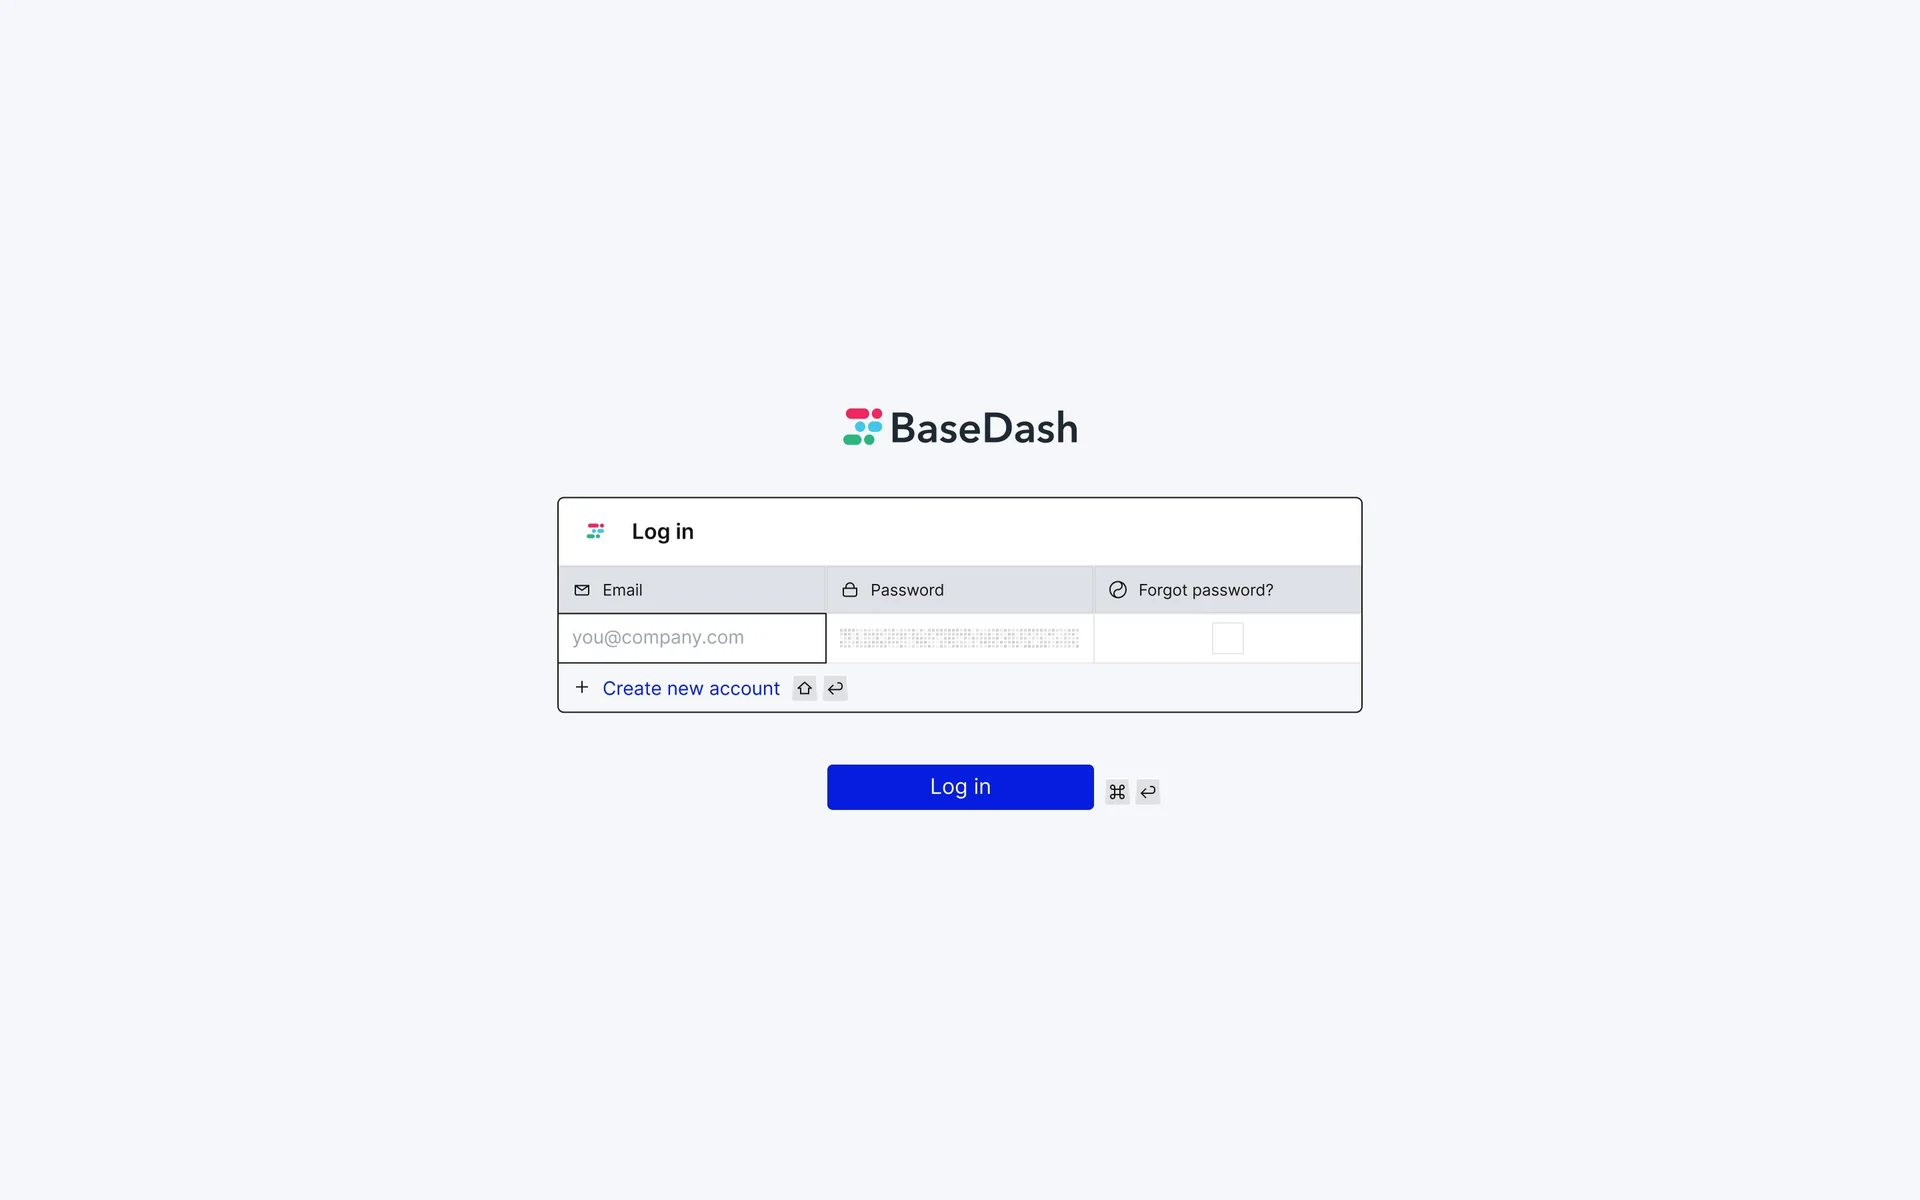
This was a login page and onboarding flow concept where the UI would look like a database table. I actually built out the whole thing in Webflow as a test, and it was kind of cool.
Didn't ever make the cut though.
Early dashboards, homepages, and teamspaces
Dashboard exploration...
This was way back. We didn't do any type of data visualization. But we also realized, mistakenly, that people didn't want a different dashboard tool than what they already had. It took us another two years before we added charts.
And then we pivoted shortly after because people only wanted charts... I remember saying at the time, "we're not going to compete with tools like Metabase, Tableau, and Power BI."
oh sweet, sweet baby child.
Now we're into 2022 stuff.
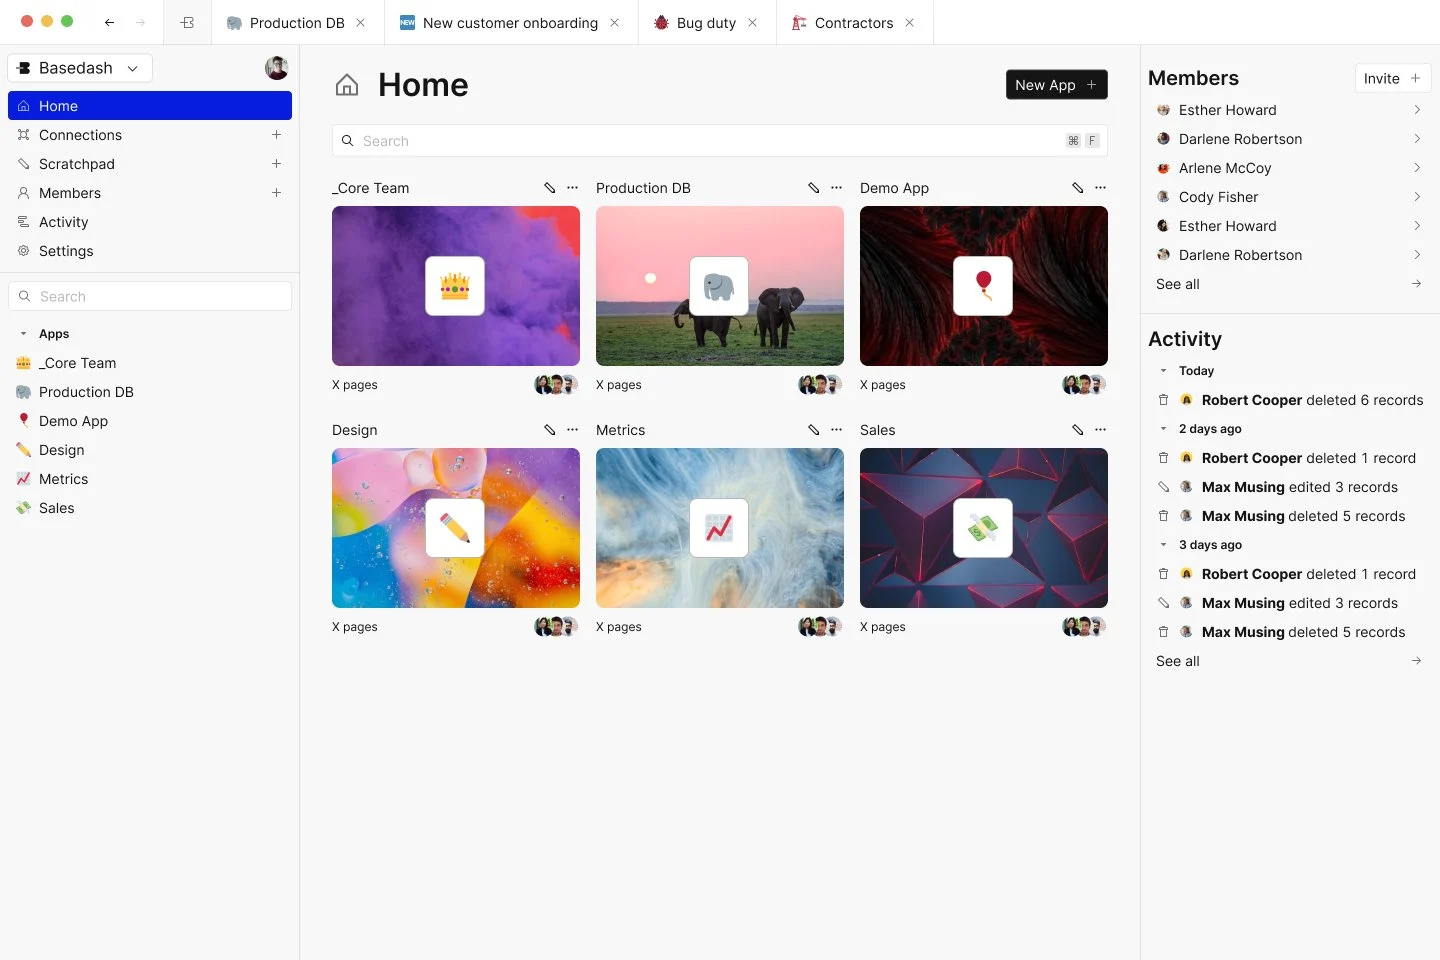
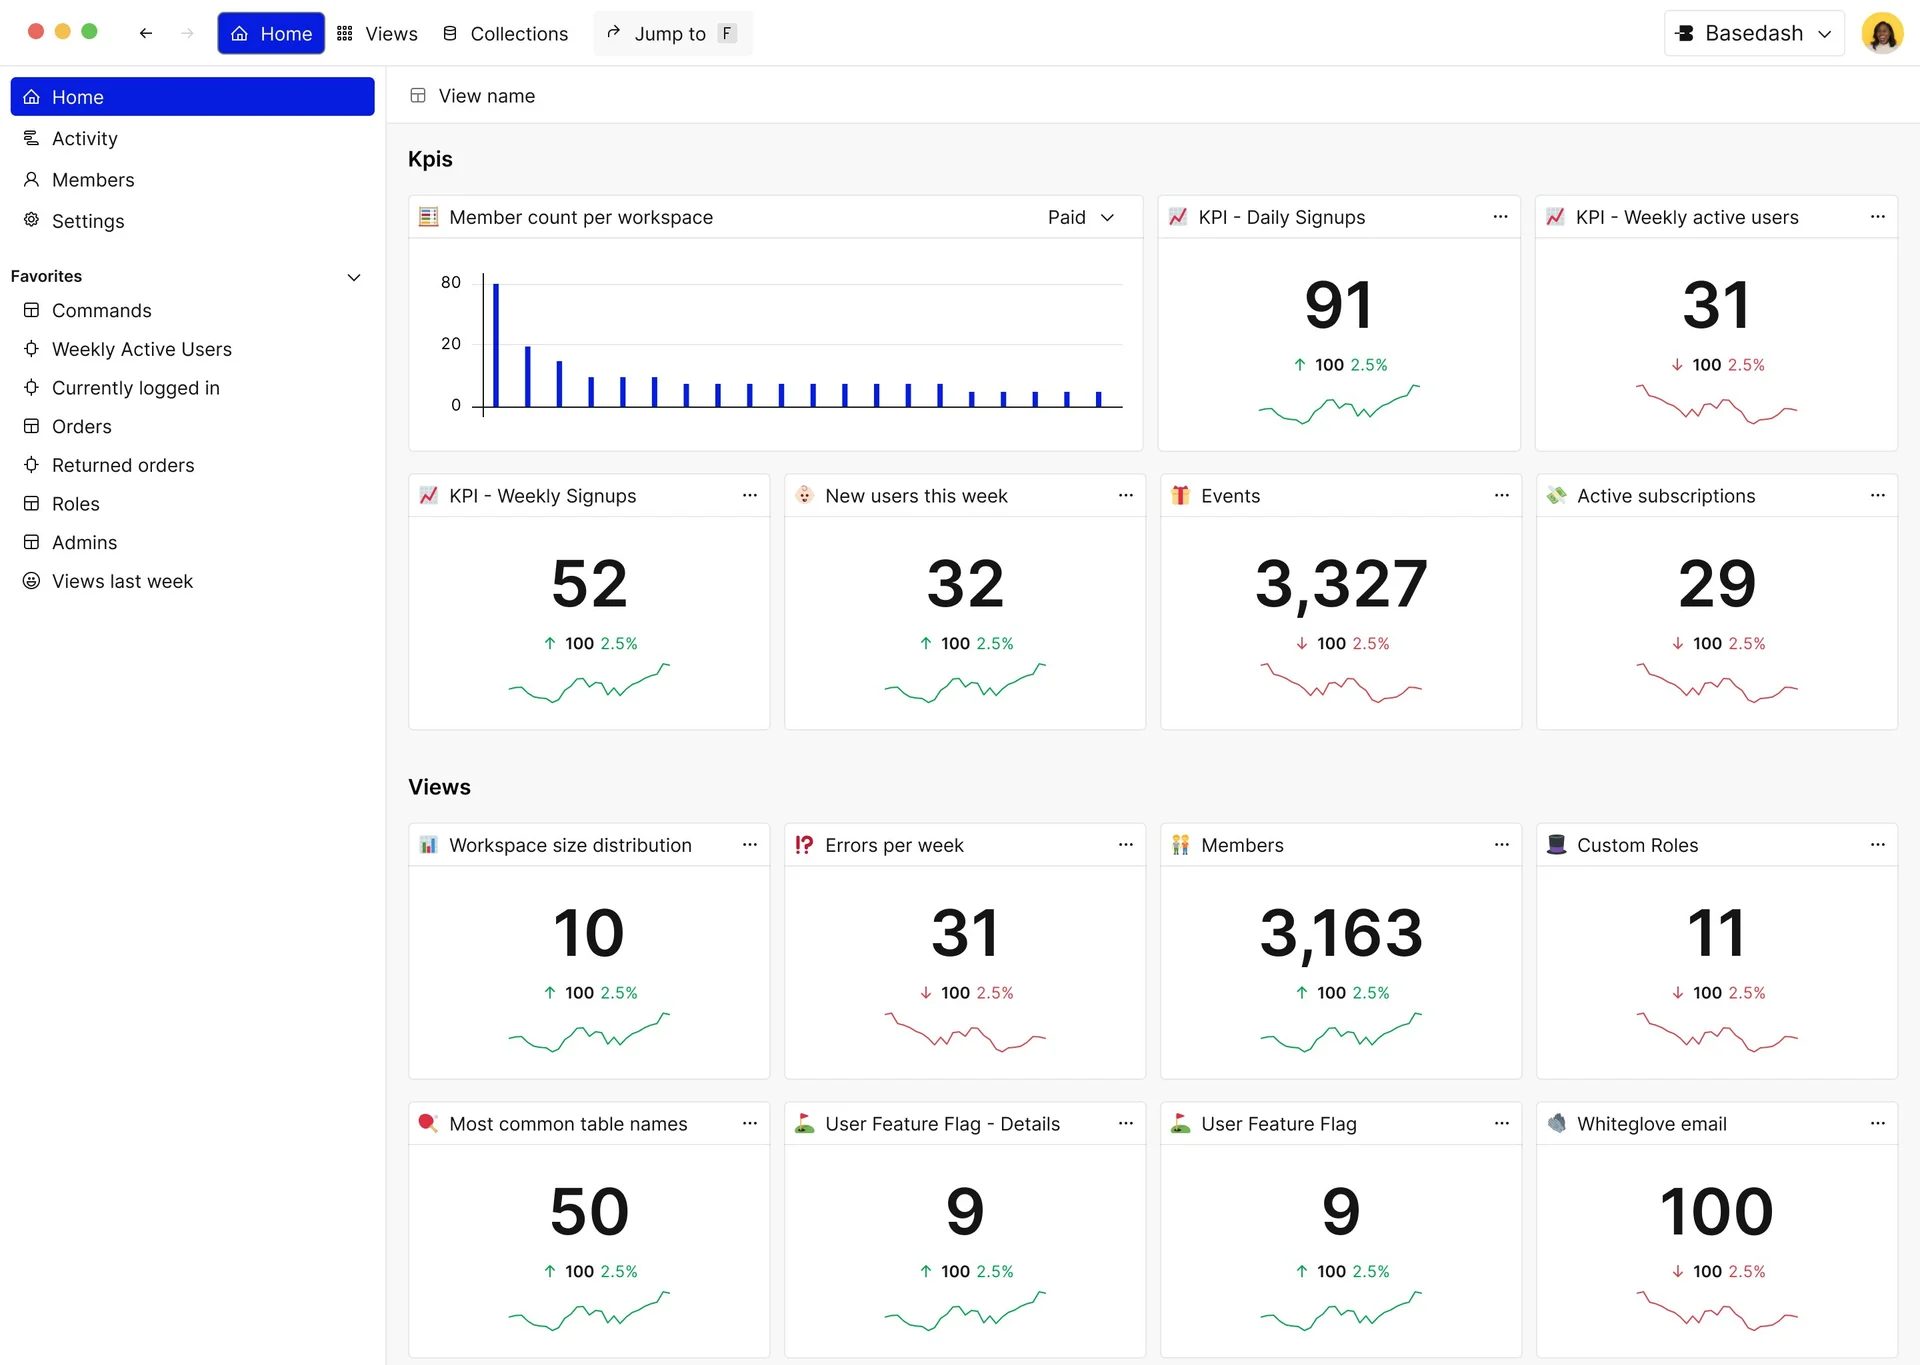
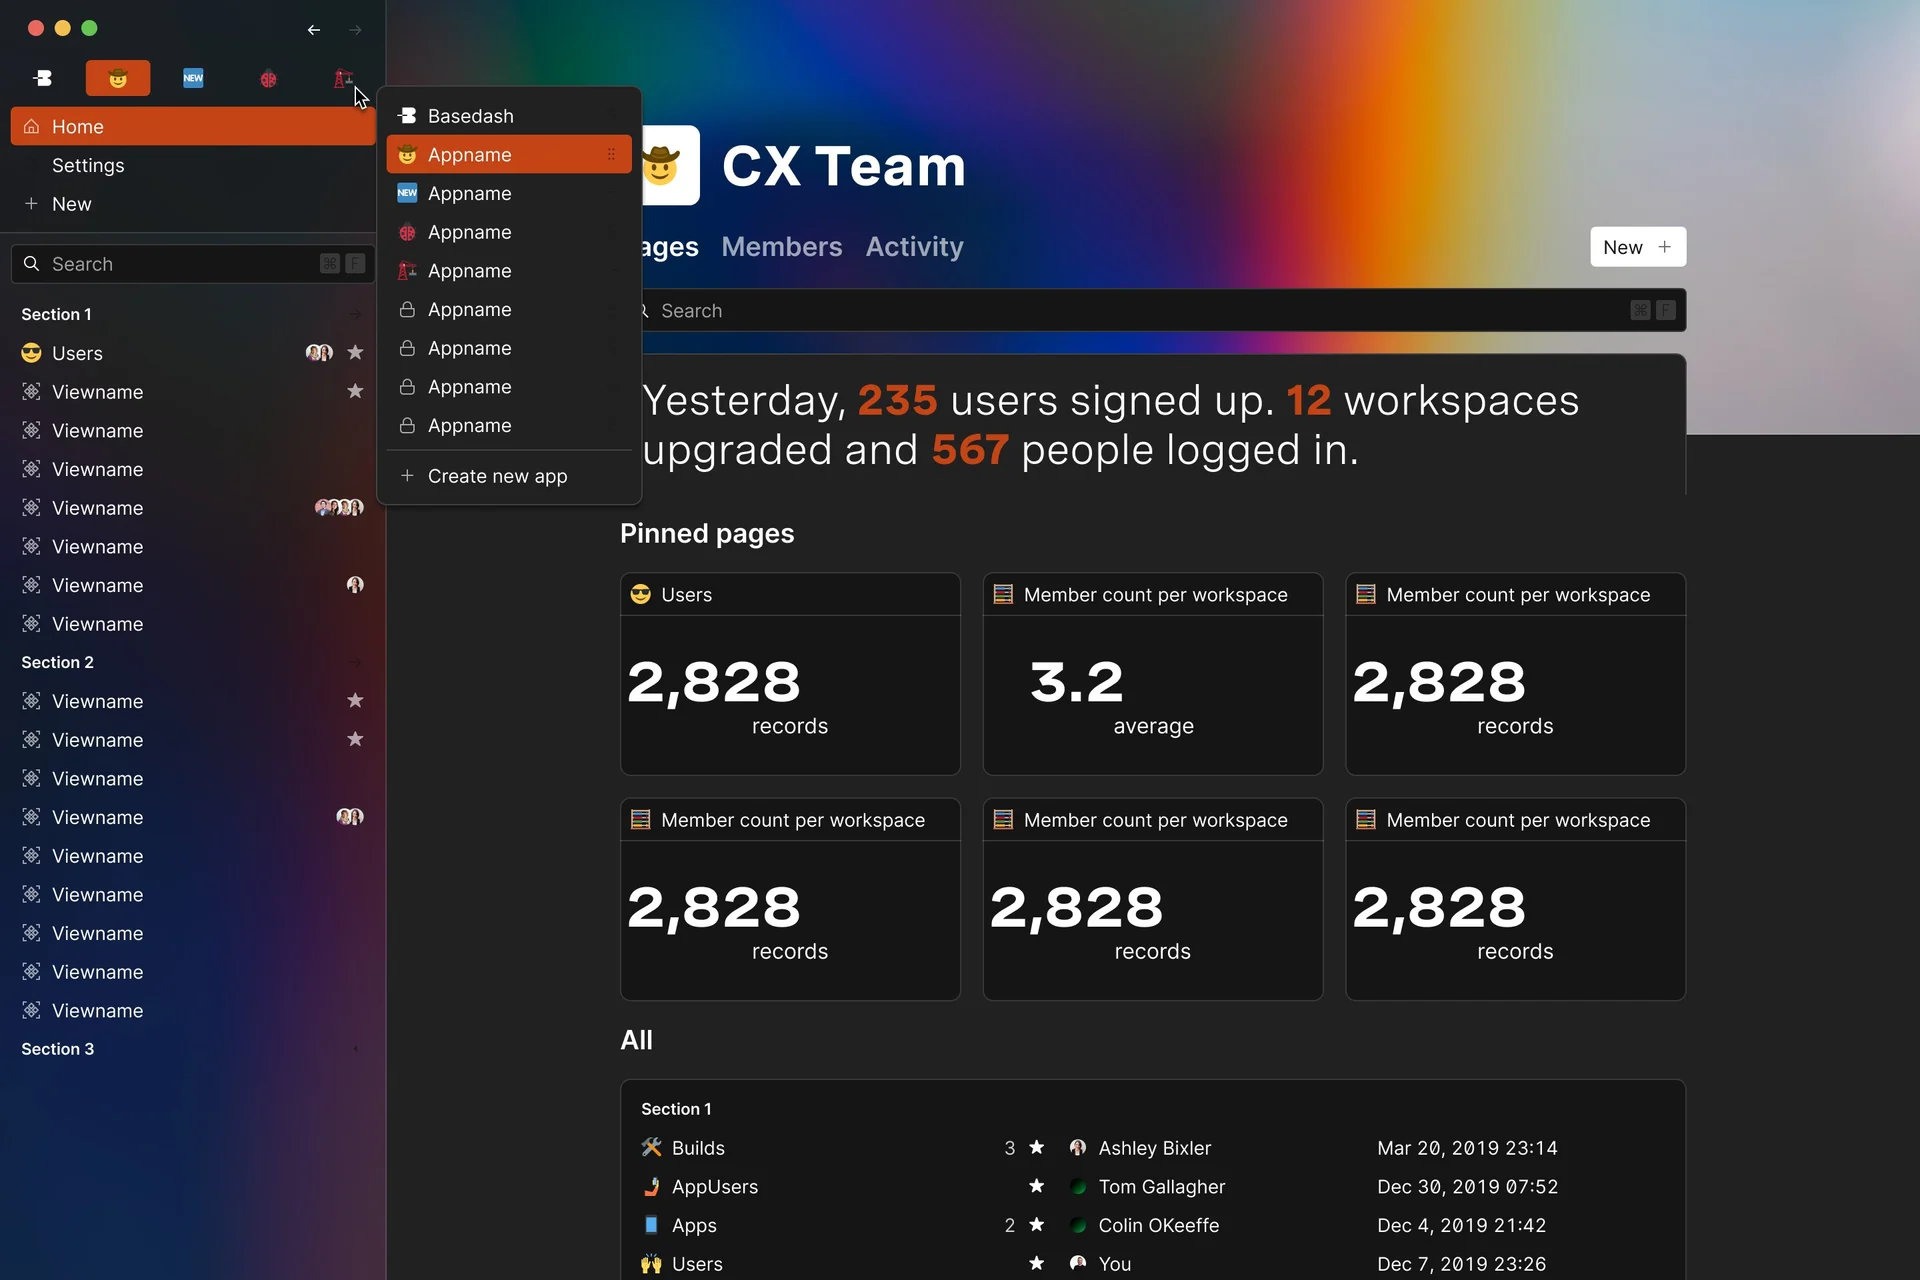
Check out this homepage exploration:
I was a big fan of cover photos at the time. You would be too if you stared at database tables for a year and a half.
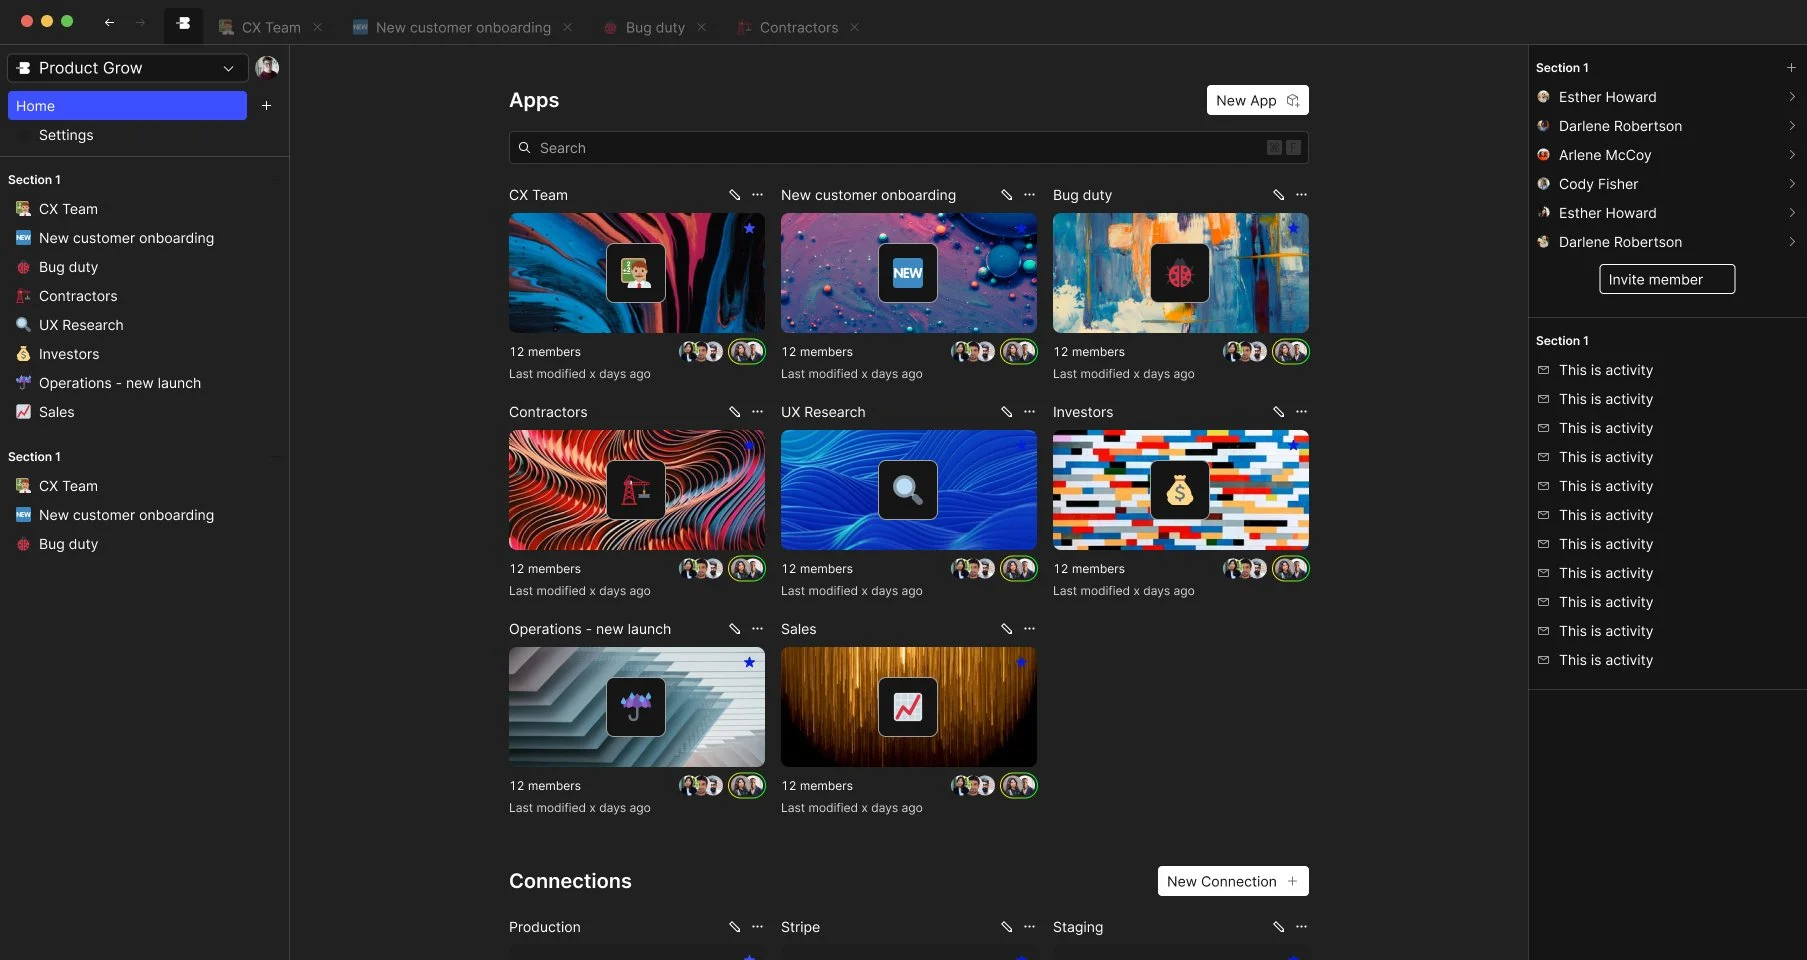
Ooh, some dark mode stuff too. I think this is when Figma started adding color modes.
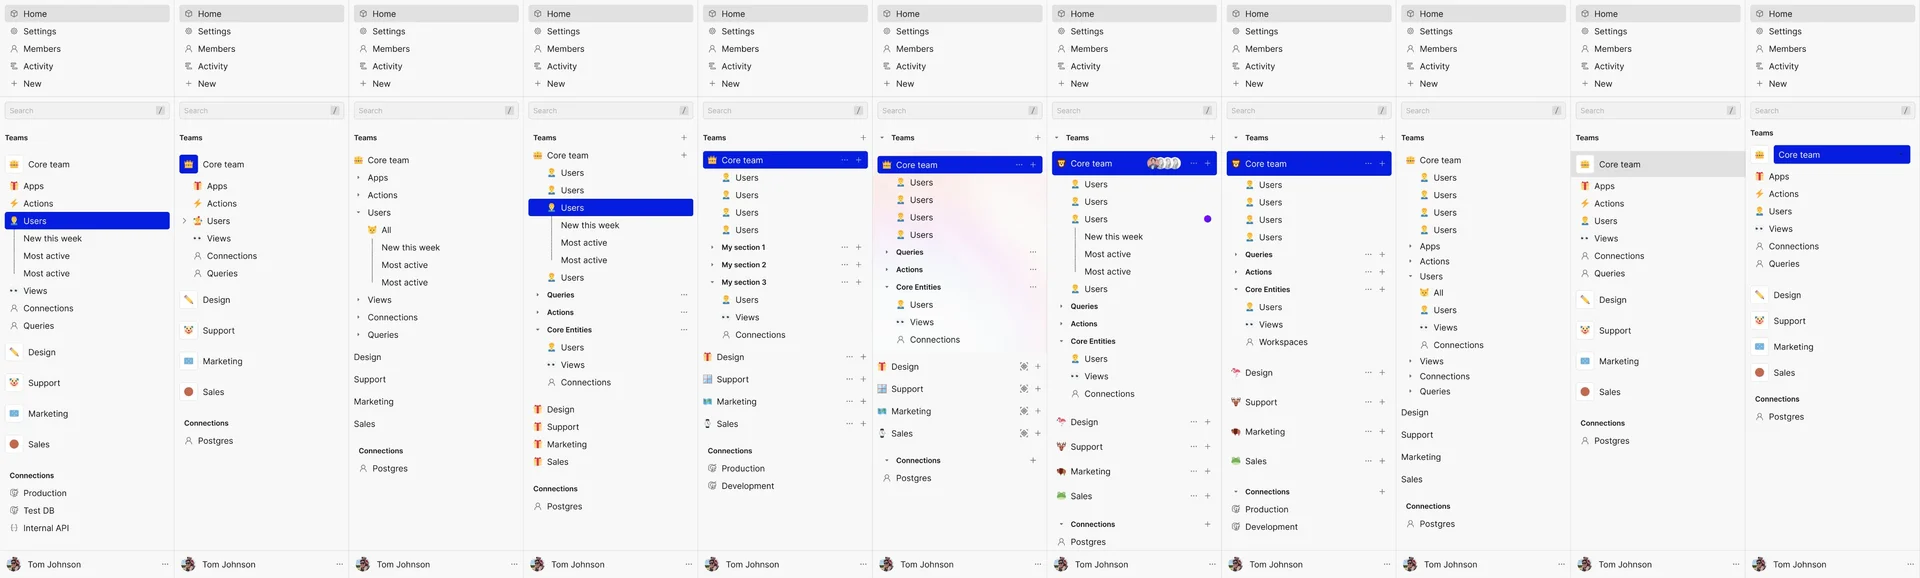
Check out all this sidebar action. I think this was right before Notion introduced teamspaces, or maybe right after... I remember seeing notion's, teamspaces and knowing I had gone down a similar rabbit hole.
But I don't remember if I circled back or if I saw it and knew why they did it. Either way, it still makes sense.
Loading states, an early assistant, and filters
Oh yeah, check out this frame-by-frame loading animation. This took forever. Thank goodness for shaders.
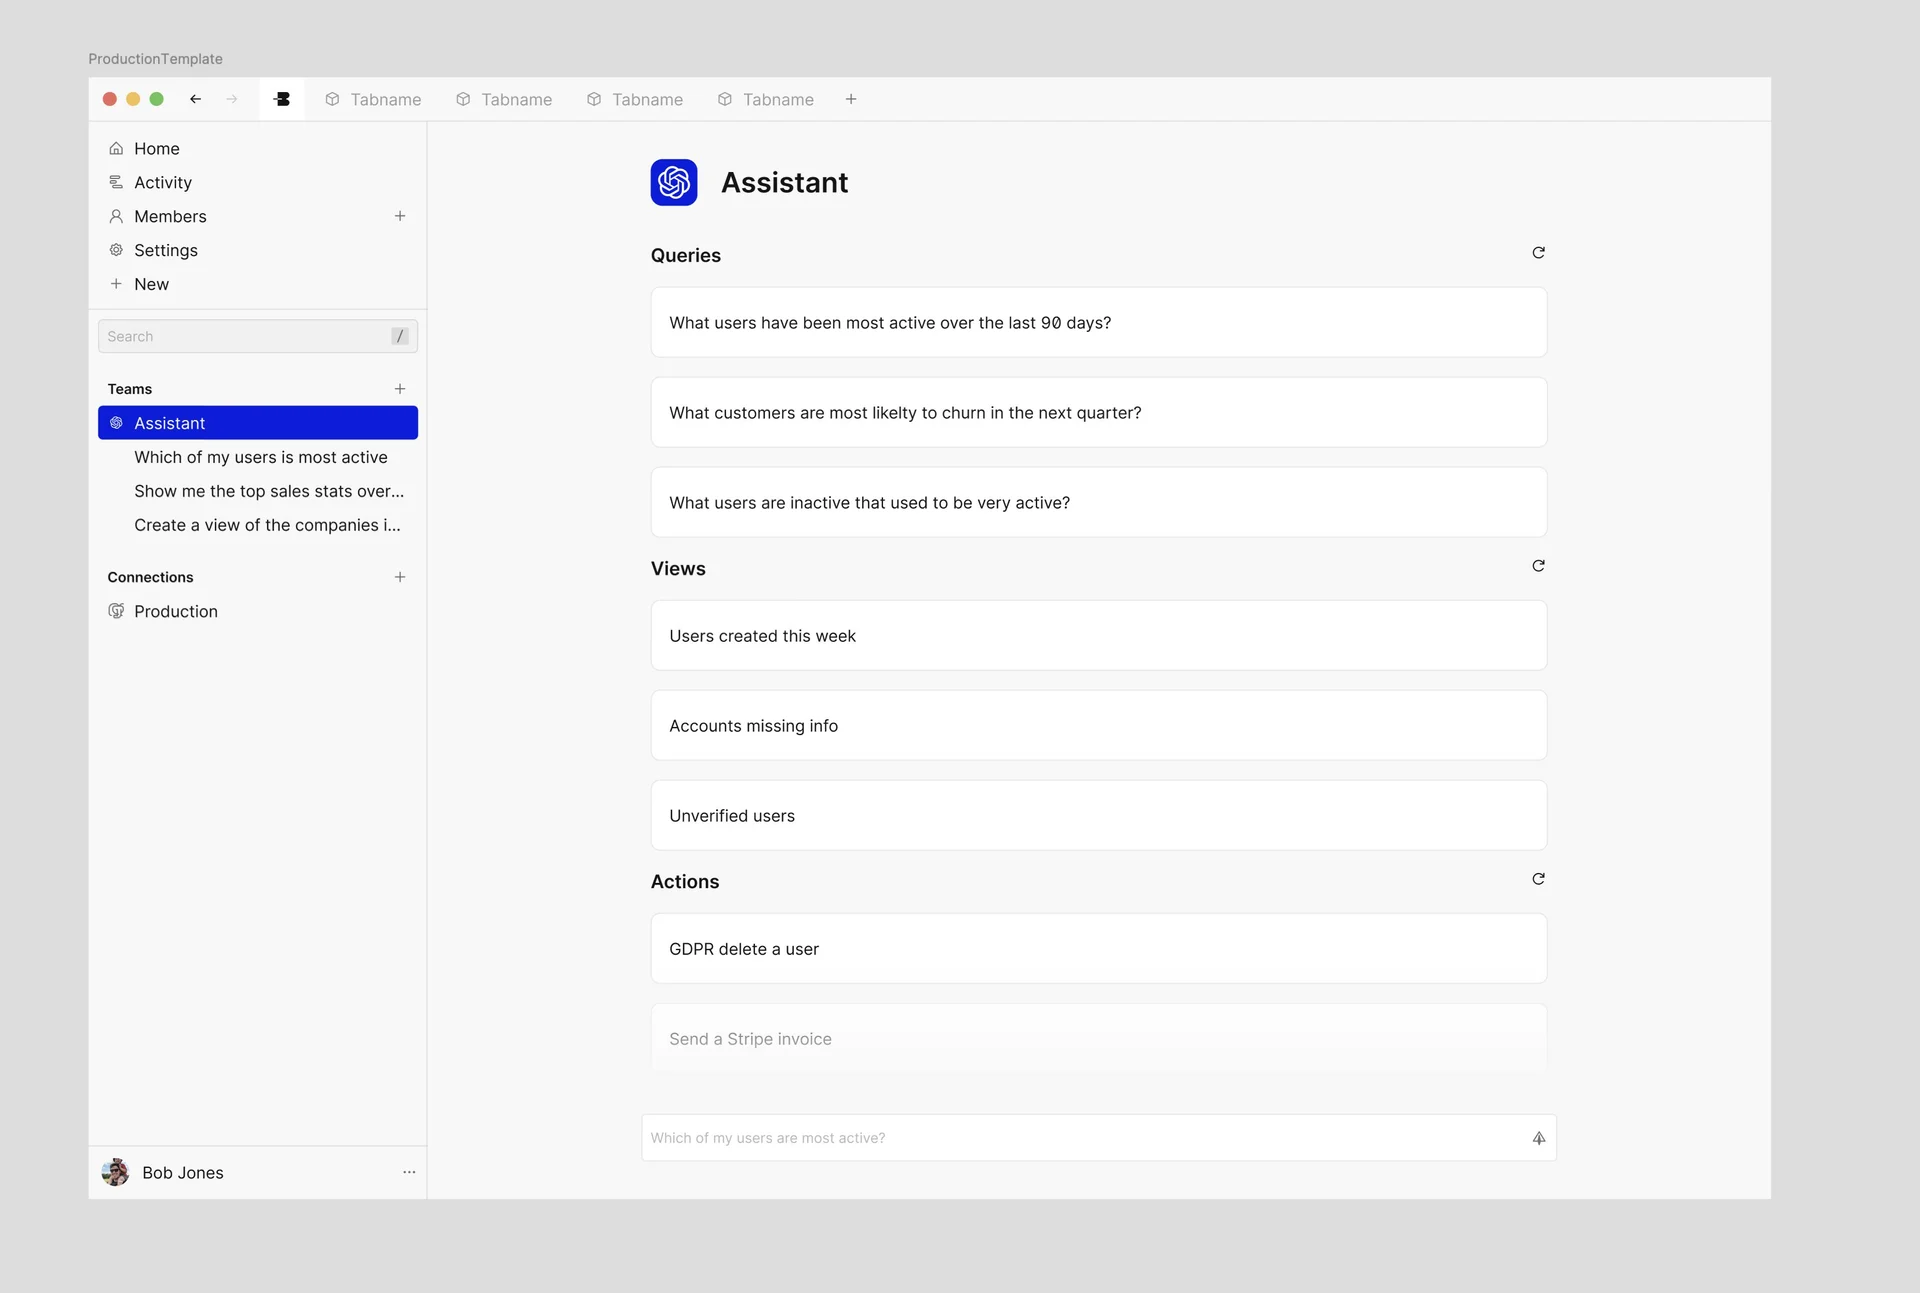
Yooo this page is called "ChatGPT Assistant". It looks like the timestamp for this work is December of 2022, so a week after ChatGPT came out.... not bad.
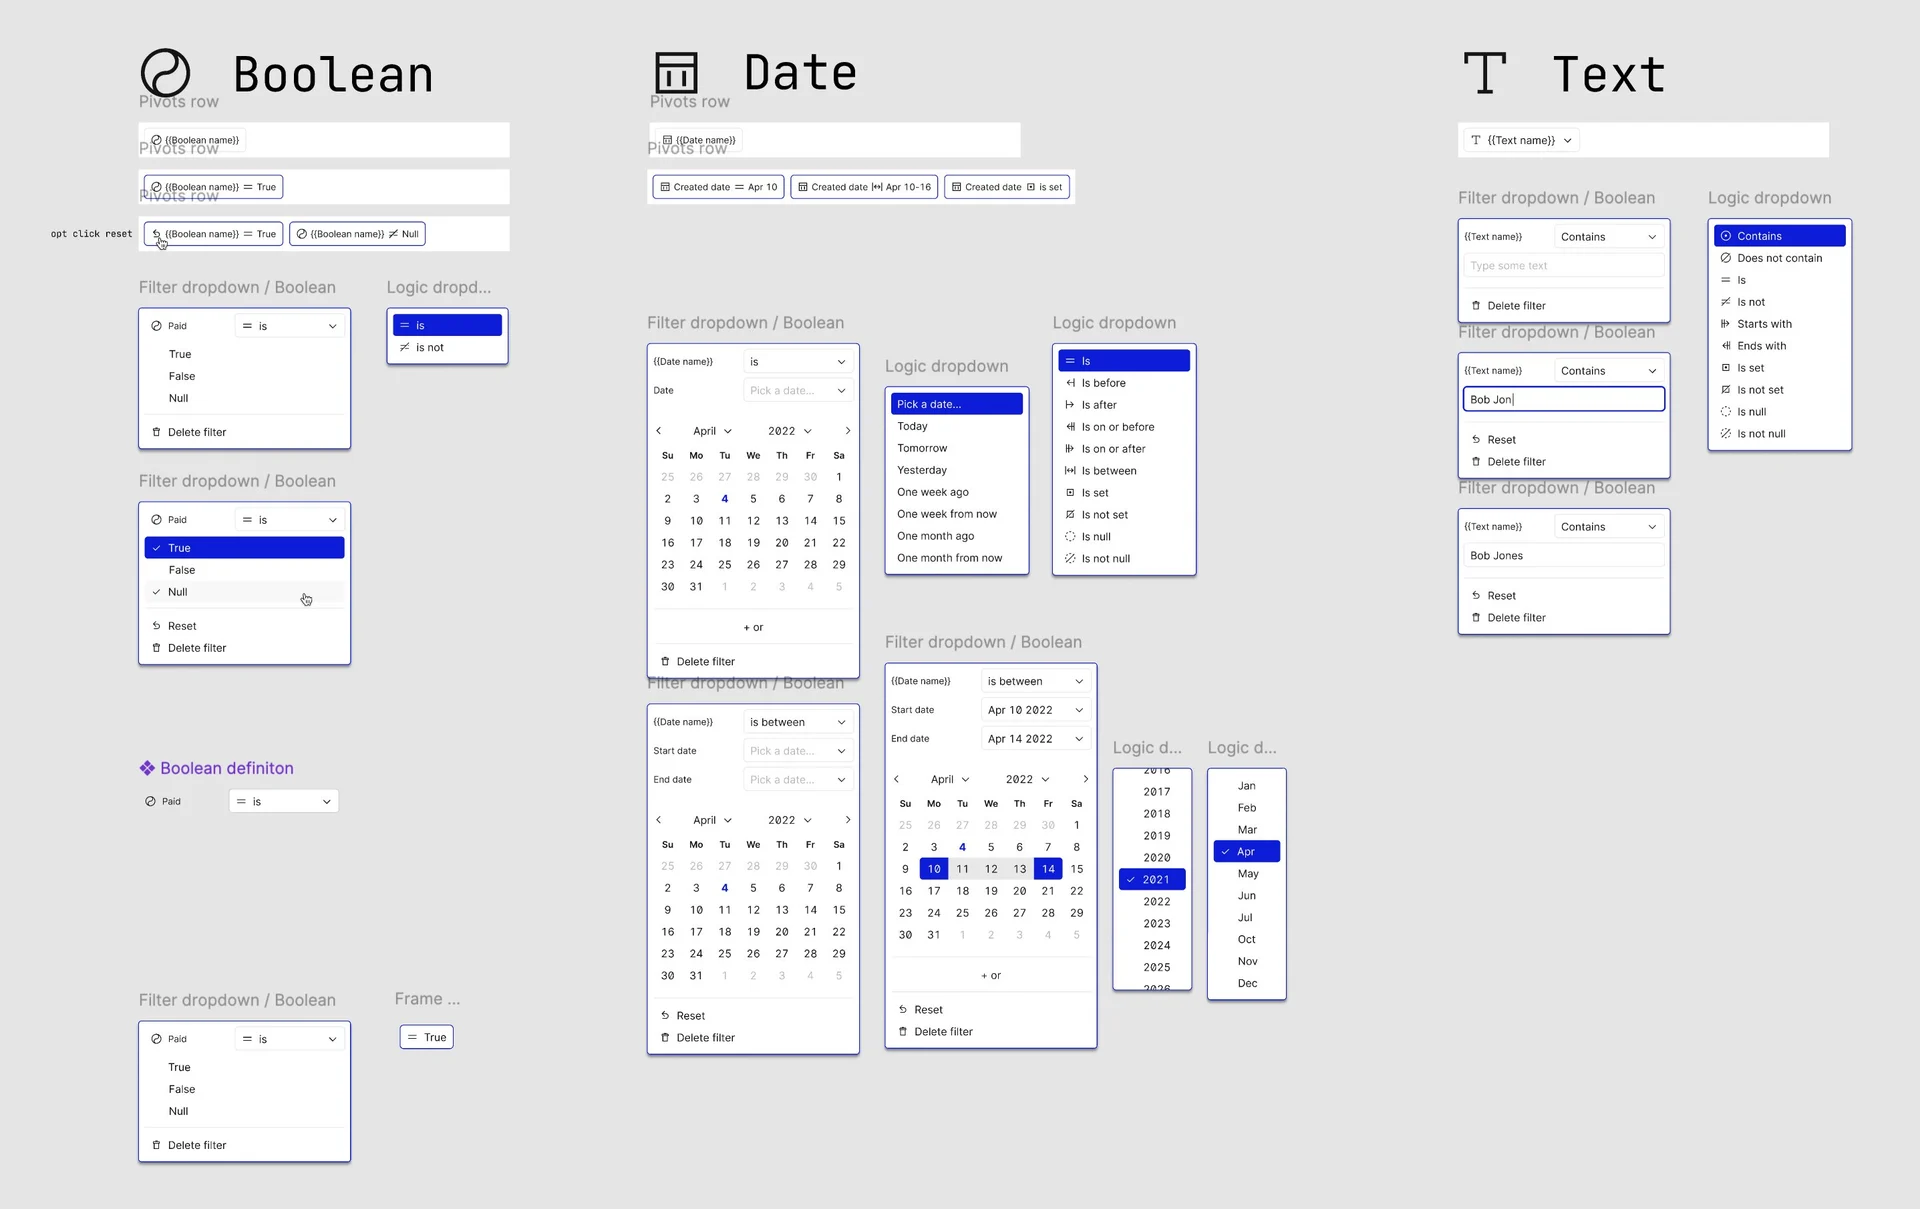
Filters are hard. Man, I have spent a lot of time designing filters. These ones never made the cut.
Related records, maps, and chart exploration
Okay, look at this terribly overcomplicated idea. This is on the workspace where I'm trying to explore how to dig into related data. So for example, users to organizations to Stripe payments, etc., foreign keys.
One of the biggest navigation issues with that type of data layer is that the flow is infinite. Everything could be related to everything. You could be going in a loop.
If I click on things and then those are related to other things, you just keep going on and on and on and on and on.
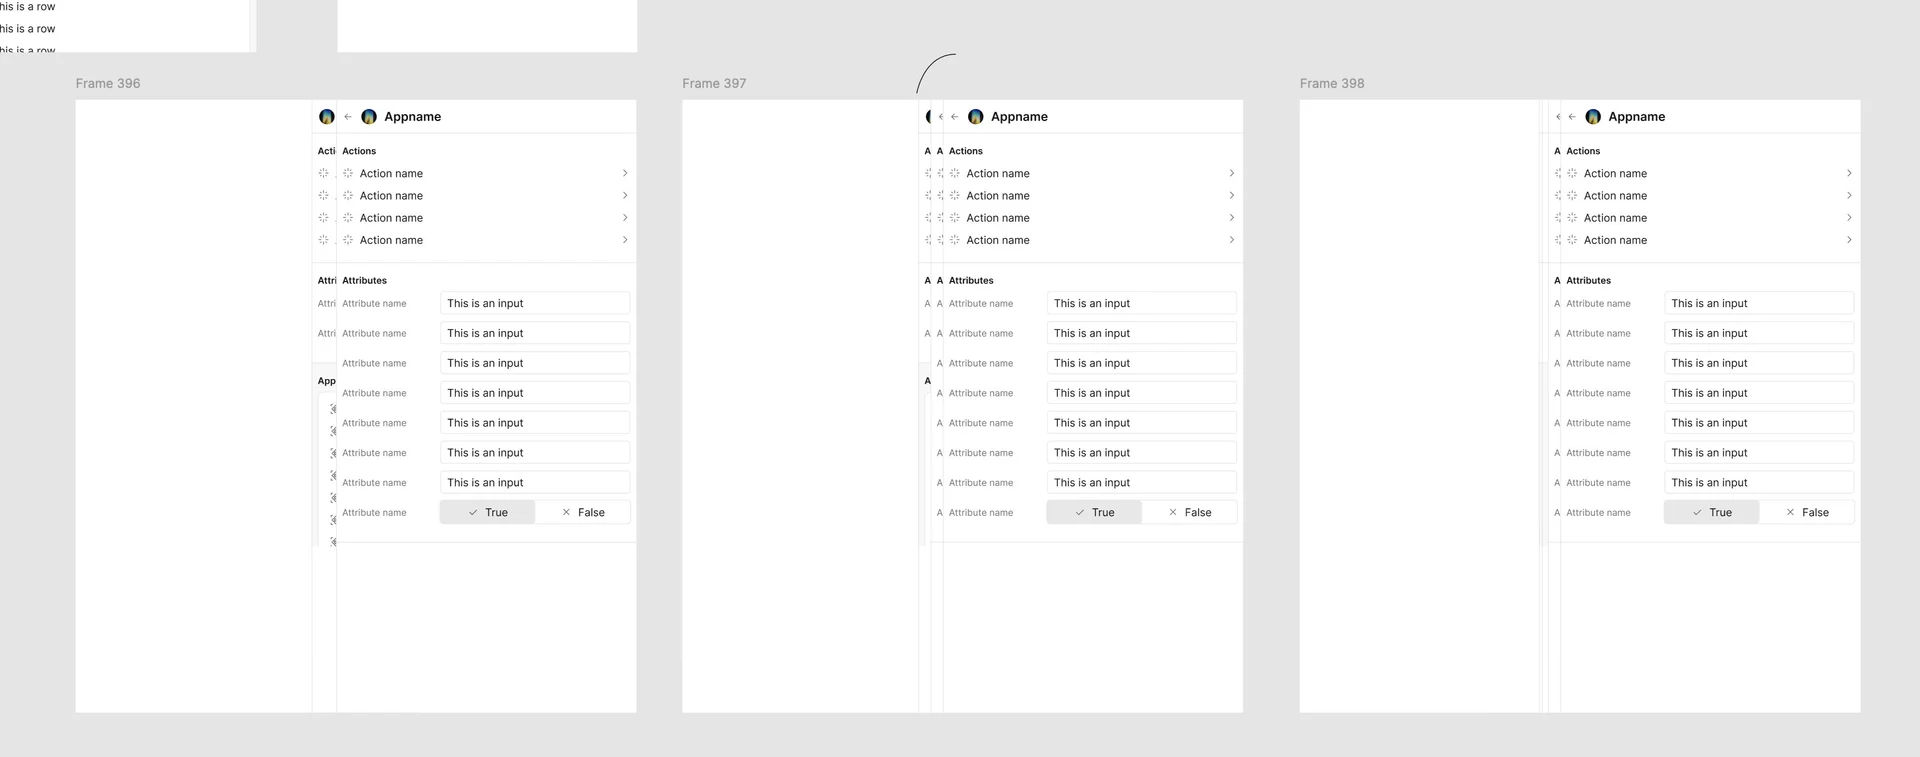
So the idea I had was we would load a new sidebar over the top of the current one if you were to click on a relation. And then if you loaded more, they would gradually stack on top of each other, but they would stack on a curve and then fade out the deeper you go.
See that little line above the middle one? That's my visual describing the x-axis offset curve that we would need to do to make this work. I don't remember which developer worked on this, but I'm sure they thought I was crazy.
And yes, I was crazy. There is no reason to do this. Way over complicated it.
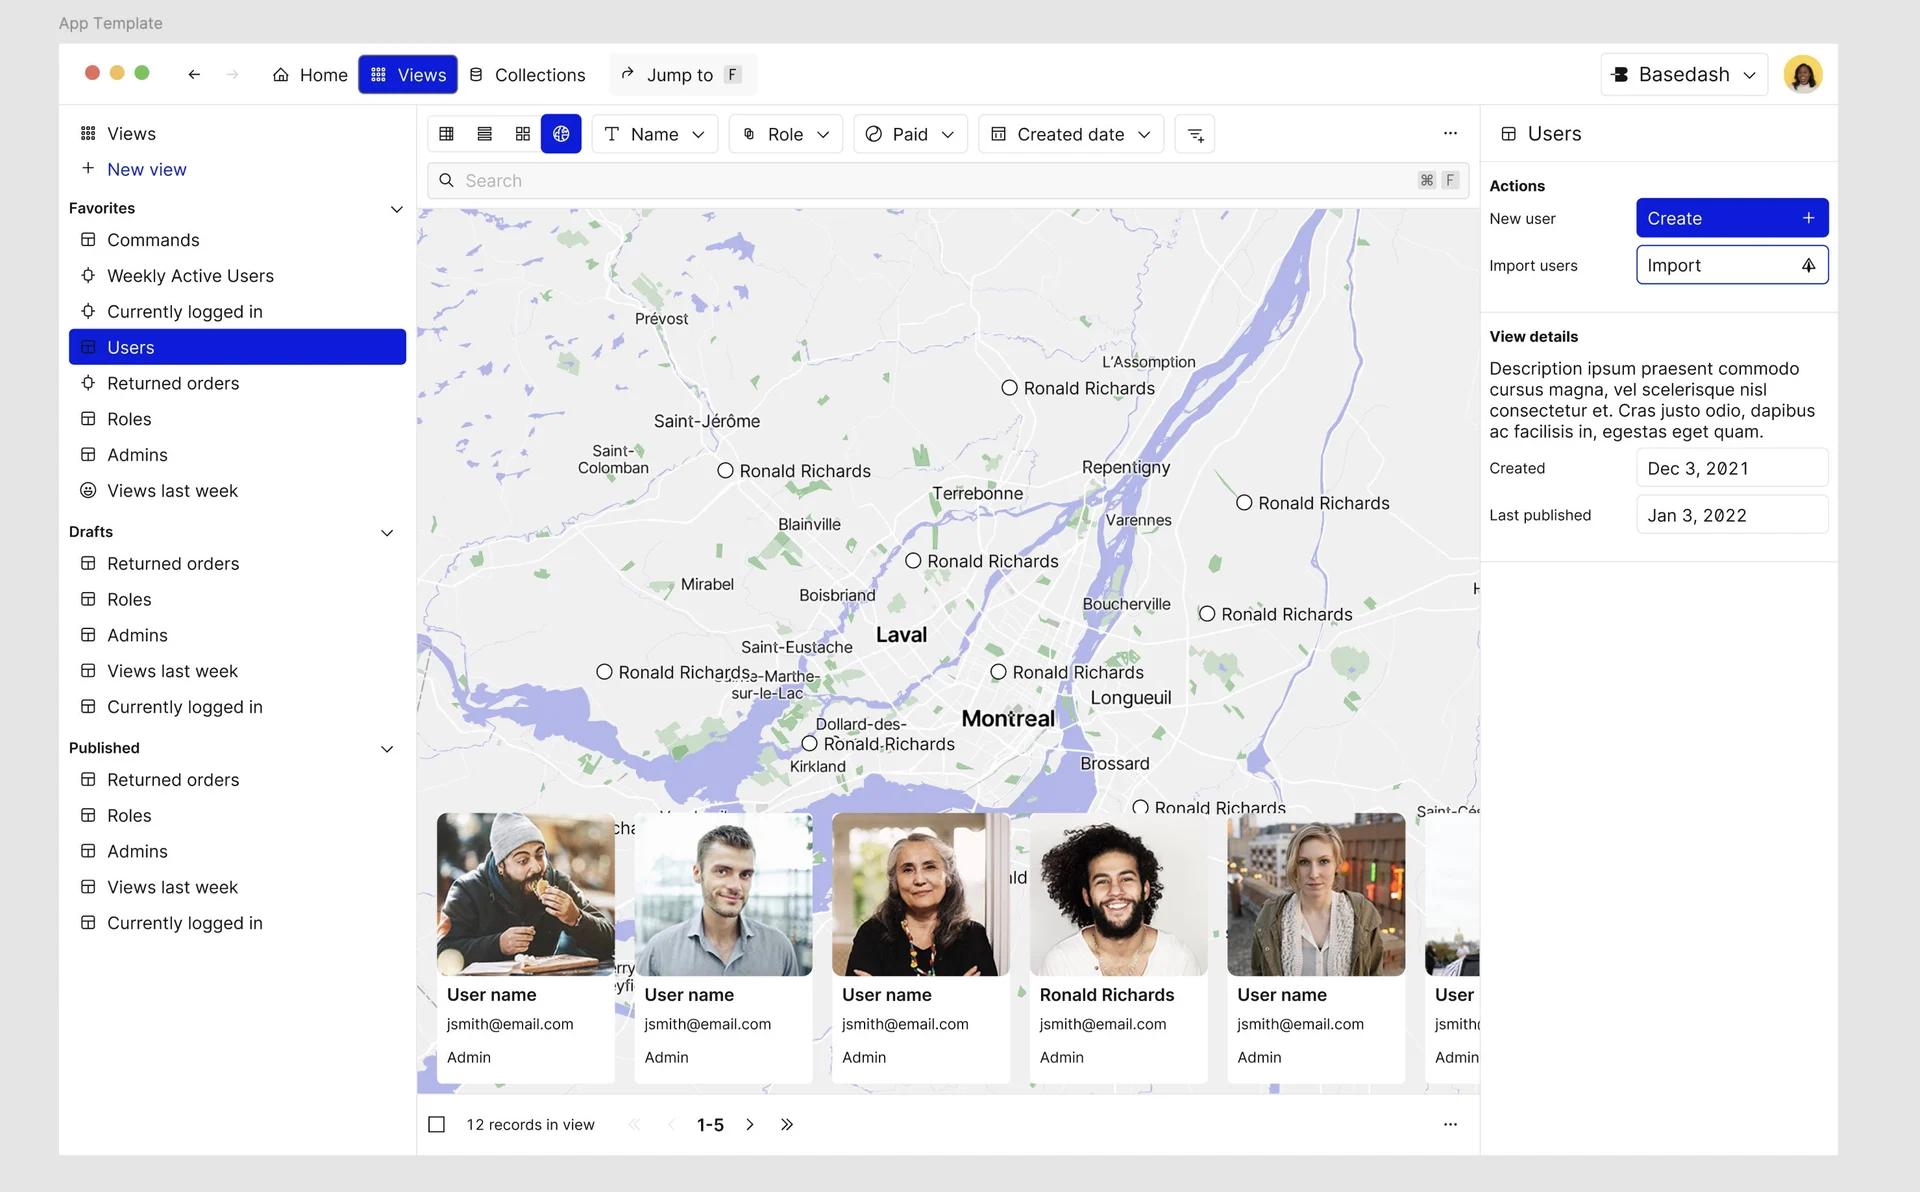
Gahh! Map view! How I so desperately still want to work on something with a map. Not a vector map, but like an actual interactive zoomable map.
My entire career, I have wanted to build something with a map in it that would allow me to design and choose how things are represented with vector points, distances, isochrones, heat maps, densities, all of the nuances of that data visualization.
I pushed for it for two years at Asurion, and they implemented it after I left. I've been dreaming of it at Basedash for a long time, but it's always been out of my grasp. Someday.
More dashboard exploration. A sign of things to come.
Also, people don't talk about this, but making good-looking charts in @Figma is extremely difficult. Can someone solve this? Because none of the plugins are any good, and they don't work well with components. Maybe slots make this better, but I haven't had a chance to test slots yet. Much easier to use @Framer for that type of workflow, to be honest.
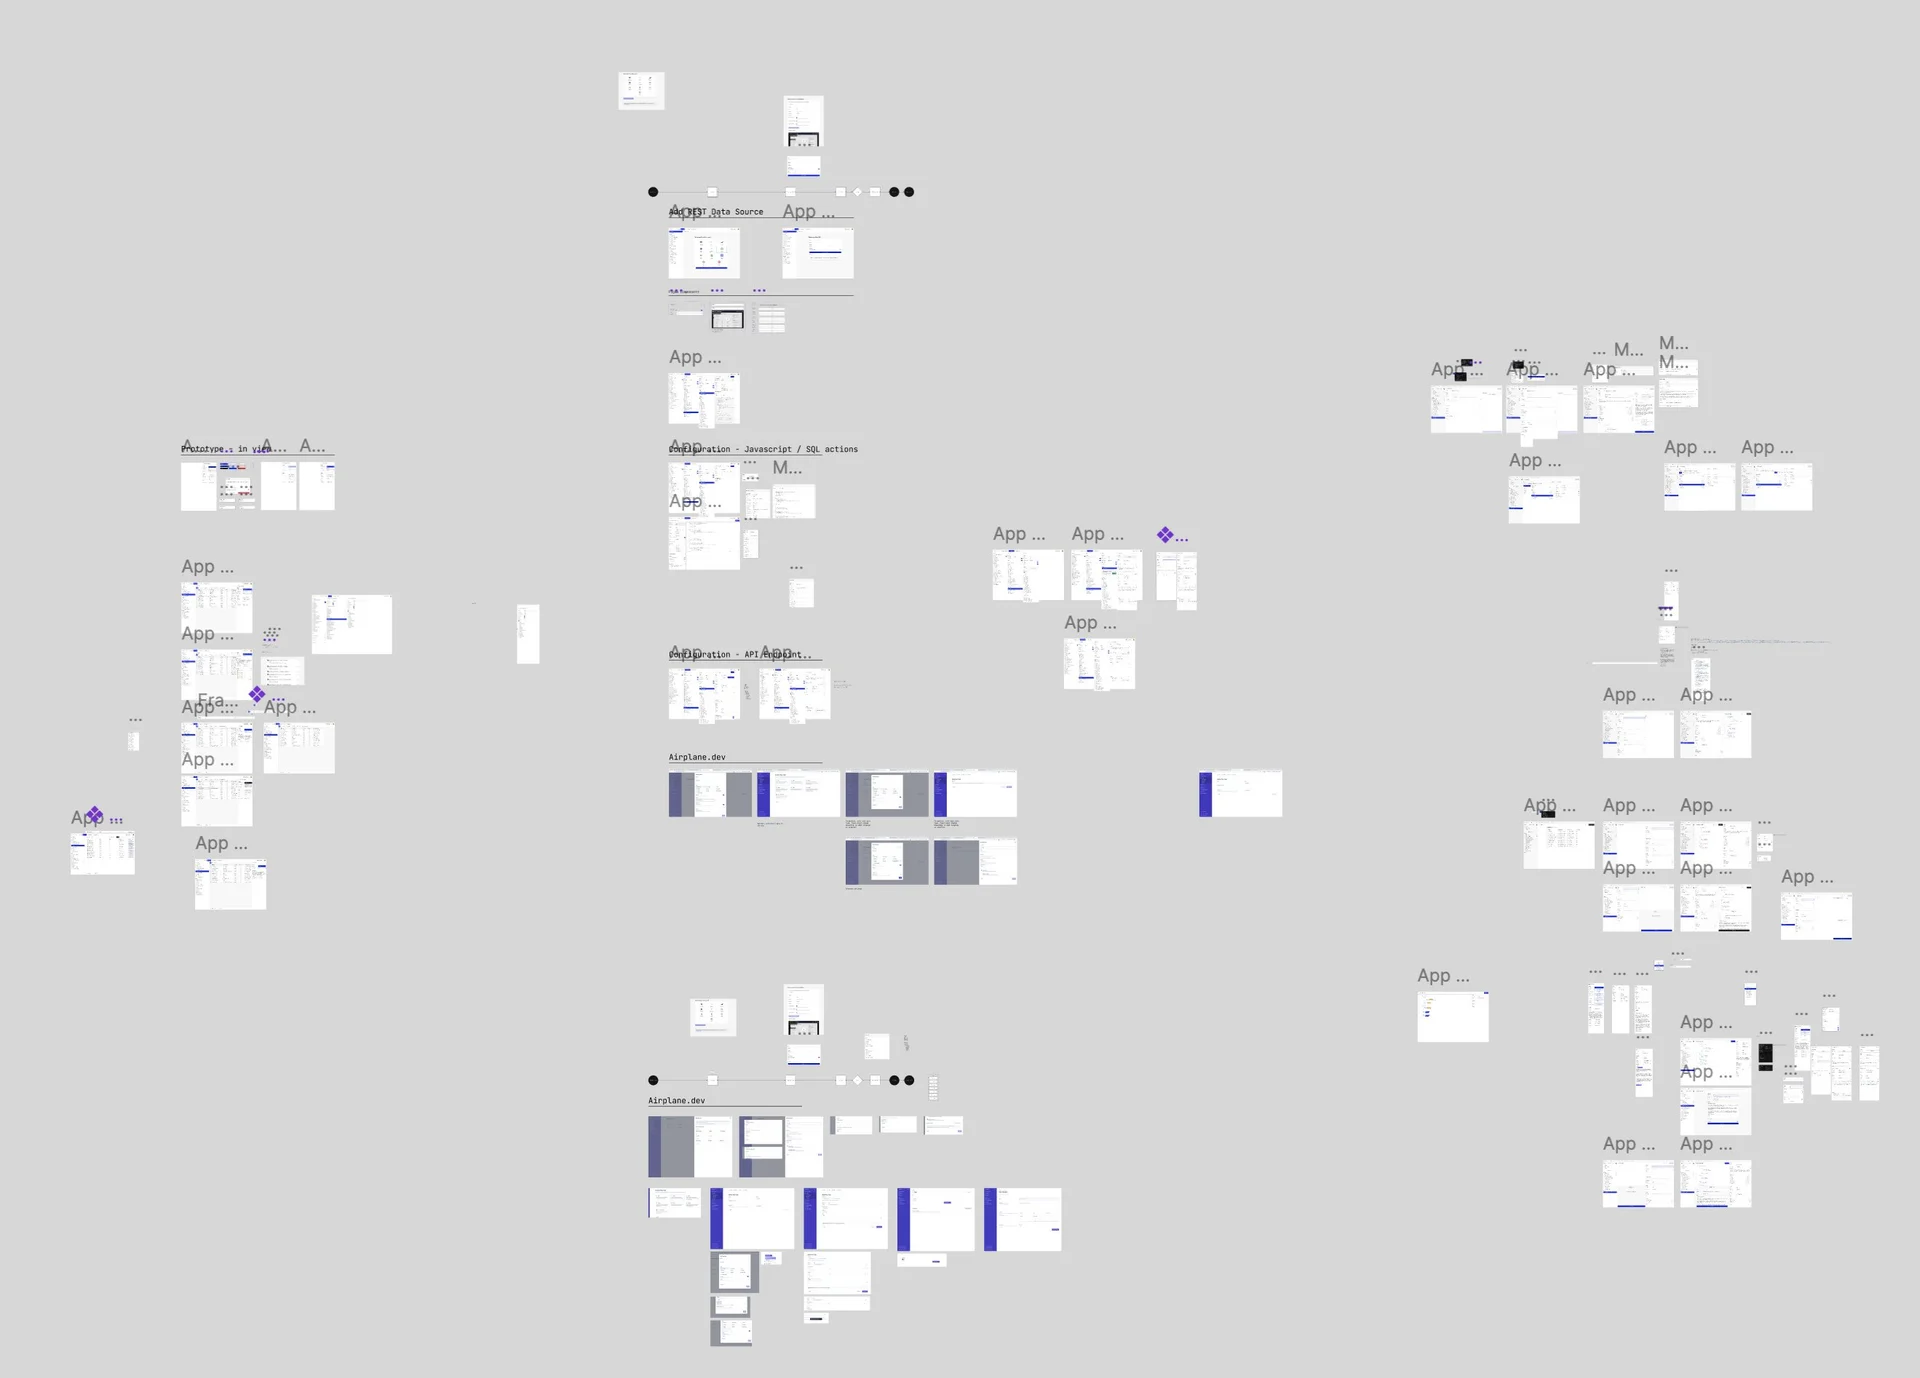
Powerful actions, difficult setup
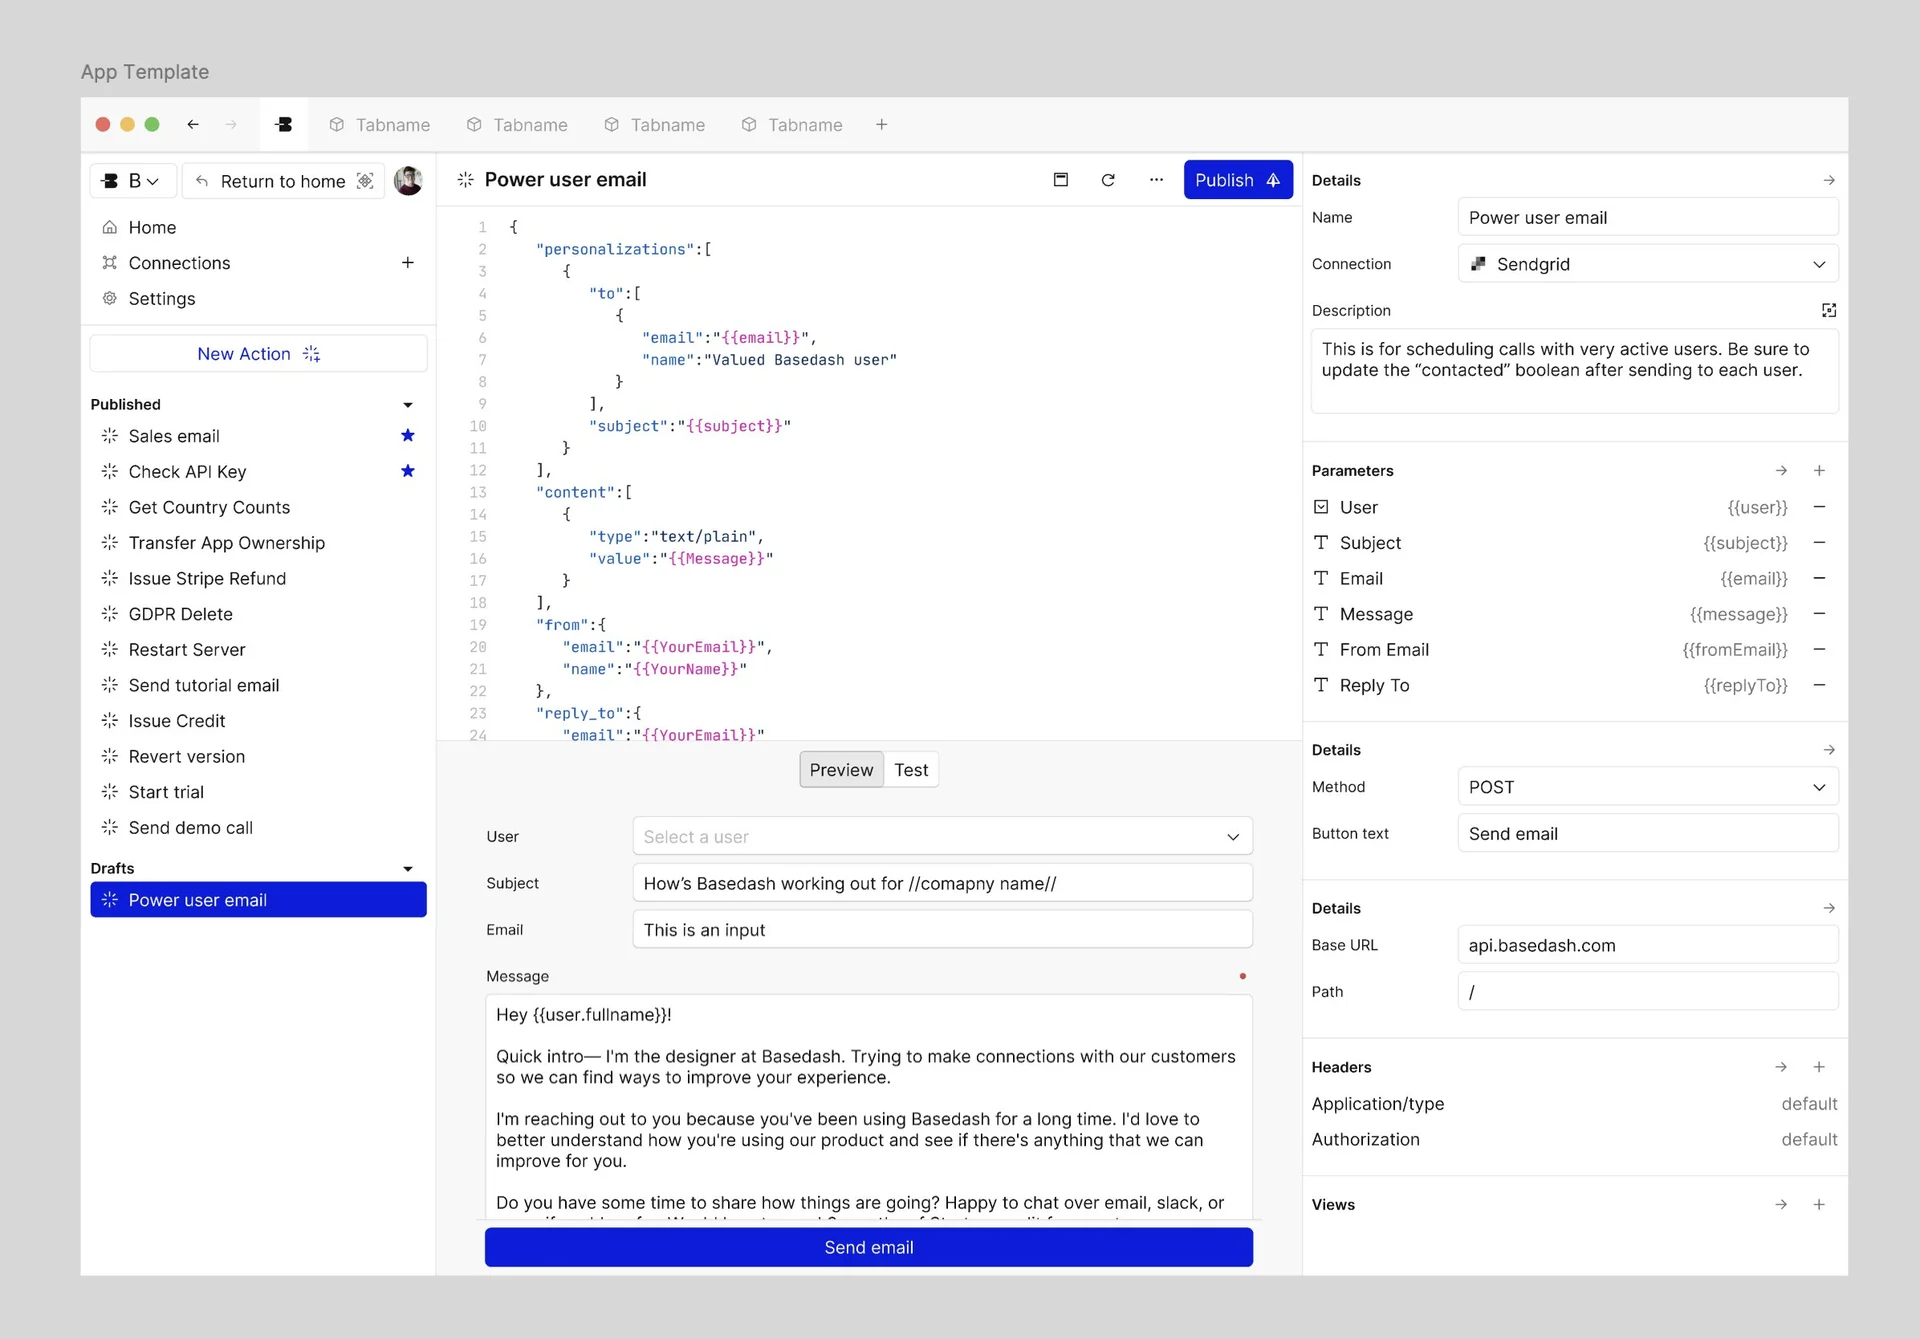
This was one of the directions I liked least in hindsight. The misaligned text in the screenshot comes from a missing font; it would originally have been centered.
Actions were one of the more difficult features I ever worked on. They were basically Postman, but inside of the product, but using variables from a selected record within the database.
The concept was pretty easy. You want to click on a record and do a thing, submit a refund, send an email, etc. But setting them up was extremely difficult, technically nuanced, complex, and I don't think we ever got this one quite right. It was a very powerful feature, but very complicated to use.
When we pivoted, I was glad to not have to worry about this one anymore. I still think http://airplane.dev had this one right. That was a great product. RIP.
Onboarding and the limits of prototypes
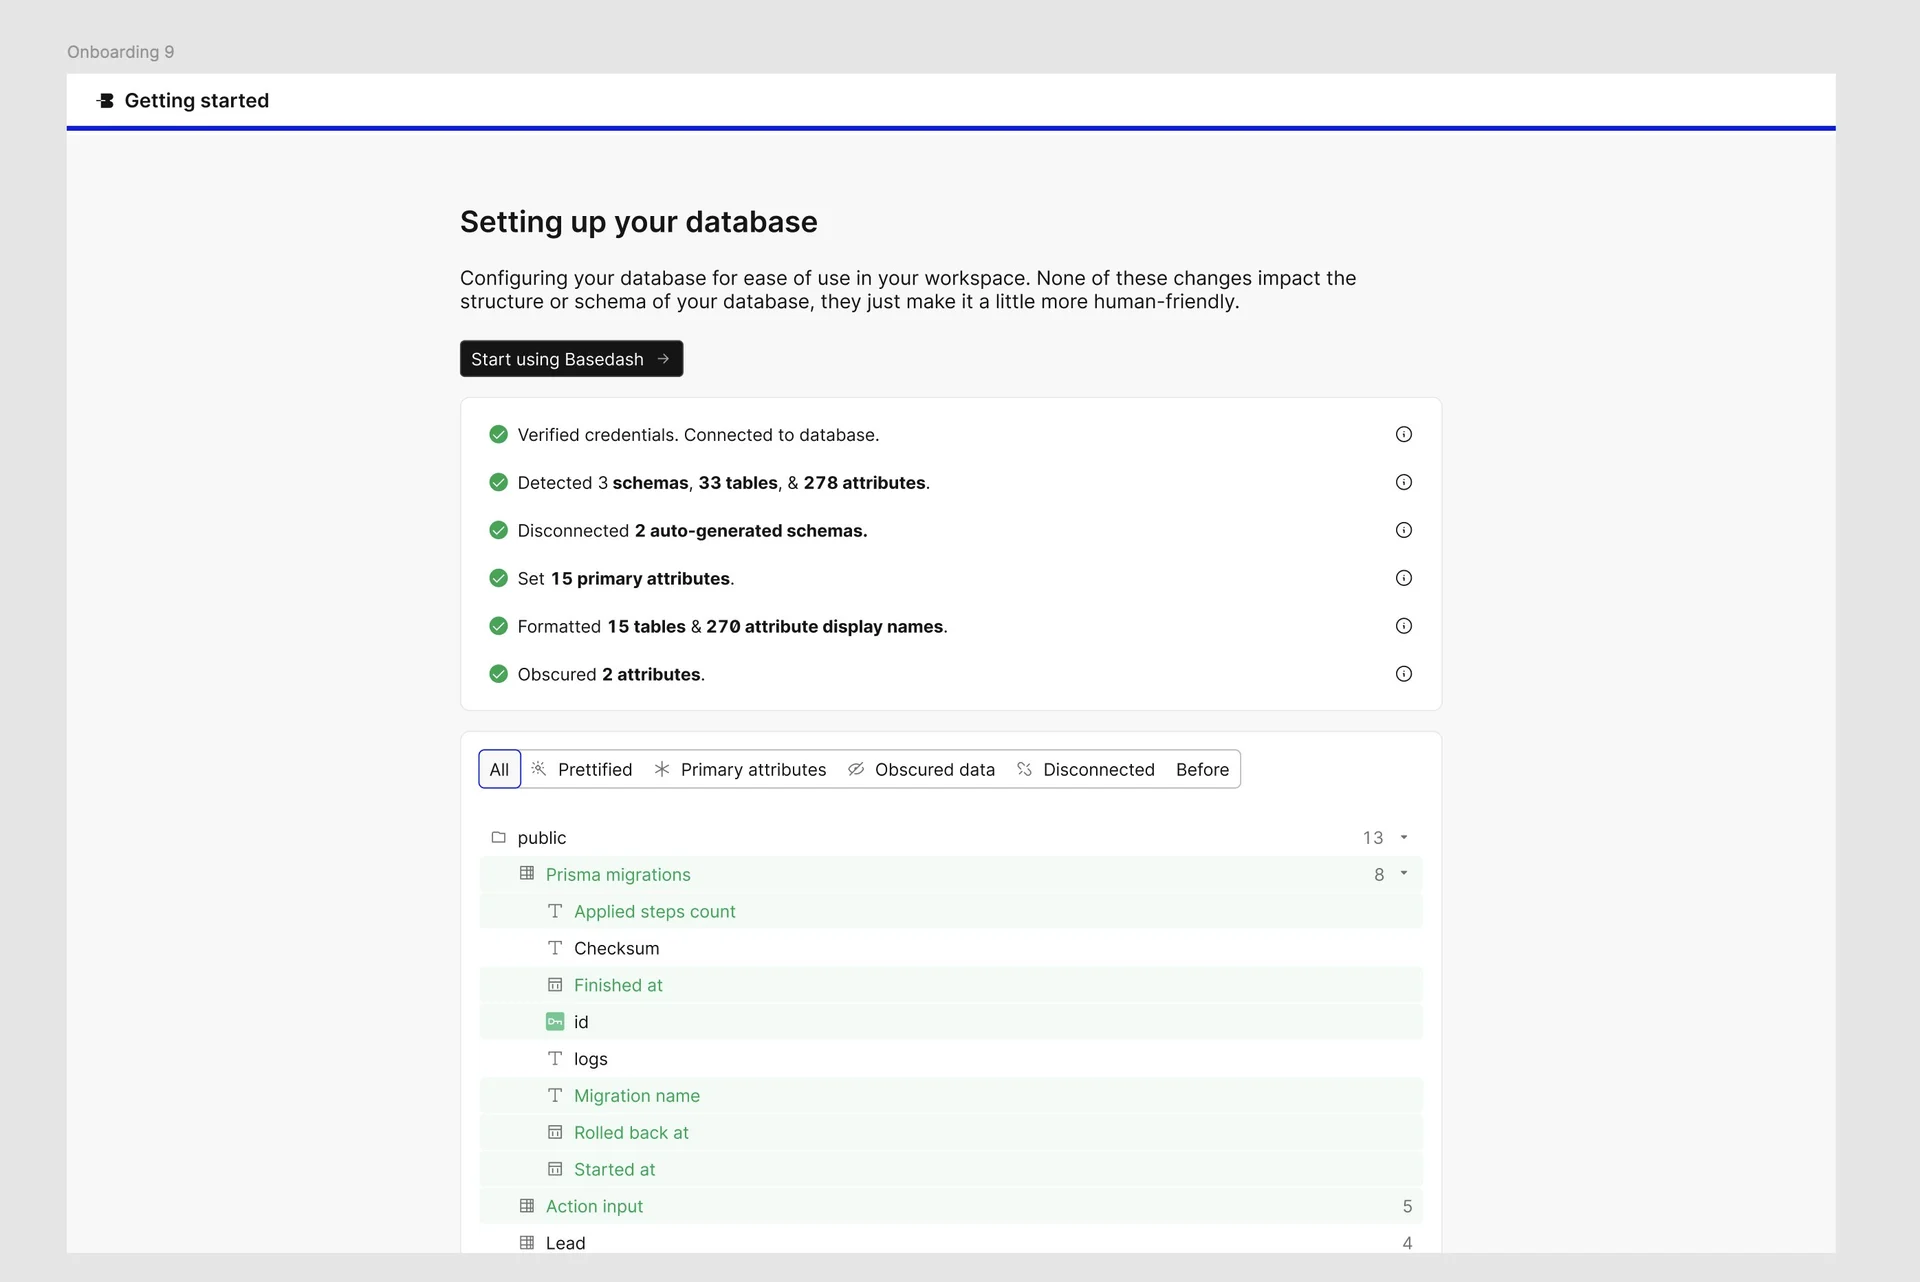
Oh, onboarding.
You're a constantly elusive, ever-present pain in my side.
You're nuanced, dynamic, frustrating, bloated, essential-- a mercurial enigma wrapped in a mystery.
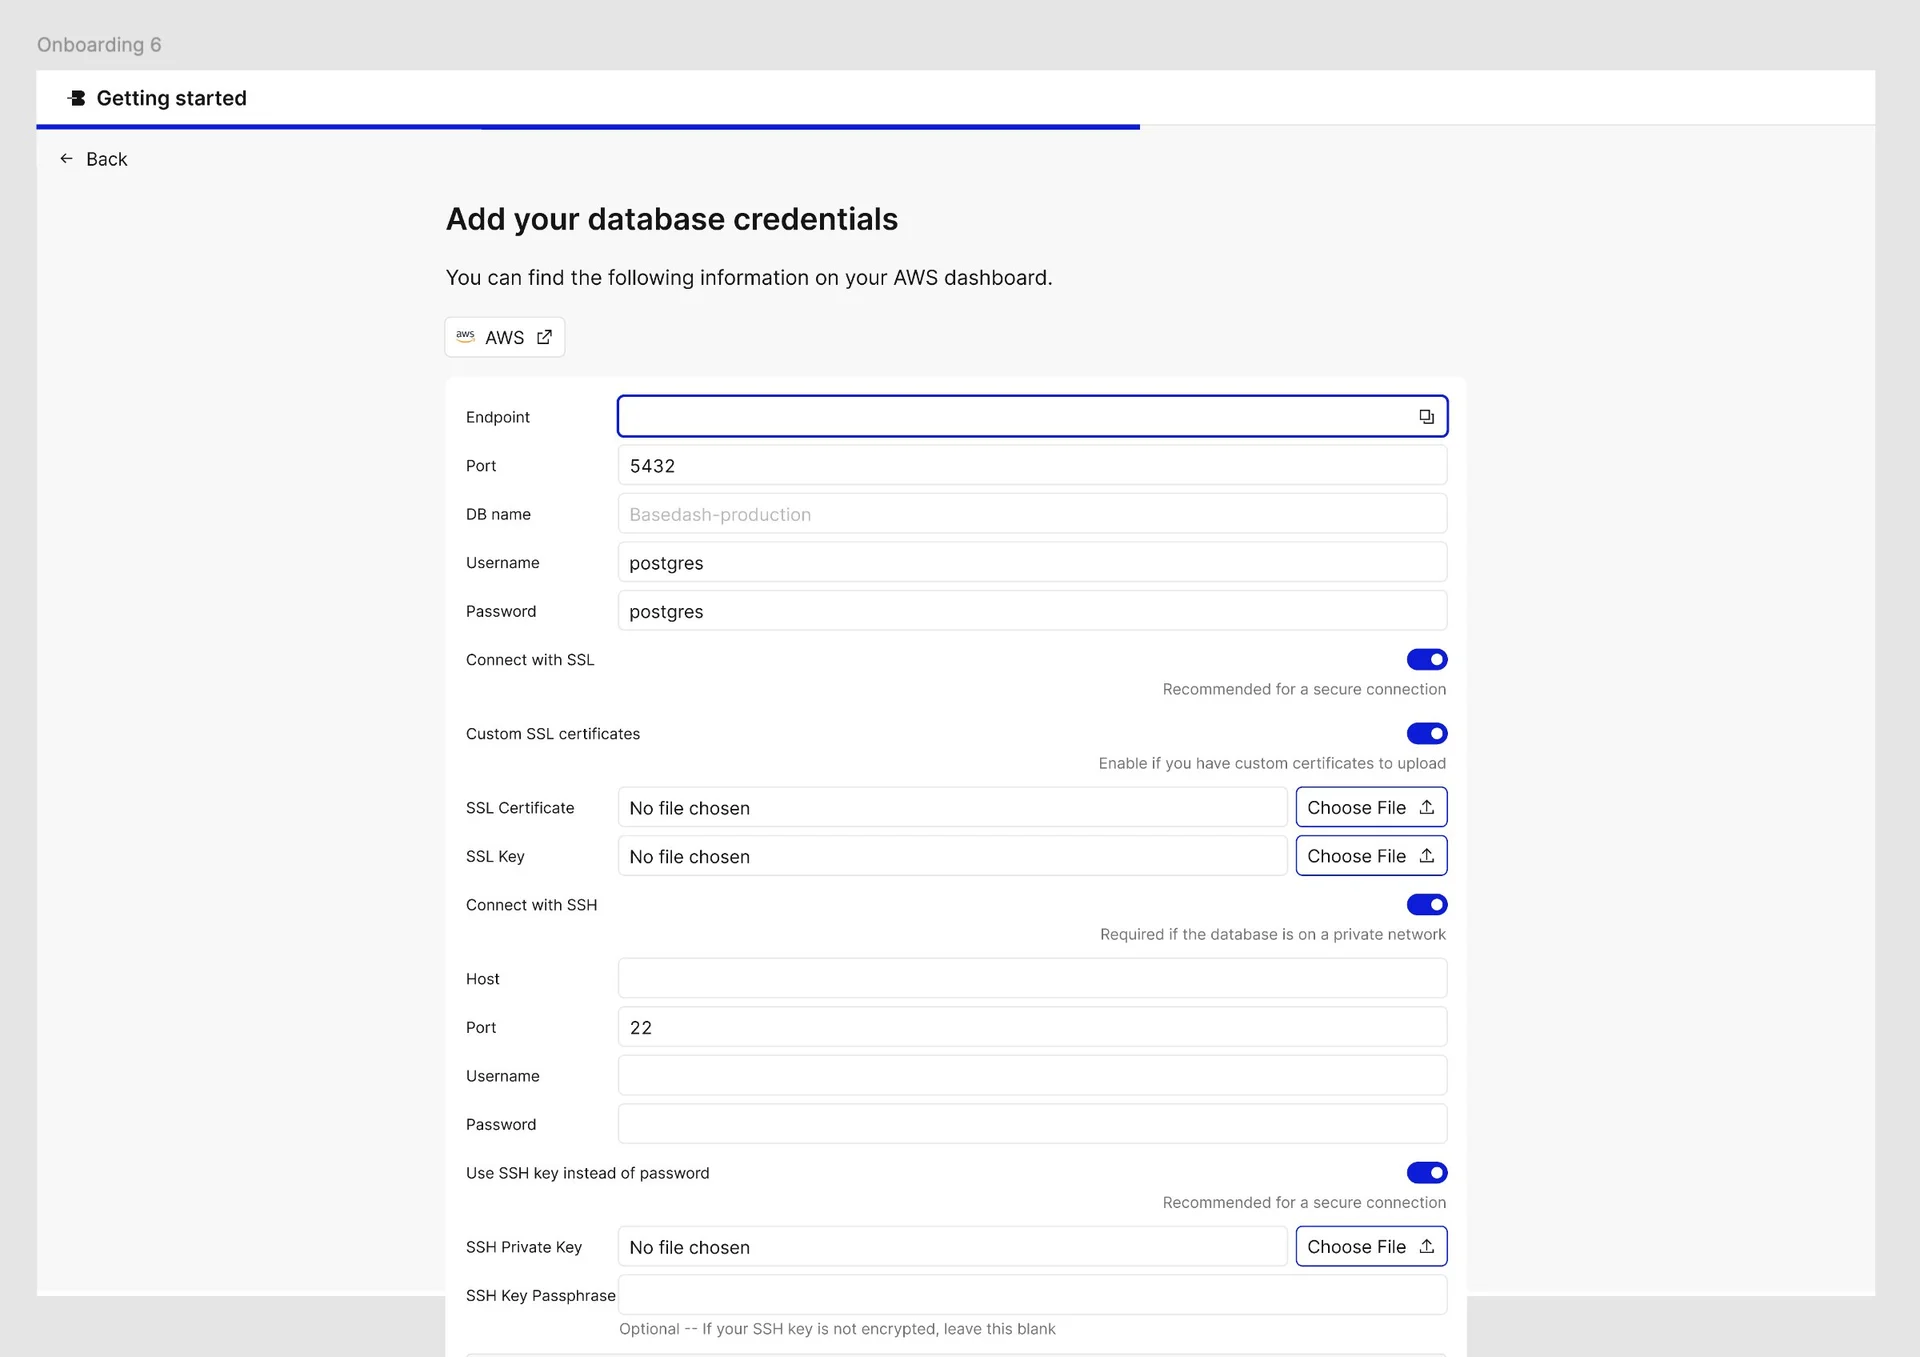
With Basedash, it's always been difficult to design onboarding. The person who sets up a database is often different from the person who uses the product. They have to have an easy setup, tutorials, debugging. They have to trust it. They have to understand it. They have to understand the security complications. They have to then configure it, and on and on and on.
It's also very frequently the person who signs up for Basedash is not the person who can connect the data source. So they hit walls, need to loop in teammates.
I have done so many versions of onboarding. So many.
It's never done.
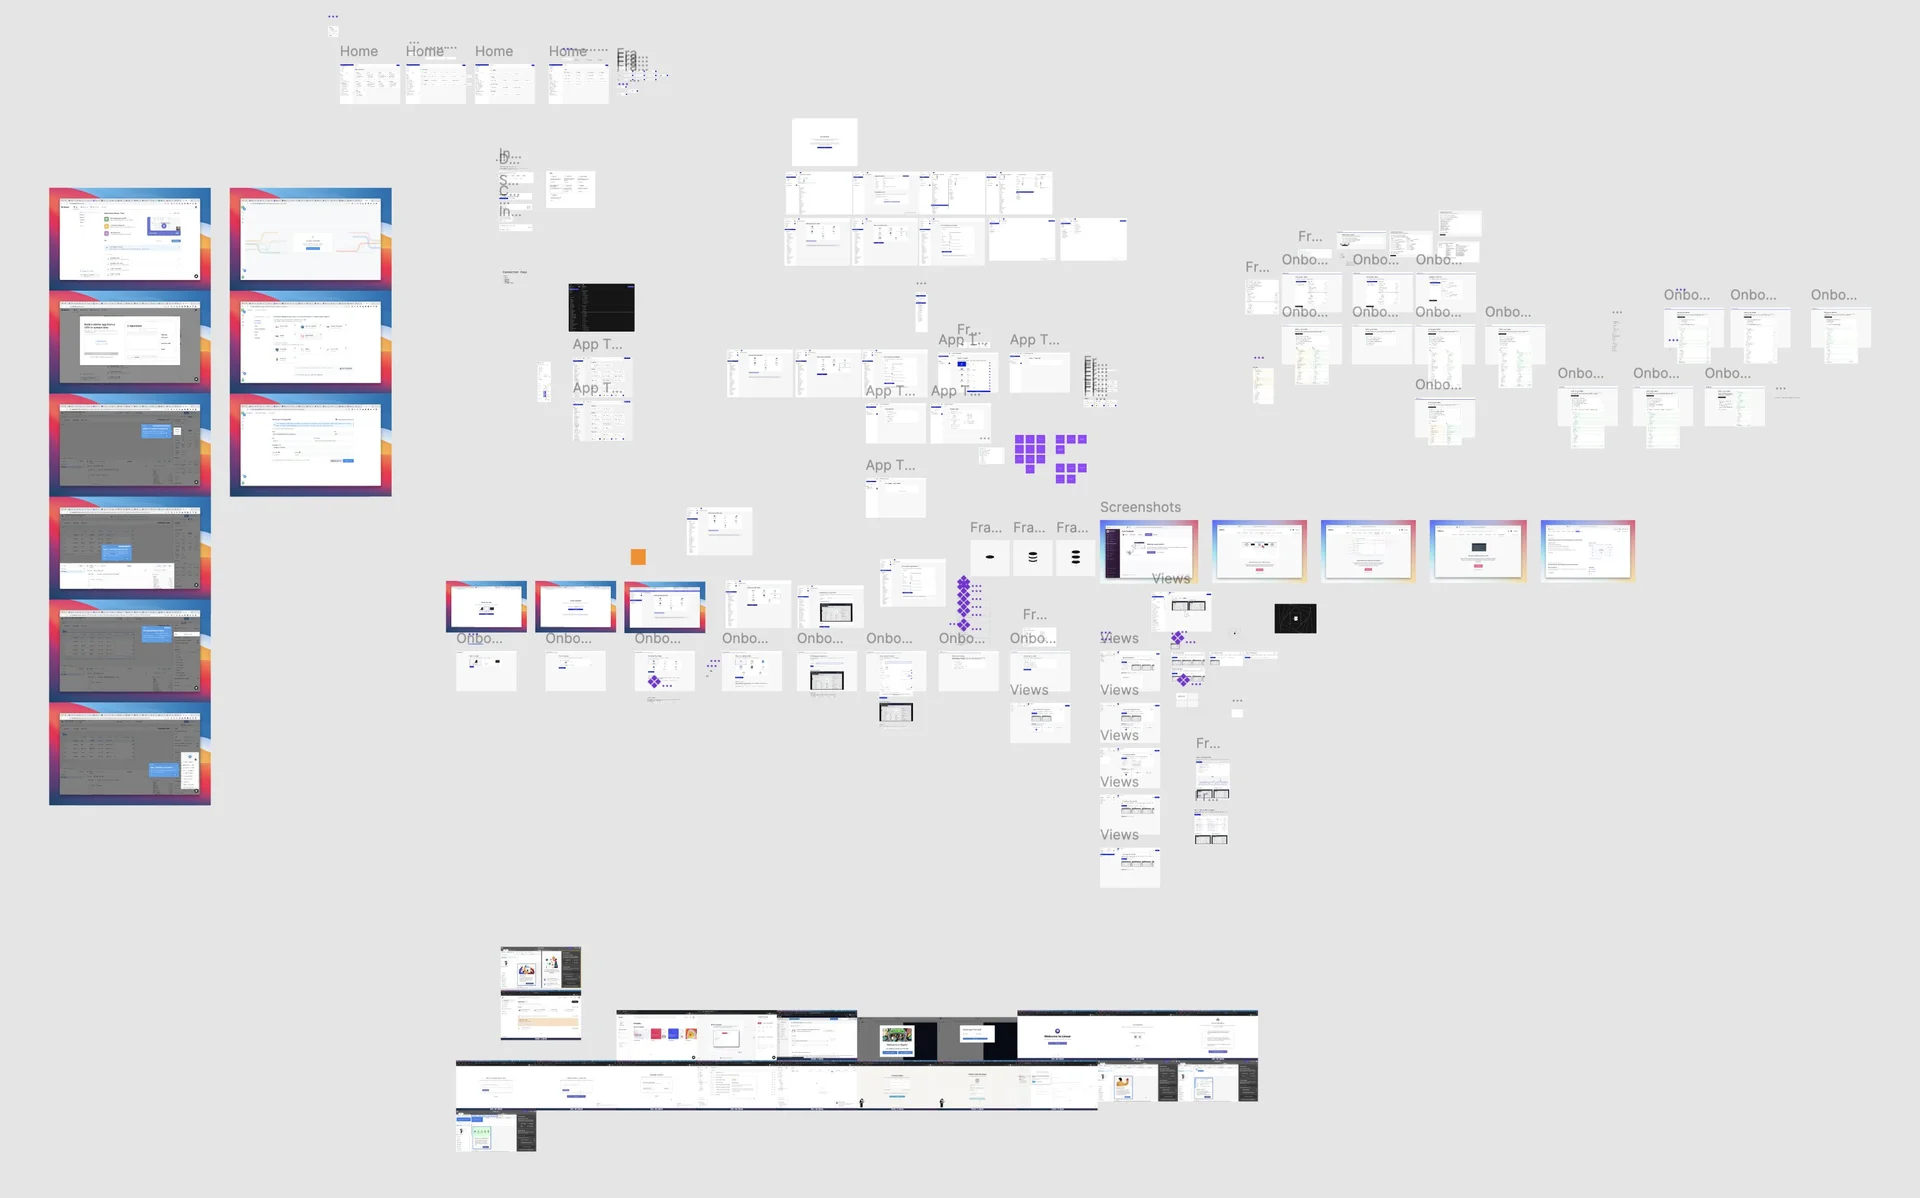
Oh man, have I prototyped.
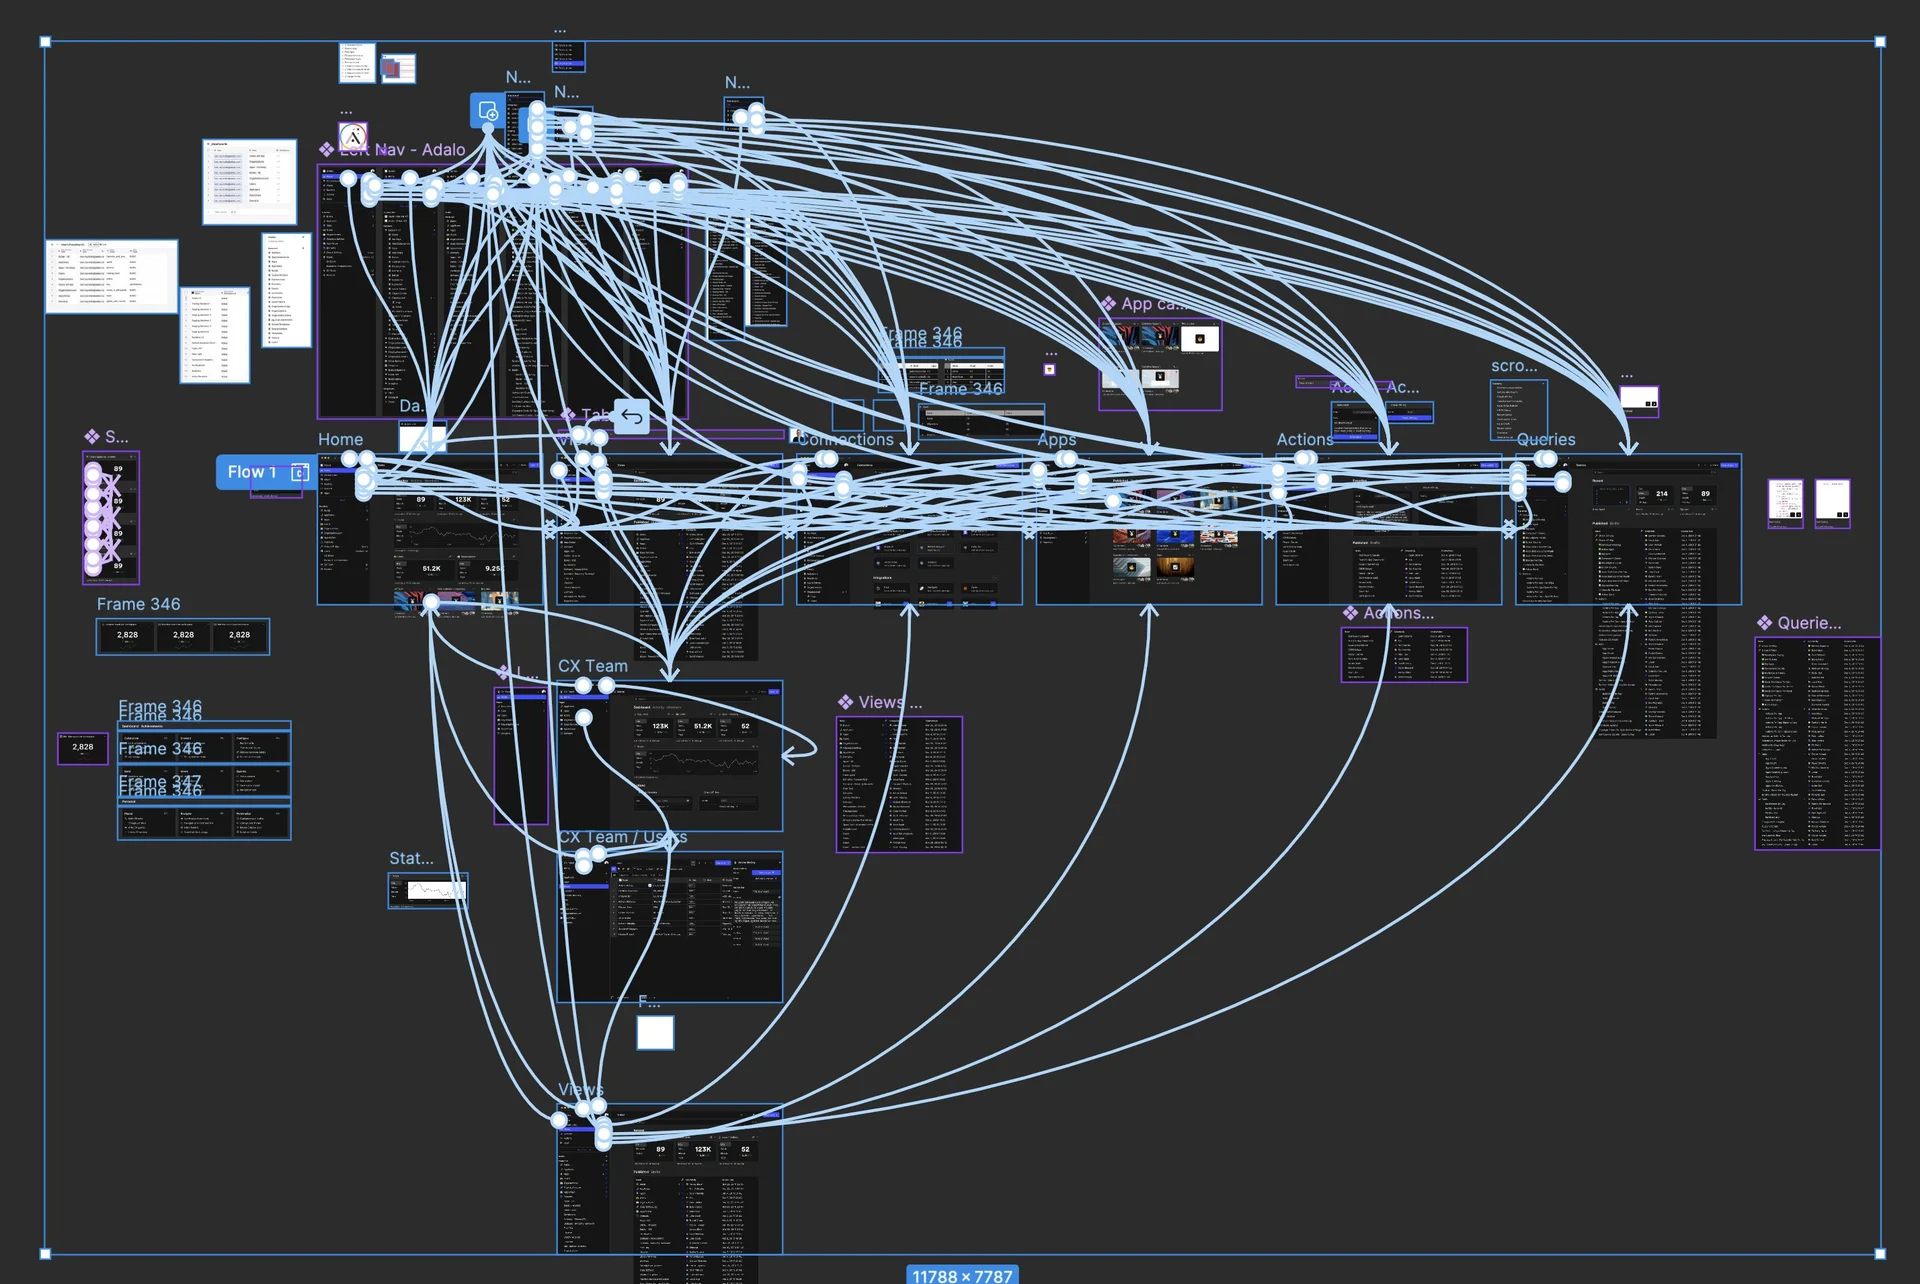
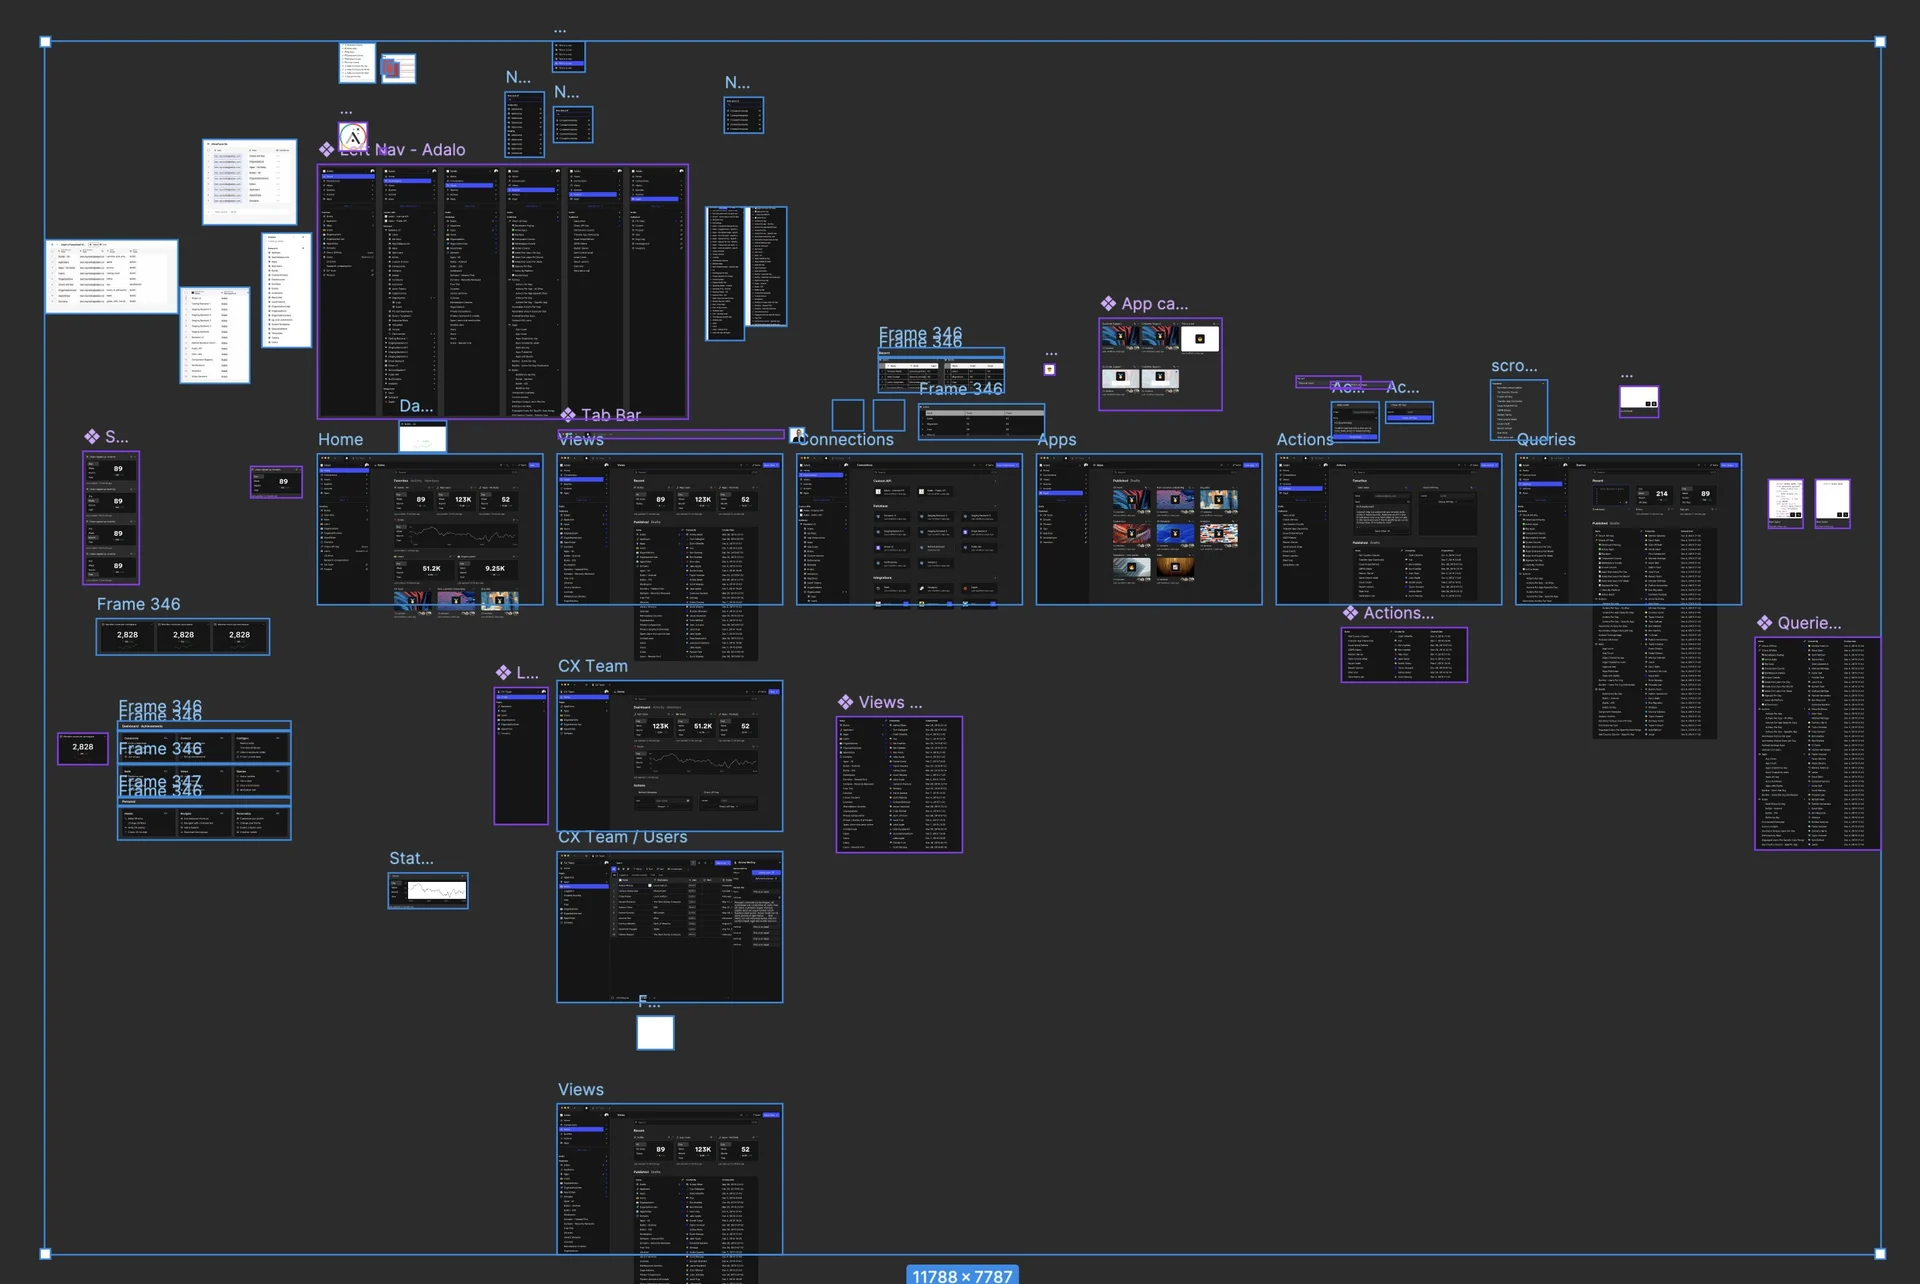
This one turned out to be nearly a complete waste of time? We had a very active user account, and they had given us a ton of feedback. I designed a whole new app architecture based off of their feedback (we ended up building it)
But when I showed it to them, I think we just basically stayed on page one and they talked the whole time. Because the prototype was not robust enough to interact with. They clicked on something. It didn't work. They stopped clicking.
I can't tell you how many times in my career I've built a prototype, and then when users start clicking around and discover that it's just hotspots and targets, they stop interacting with it like they normally would. They then think of how they would interact with it and start talking.
It's not to say that there's still not nuggets in there, but one of the biggest problems with designing Basedash has always been that it only makes sense with your data. Whenever I tried to prototype it with mock data, users just wouldn't understand it. Like, that's not my data.
It's insanely difficult to prototype something that has all these different sub-layers and views, nested structures, sub-views, tables, lists, and charts, when none of it can be real. I think I gave up prototyping Basedash two years ago because it was a huge time suck to get anything close to feeling real, and oftentimes it would end up just not being helpful at all. At least no more helpful than me showing static screenshots.
But better yet, it's to use the actual product as the prototype. To be close to the developers as possible, so that no matter what we want to build, we can build it quickly and try it out with their data and their interactions. And it all feels and is real.
APIs, content, and other possible directions
Oh man... I forgot about this idea.
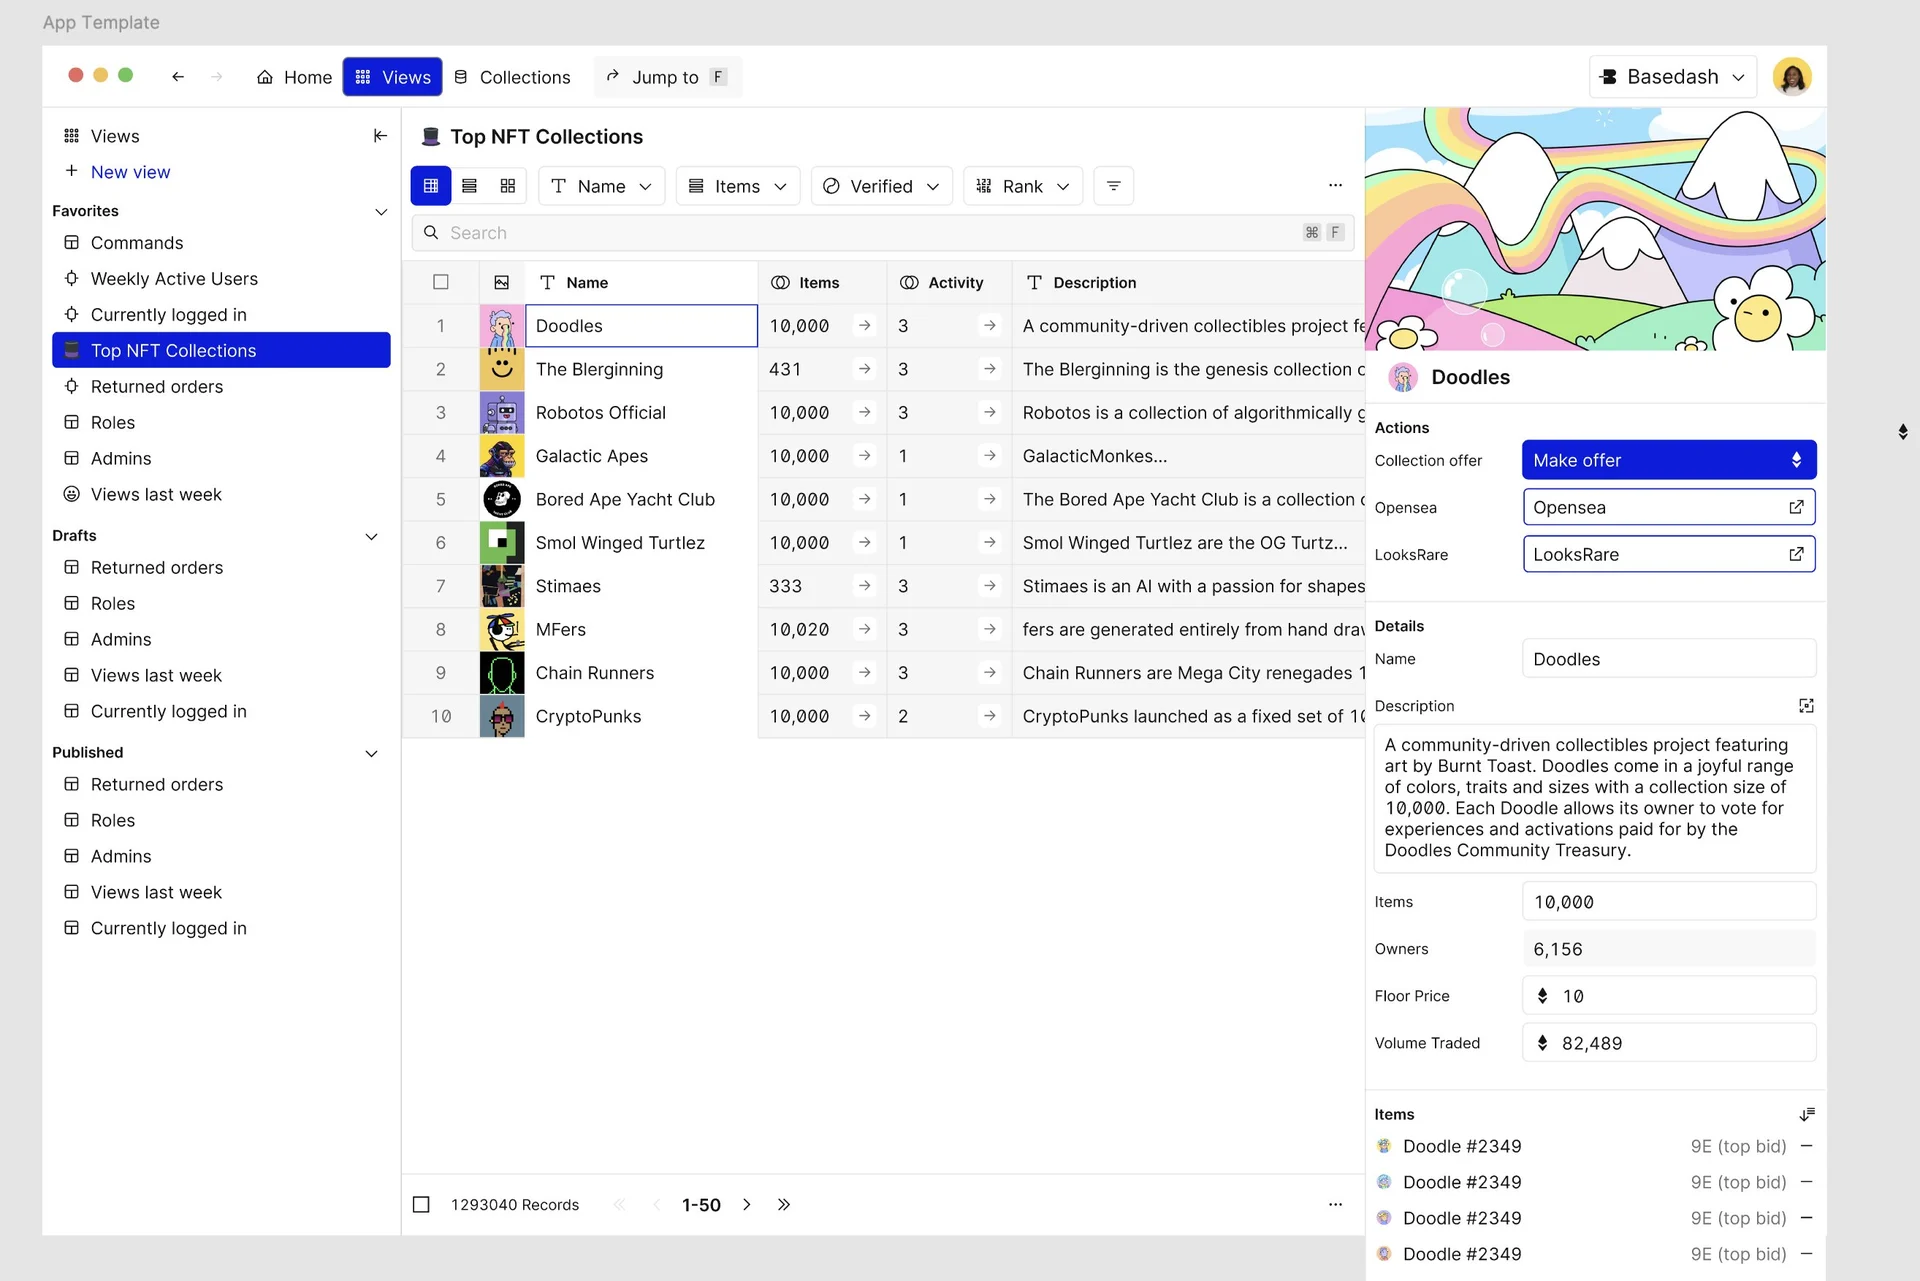
The thought here was that we could bind and display data from any arbitrary API and represent it in Basedash instead of using a database. We had a lot of discussion around it specifically because it was difficult to browse stuff like NFTs when the NFT phase was going on.
So my thought was: what if we could hook up OpenSea to Basedash so that you could browse collections, see trends, understand stuff, and jump into it and all that.
It was less about the NFT specifically, more like any API could render this, like weather data or stock data. I just happened to be deep in the NFT mind space. So that's where this came from.
More dashboard exploration here. NFT data was actually really easy to use for mock data, so I just stuck around with it.
This was back when I was very much opposed to page navigation, and more trying to make things expand and collapse and respond in line without navigating you somewhere else. My rationale was that navigating to a page felt like a dead end, you had to go back and forward and back and forward. If we could explore things at a top level, then it would be easier to explore more things.
Not necessarily a bad rationale, but also misguided and adds a ton of technical complexity that's unnecessary.
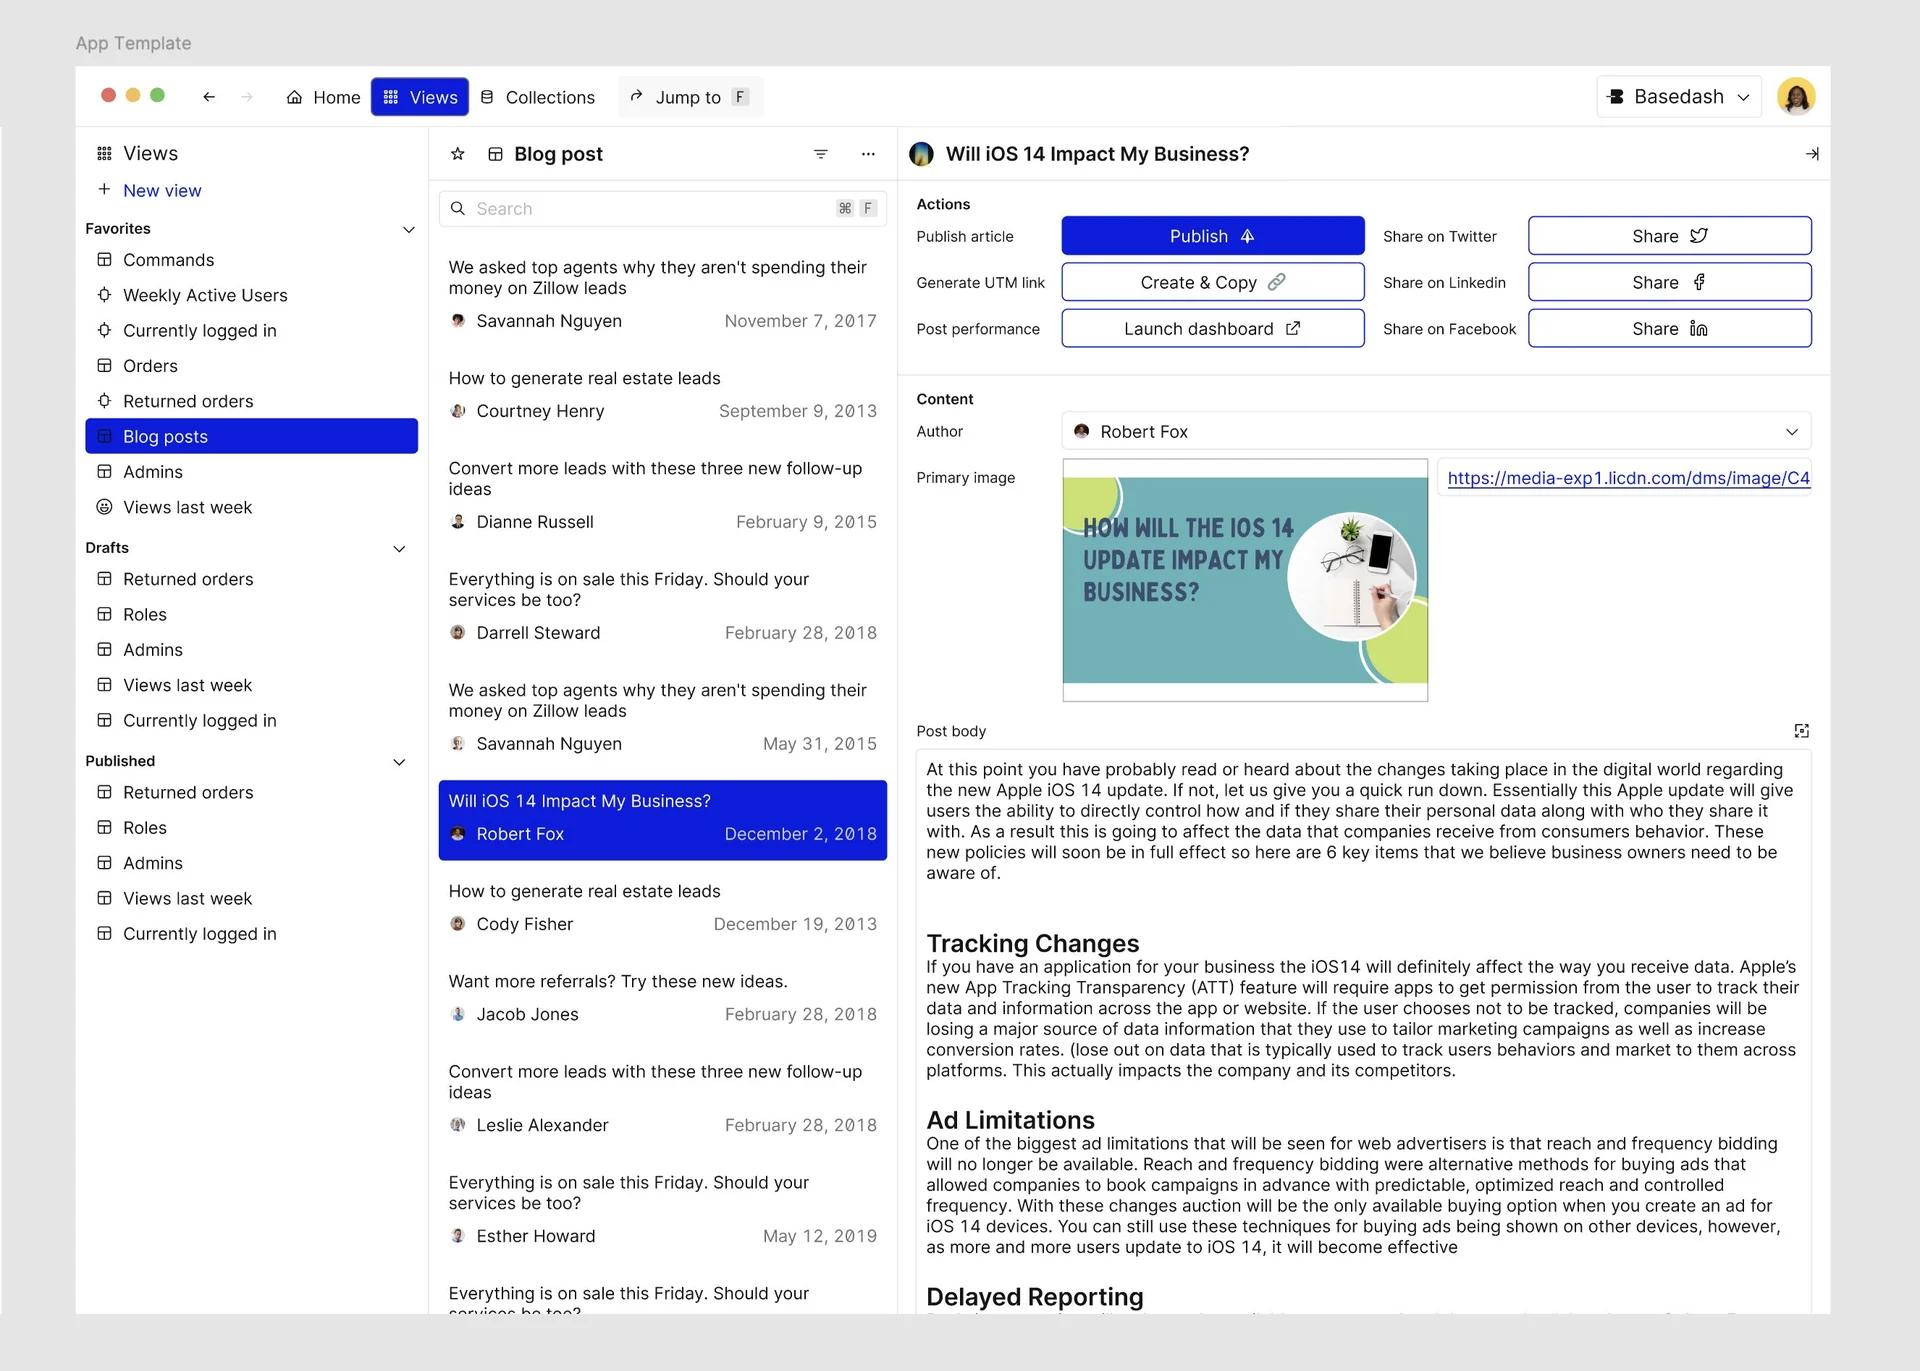
Oh, this is an interesting one. A customer came to us, asking if they could hook up their CMS to Basedash. At the time, that wouldn't have been possible (it is now) because we only connected to databases.
The idea here was that we could be the CMS for content stored in a database. Basically a headless CMS, which others have done much better than this screenshot and currently do. It's not typical for people to store website content in a database, but it is totally possible. So this was an interesting idea.
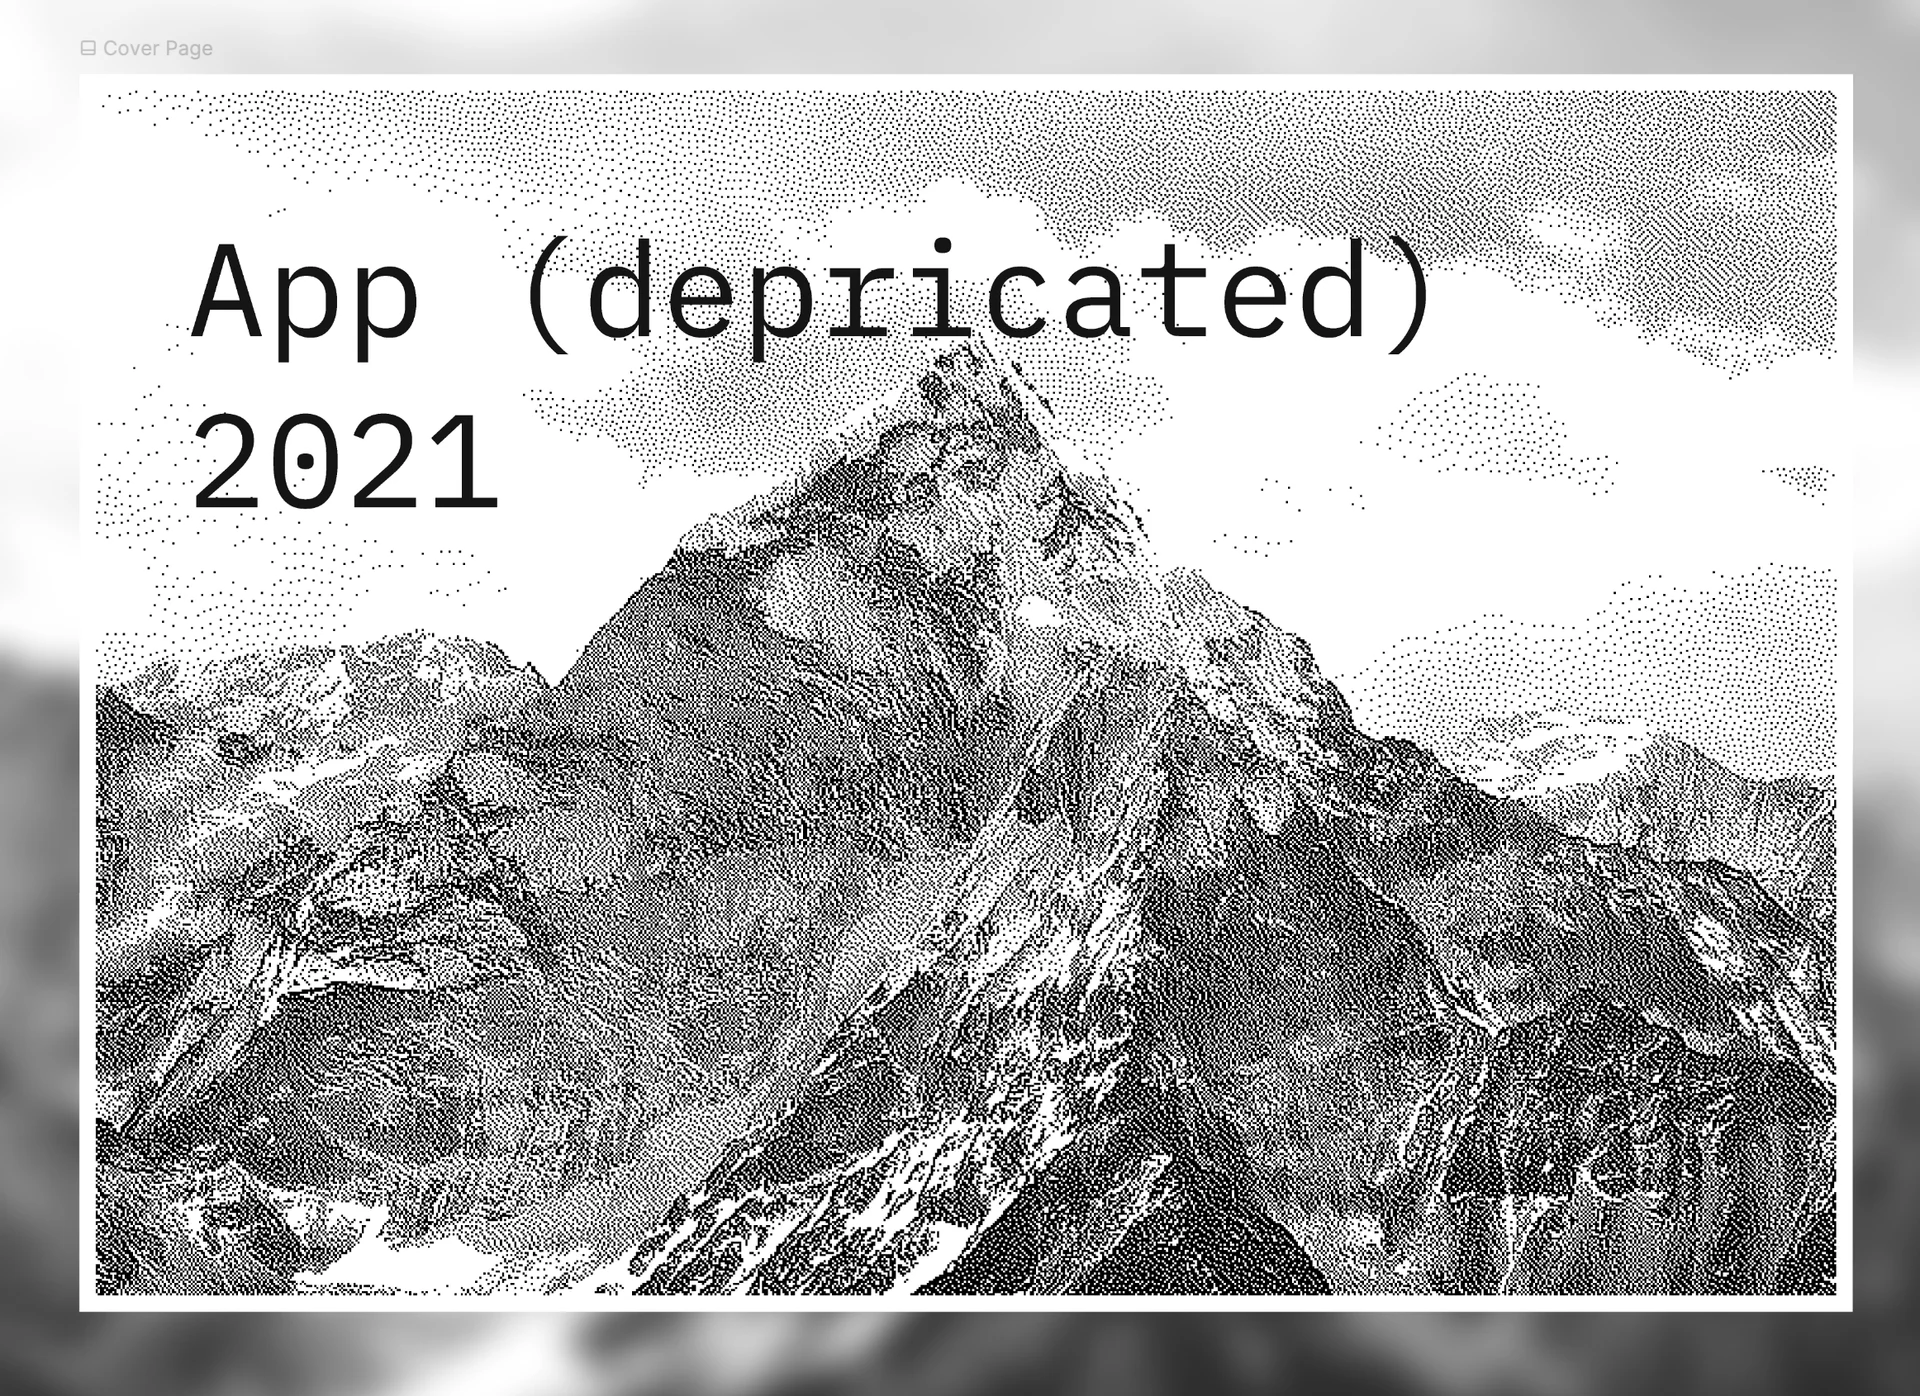
Also, here's my cover photo for this 2021 file.
It's dithered.
Hope that becomes a trend someday.
Bulk editing and the first AI visualizations
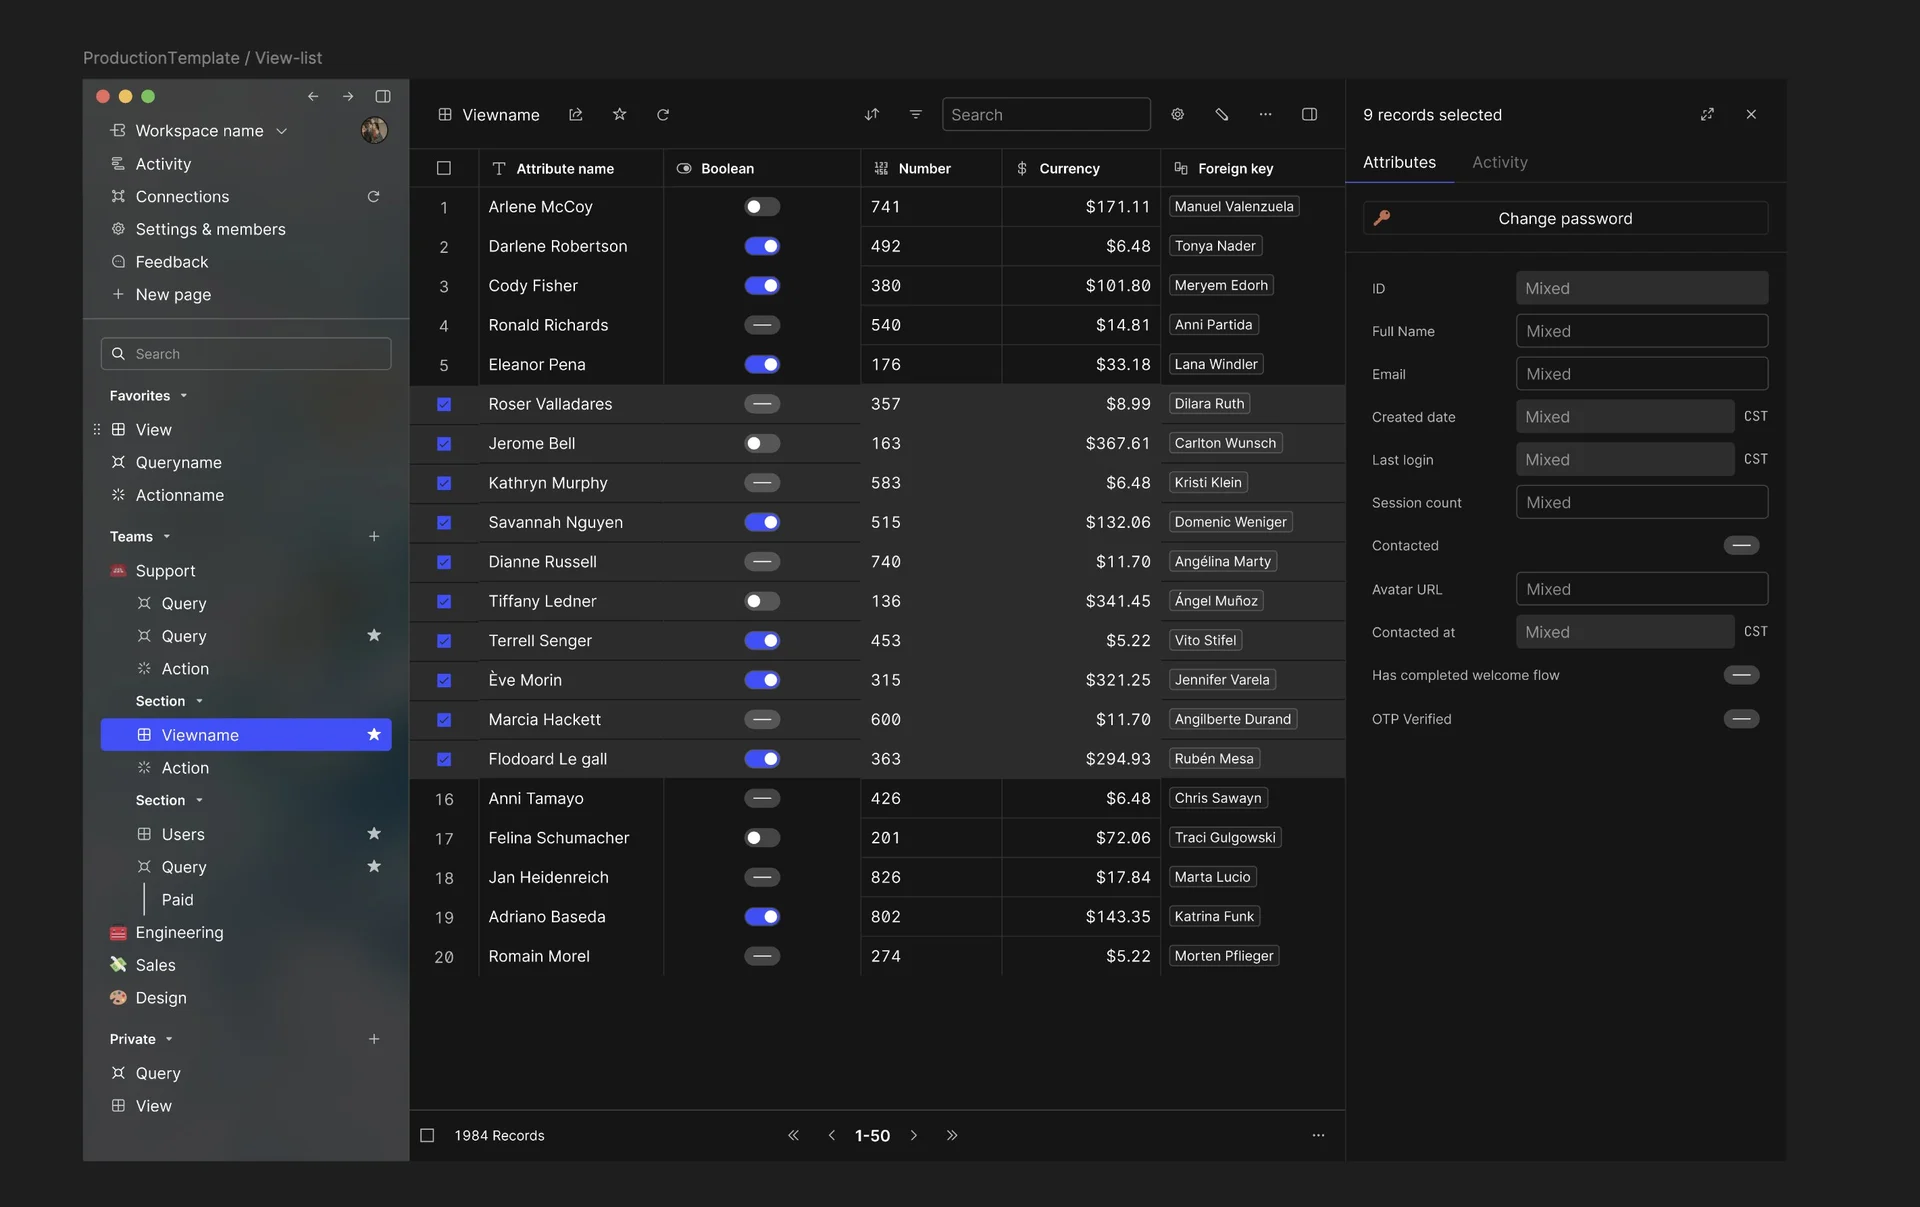
2023 was the year I went all in on the dark aesthetic. Here's some exploration around doing multiple edits at the same time.
We never did end up building this because, well, people are really scared about editing data. Let's just put it that way.
One record is scary enough, let alone all records in your database. This uhhh... had some issues. More on that later.
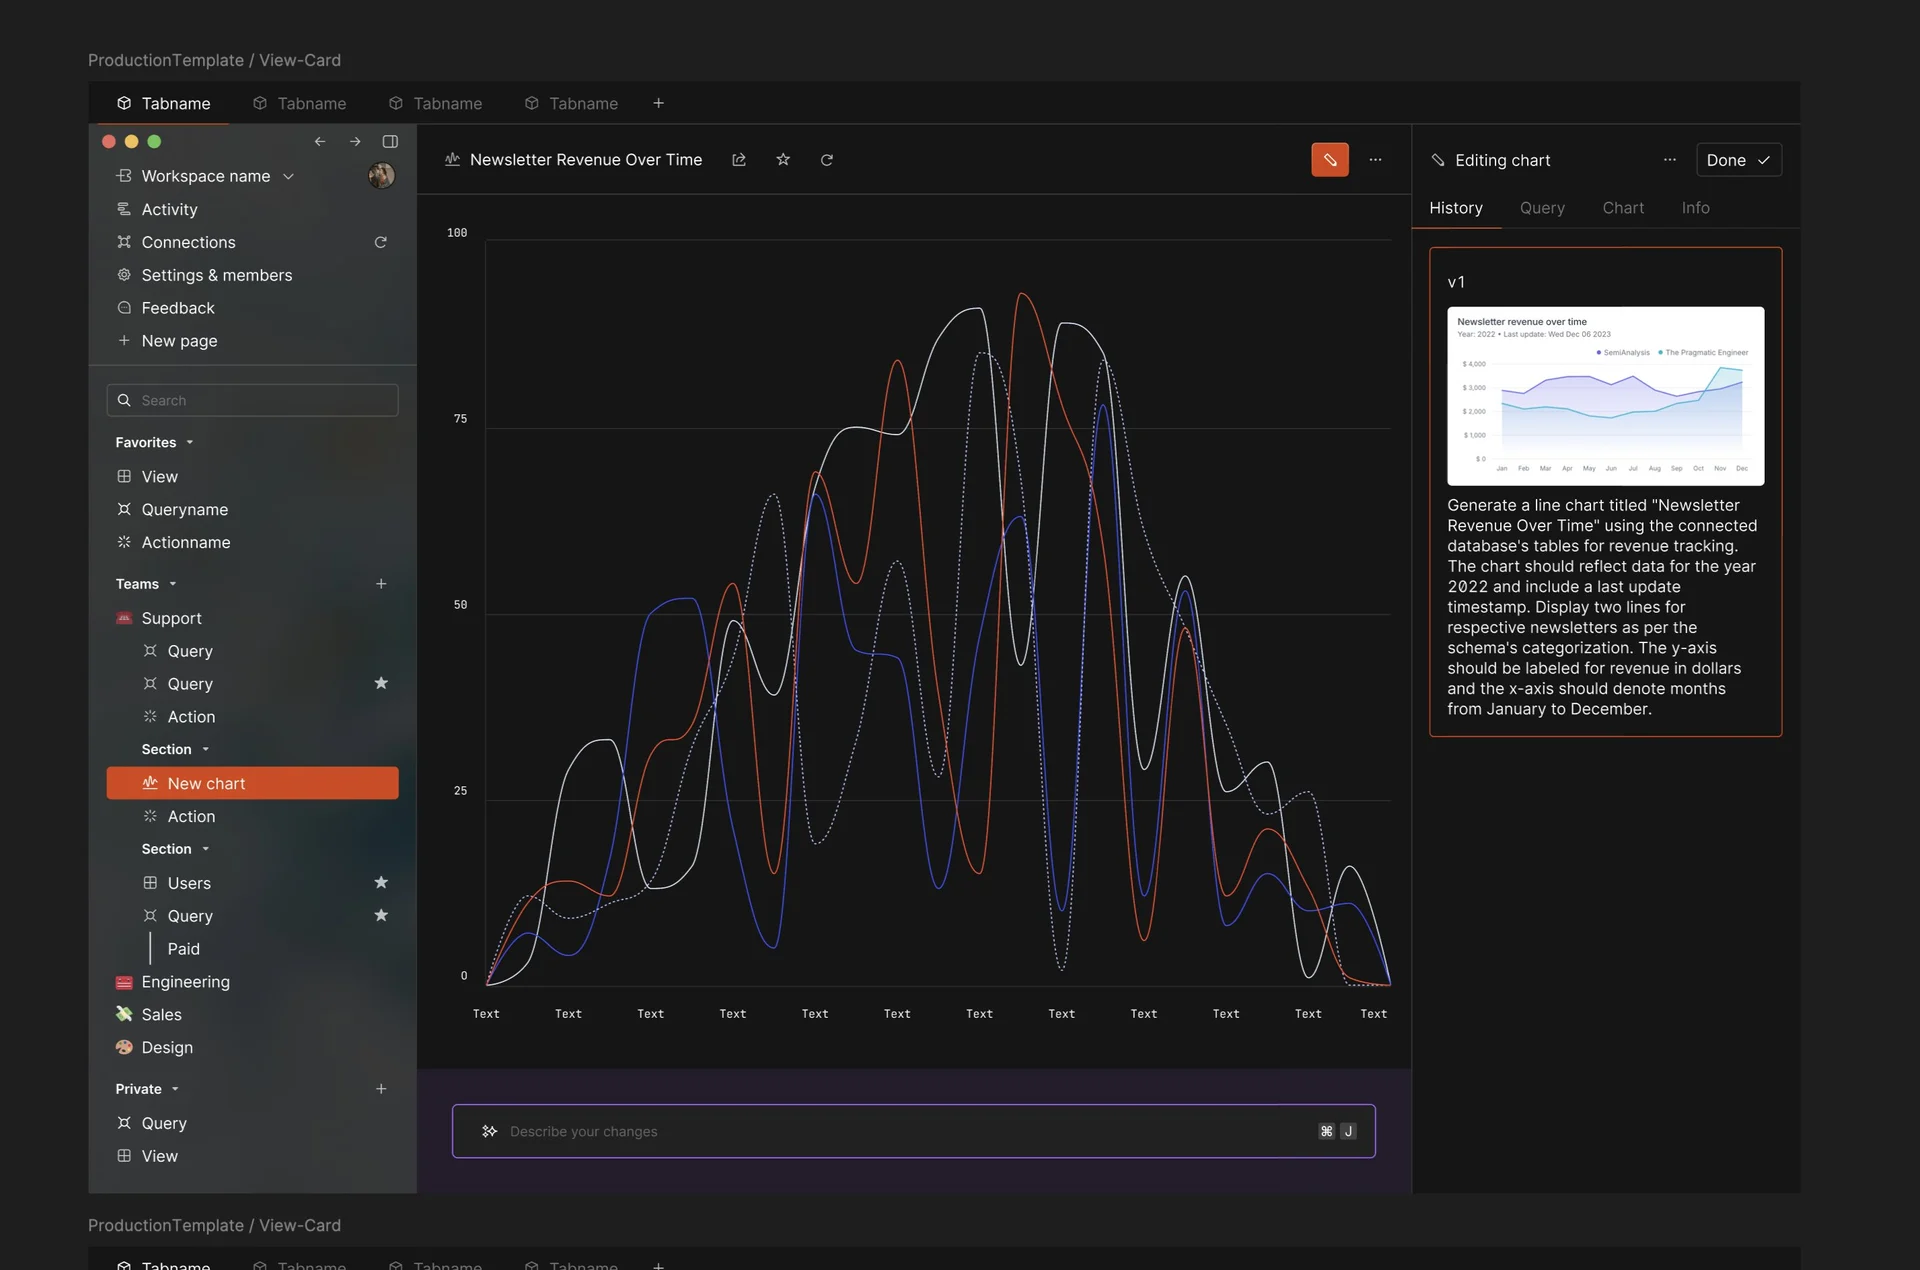
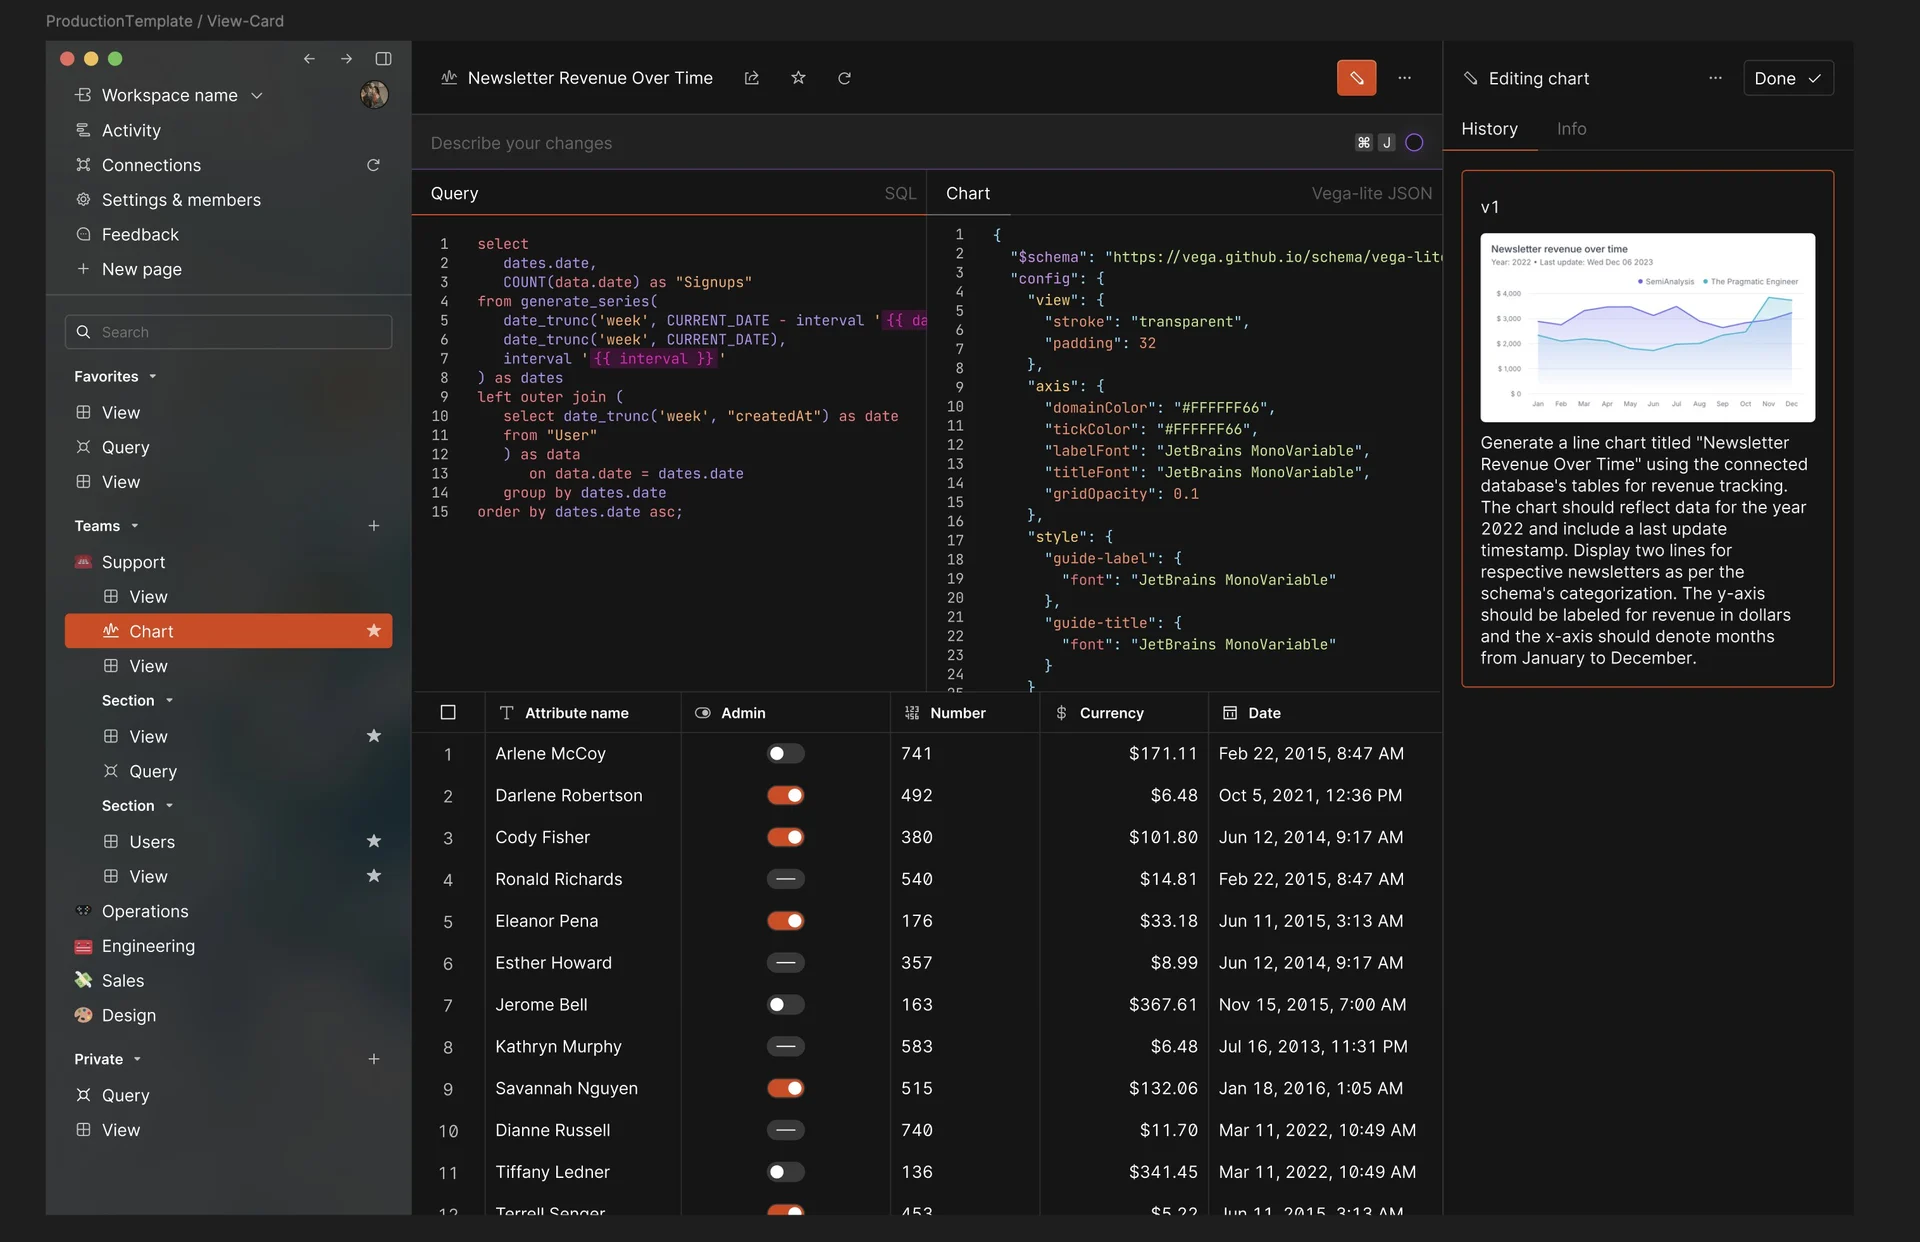
Ahhh.. the first AI explorations around creating visualizations. Tom of 2023 was much more of a color maximalist, I am finding. Bless his heart.
Our first explorations around visualizations used VegaLite because you can define the entire visualization with JSON. AI is good at generating JSON.
The problem was that the charts weren't great. The output was difficult to control. There was a lot of missing stuff with hover states, data affordances, and stylistic stuff around the charts.
It was really interesting to be able to bolt that into the application because we just had to get the AI to generate SQL and JSON, but the output wasn't great.
When AI looked like a special effect
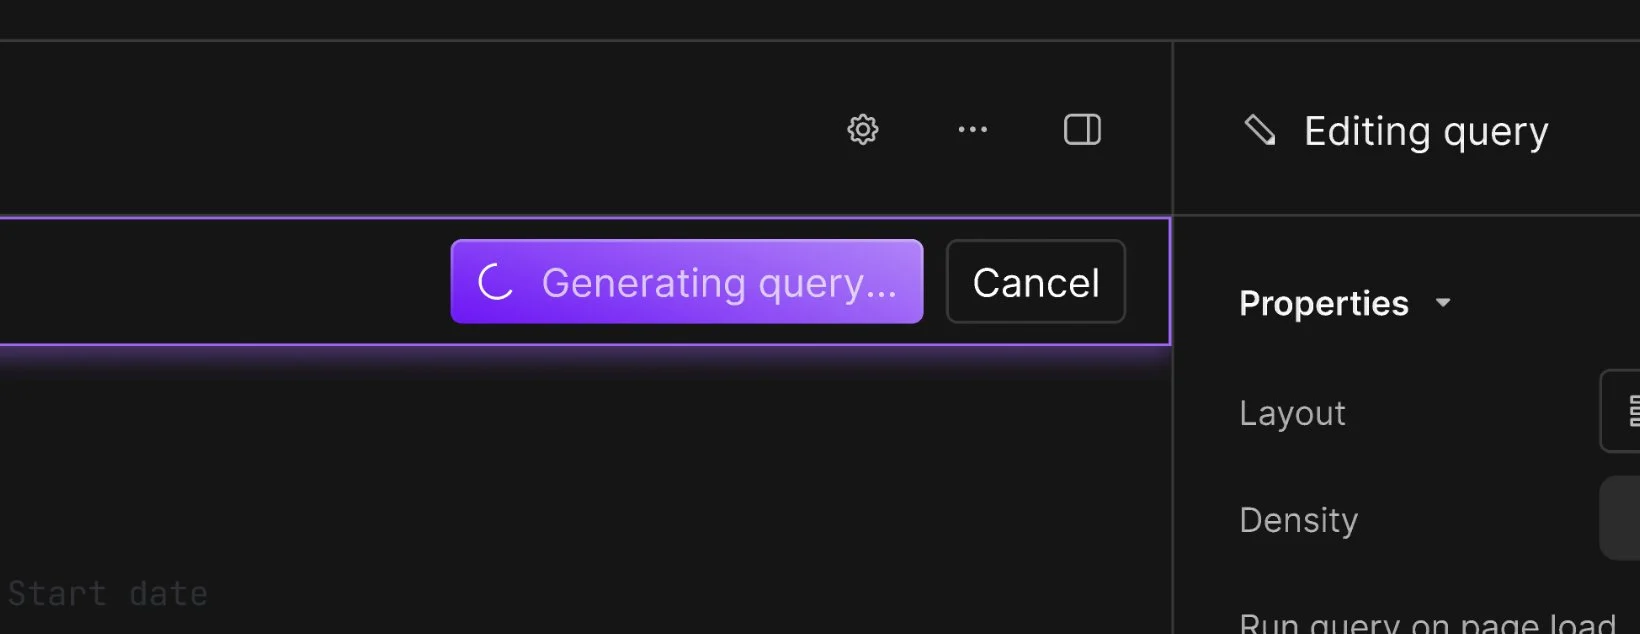
Oh man, check out this early AI loader. Woof.
This was before @hiunicornstudio, so I used a different tool to generate this, I don't remember what, and then we actually embedded the movie file inside of a clipped div to get the effect to work. Lots of blending modes, had to make the video loopable. It was a whole thing.
I thought this was so cool at the time.
I was seriously wrong. ew.
Hmmmmmm
Yeah, so this is when I started to dislike buttons. When you're trying this hard to get someone to click something, something is wrong with the application itself.
That being said, it is an... interesting button. Not bad, but there's no reason for it. Also, there's no way we're gonna see these all the time and continue to be okay with it. Way too over the top.
An early AI prototype.
Okay, okay. In my defense, this is when AI was still kind of a new thing.
Adding it to your product made it feel like Ooh, fancy AI! Whoa, whoa, whoa! So you really wanted to kind of go over the top of that.
Now that AI is kind of like table stakes, this interaction looks insane. There's no reason I should be this impressed with the fact that we are hitting an OpenAI API and returning a list of results.
Of course, that's an dramatic oversimplification, but there's a lot of better ways to do this as we now know.
Sidebars, a near-CRM, and shareable snapshots
Sidebars are hard.
I don't care who says they're not. They are hard.
It's always difficult to know exactly how much complexity to show a user, how to categorize things, how to group things, which ones are most common actions, what are the labels, what controls do you show, do you need helper text, how to stuff stack when you get too many children, how do you show affordances for errors, and on and on and on and on and on and on.
I have designed so many sidebars.
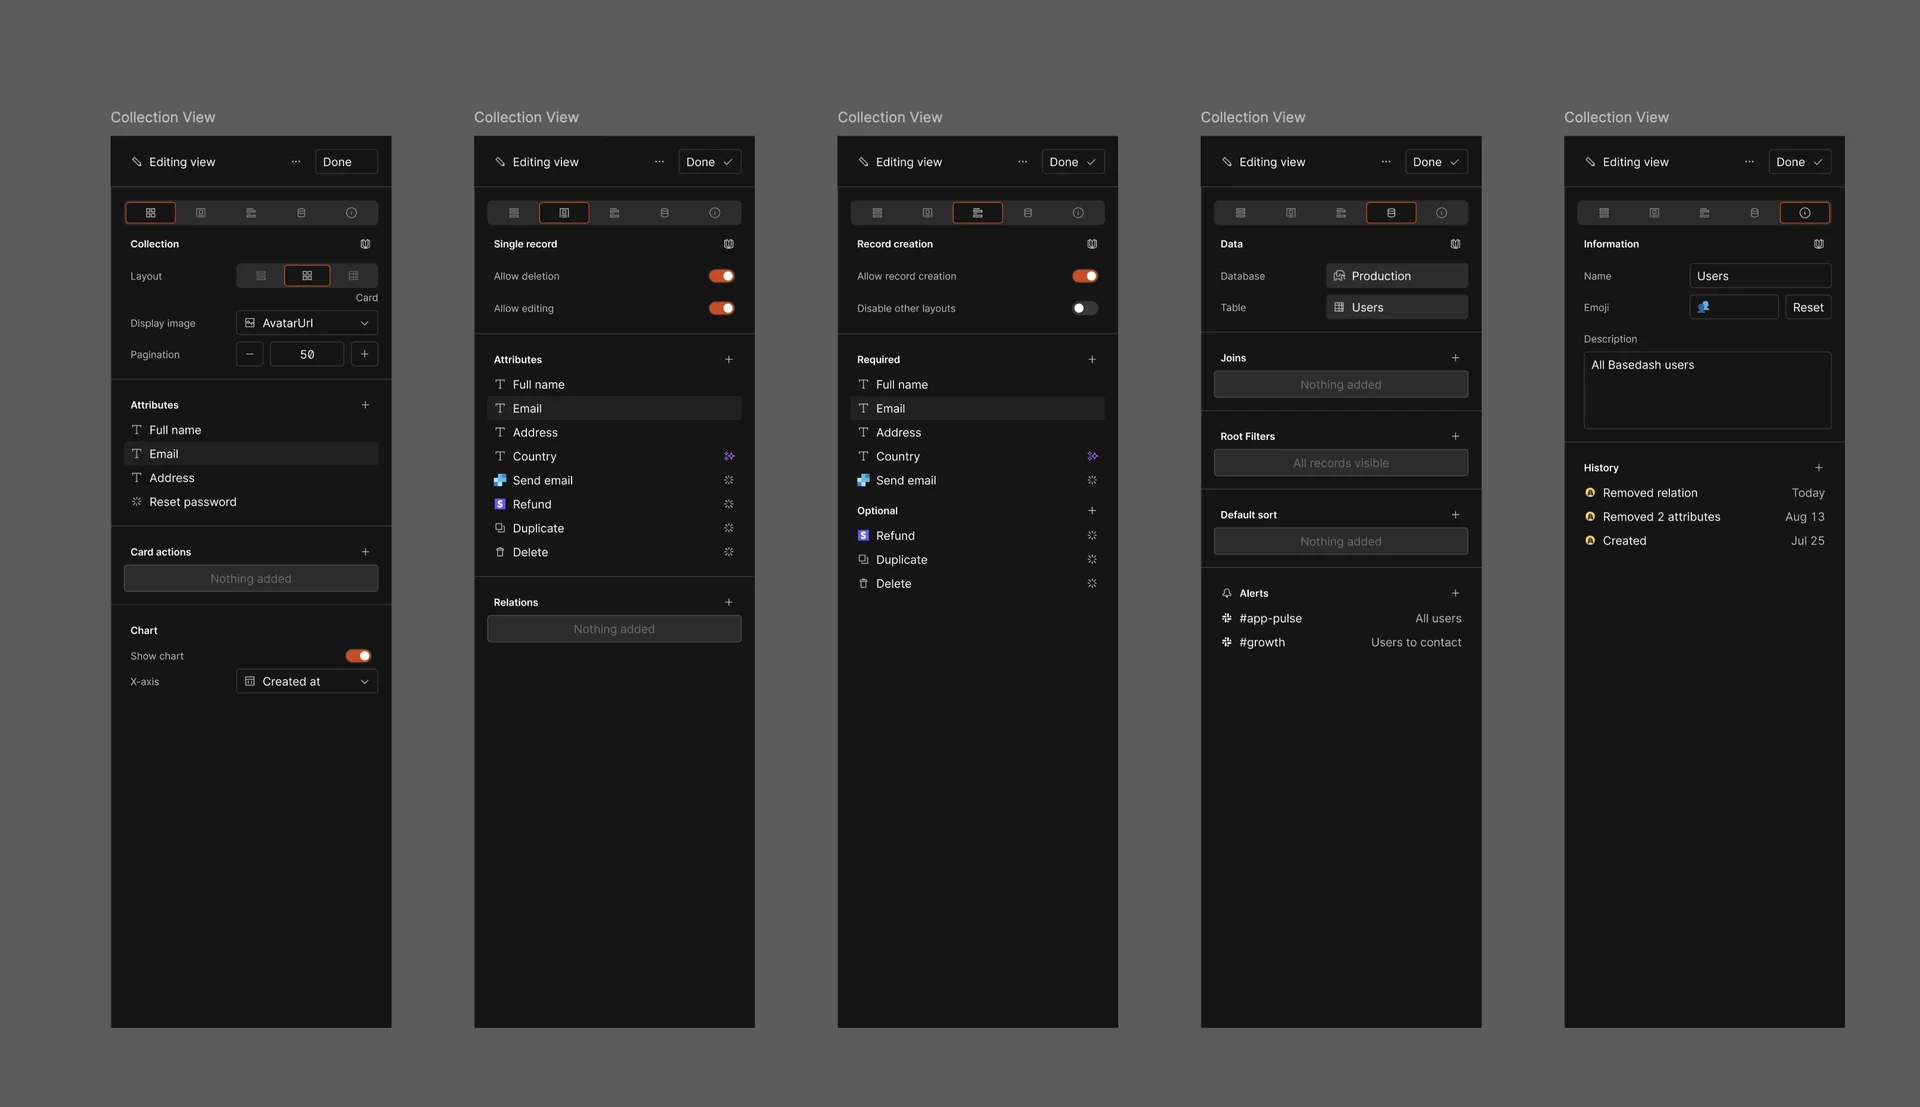
This is one that shows all the different edit states for a view within basedash admin. Lots of lessons learned.
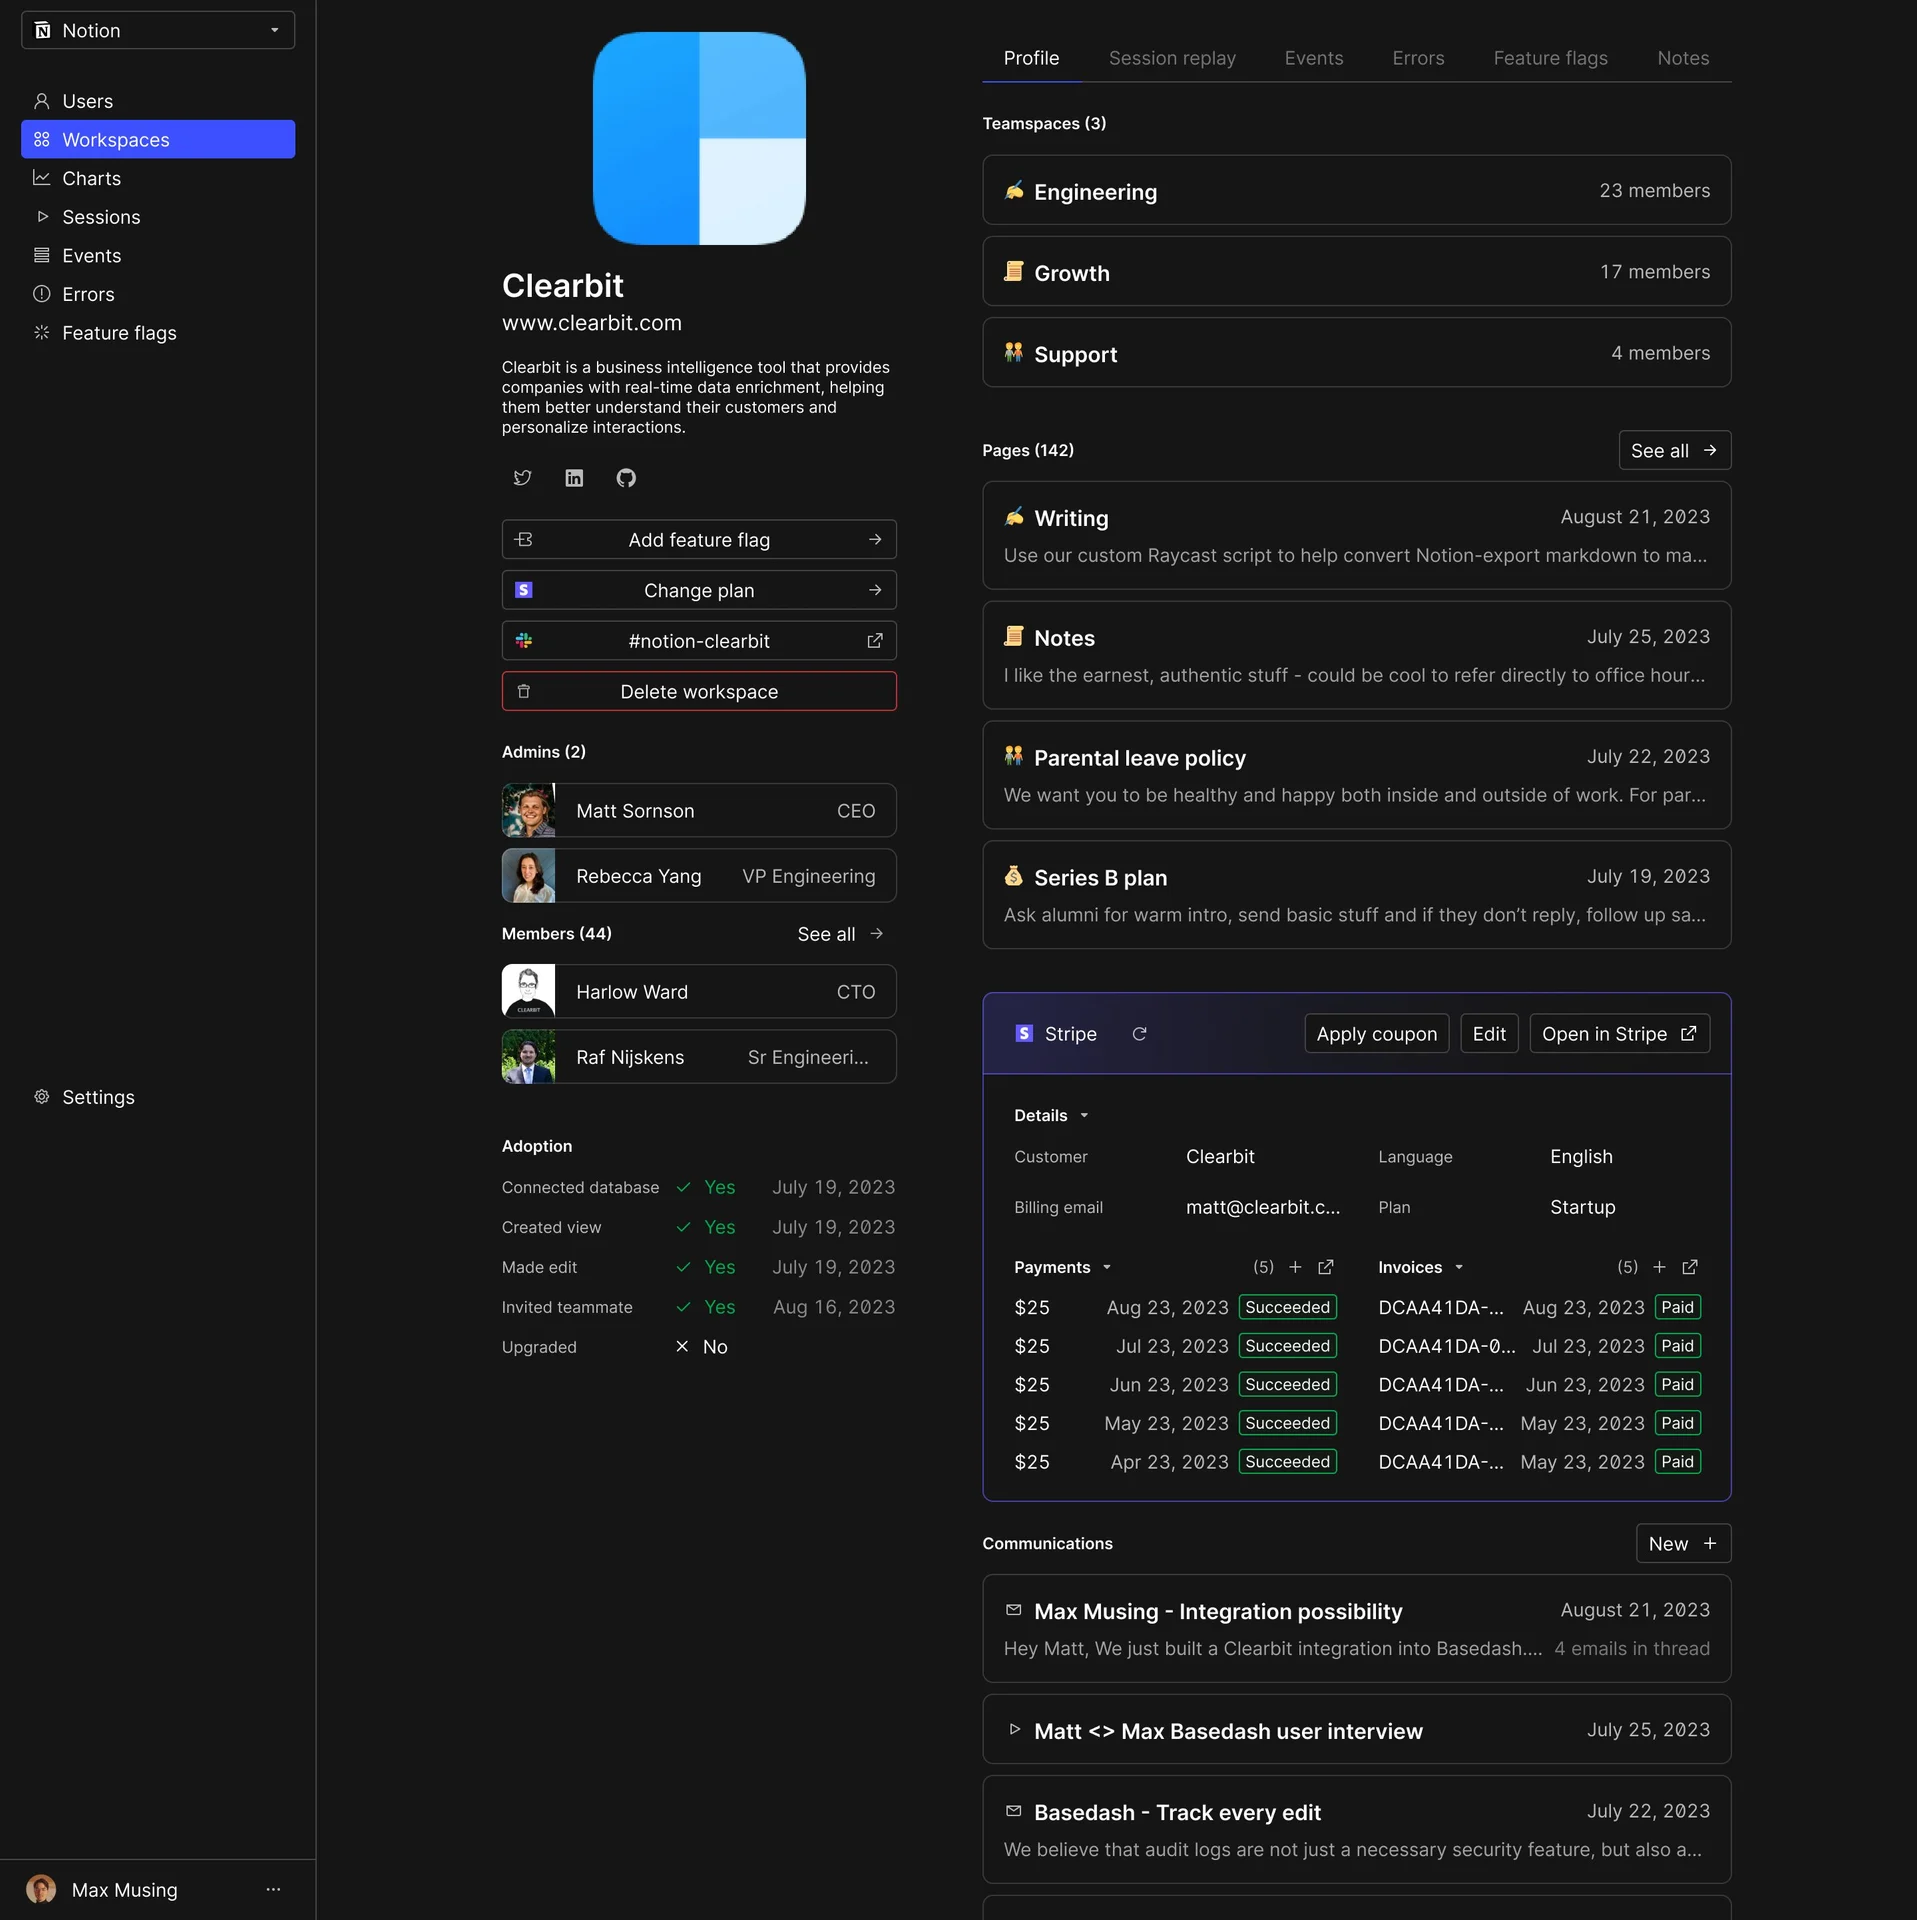
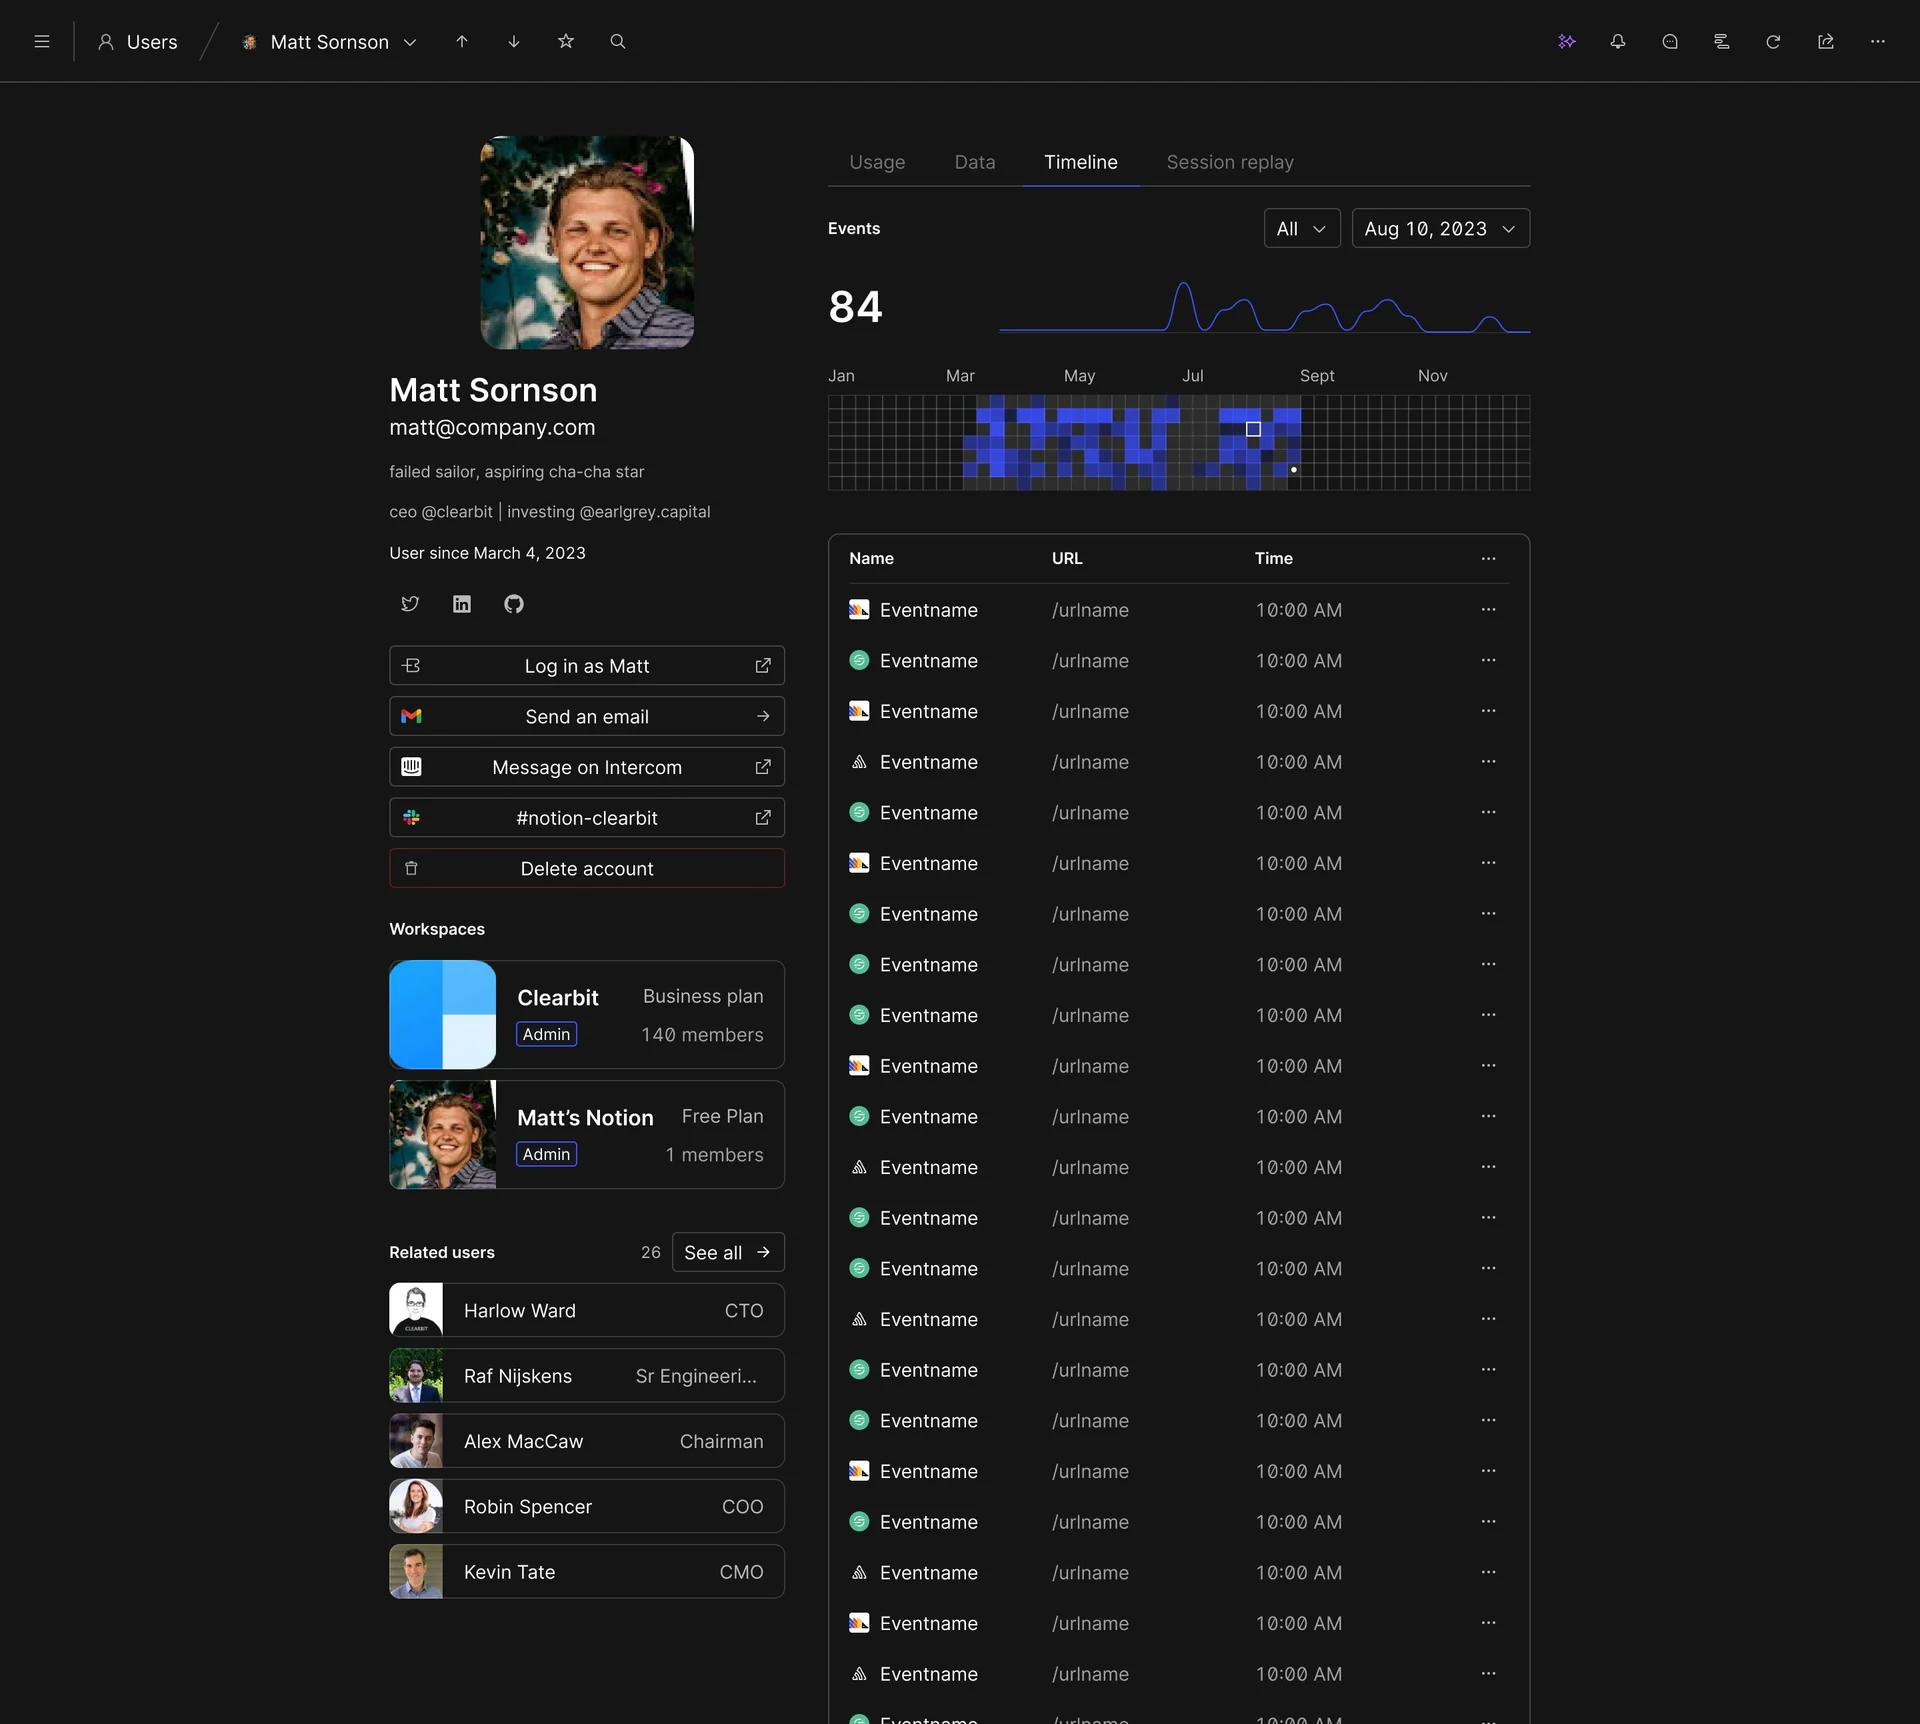
Whoa. I completely forgot that we almost pivoted into being a CRM. Kind of in the @JuneDotSo space? We saw a lot of people using Basedash to visualize individual records or companies with usage and billing, and yada yada yada.
So we went deep down the rabbit hole of: what if we were actually a CRM, but more for company data? Who's your organization? Who are your users? All that kind of stuff.
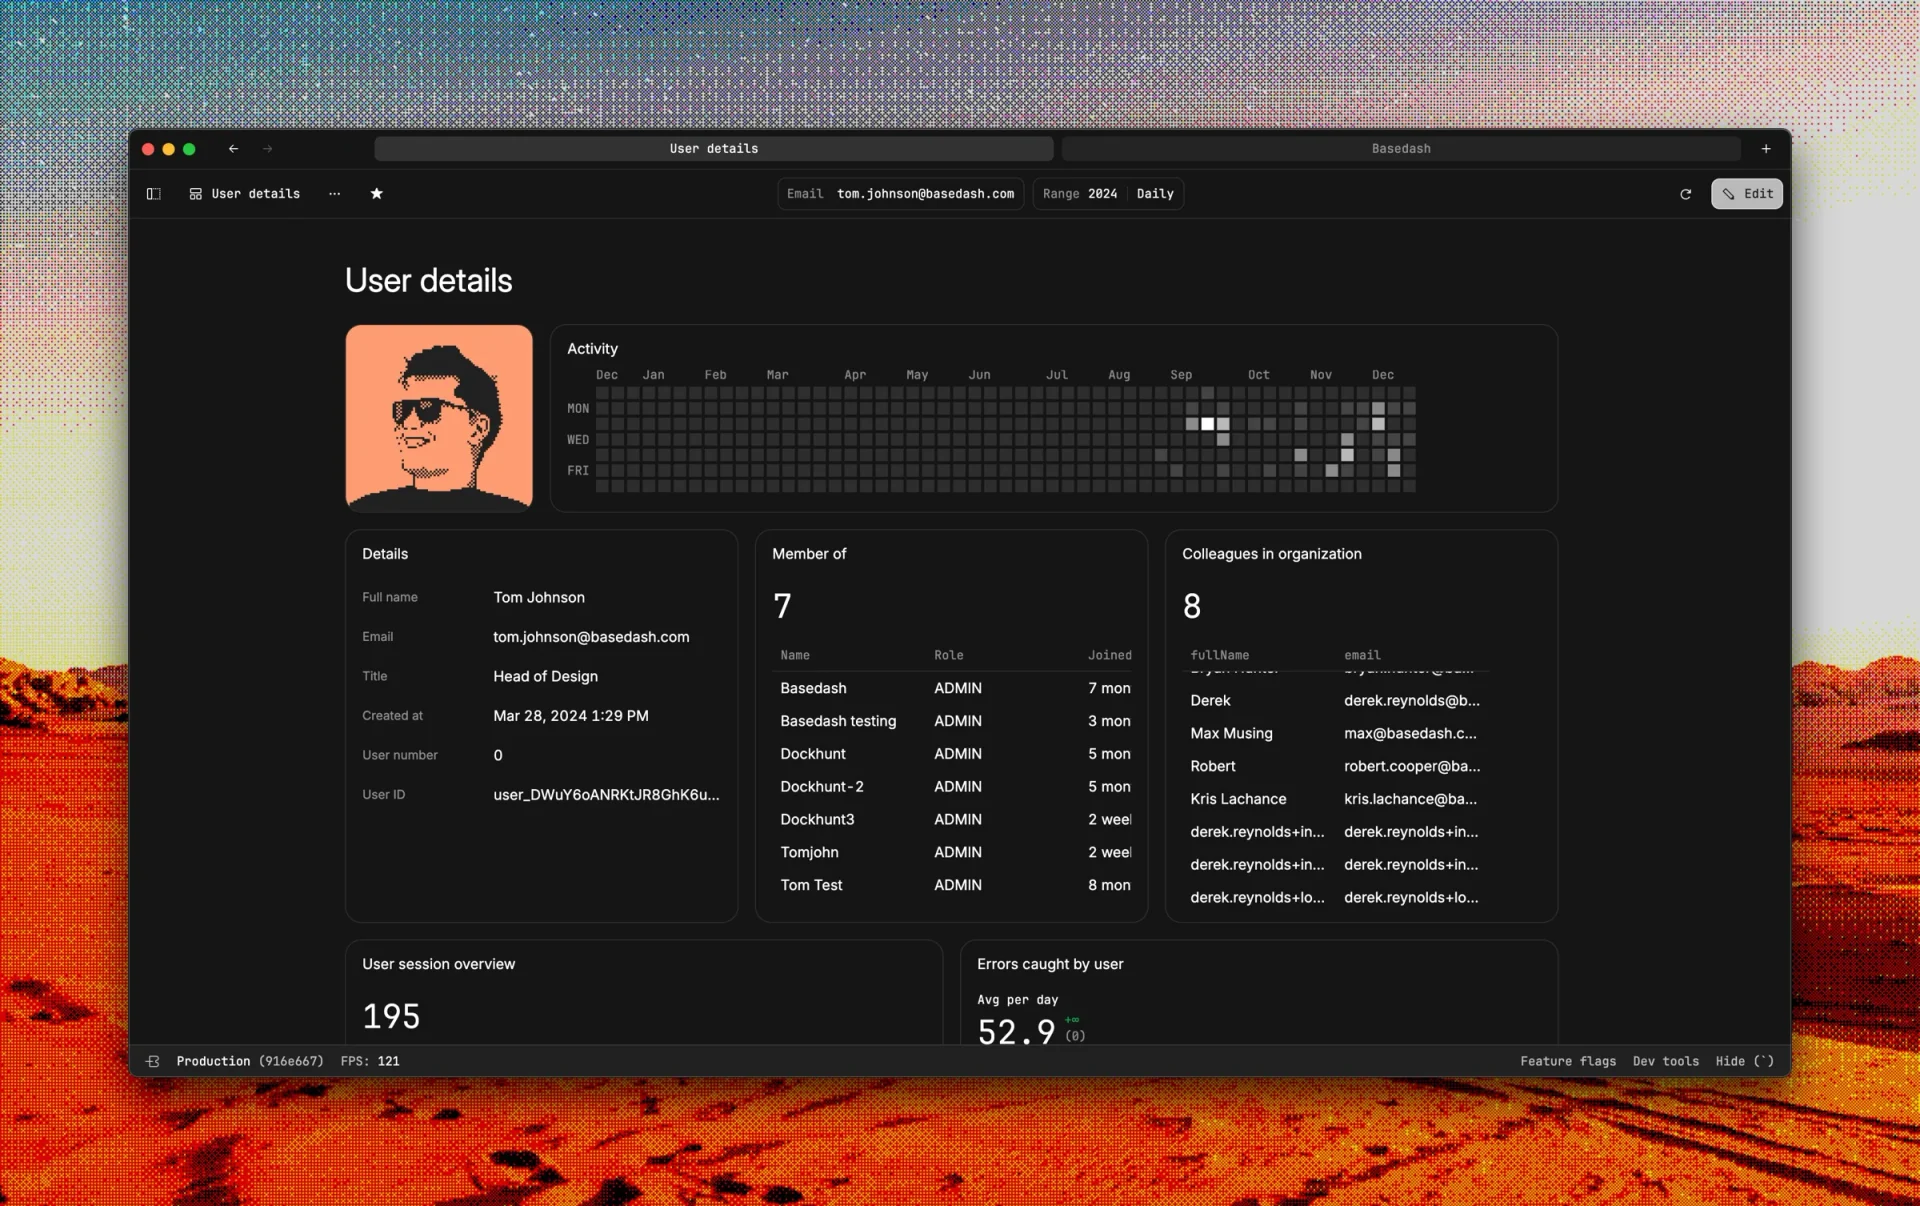
Interestingly, this is how people use the current version of Basedash when they're creating dashboards for those entities. It's a lot more open-ended so you can just say like "create a user dashboard" or "create an organization dashboard" and do almost exactly this stuff. Along with anything else you want to visualize.
Now that I look at it, there's a ton of similarity in these mockups to what we currently do with data visualization and dashboarding. I just didn't know what I was designing at the time, I guess.
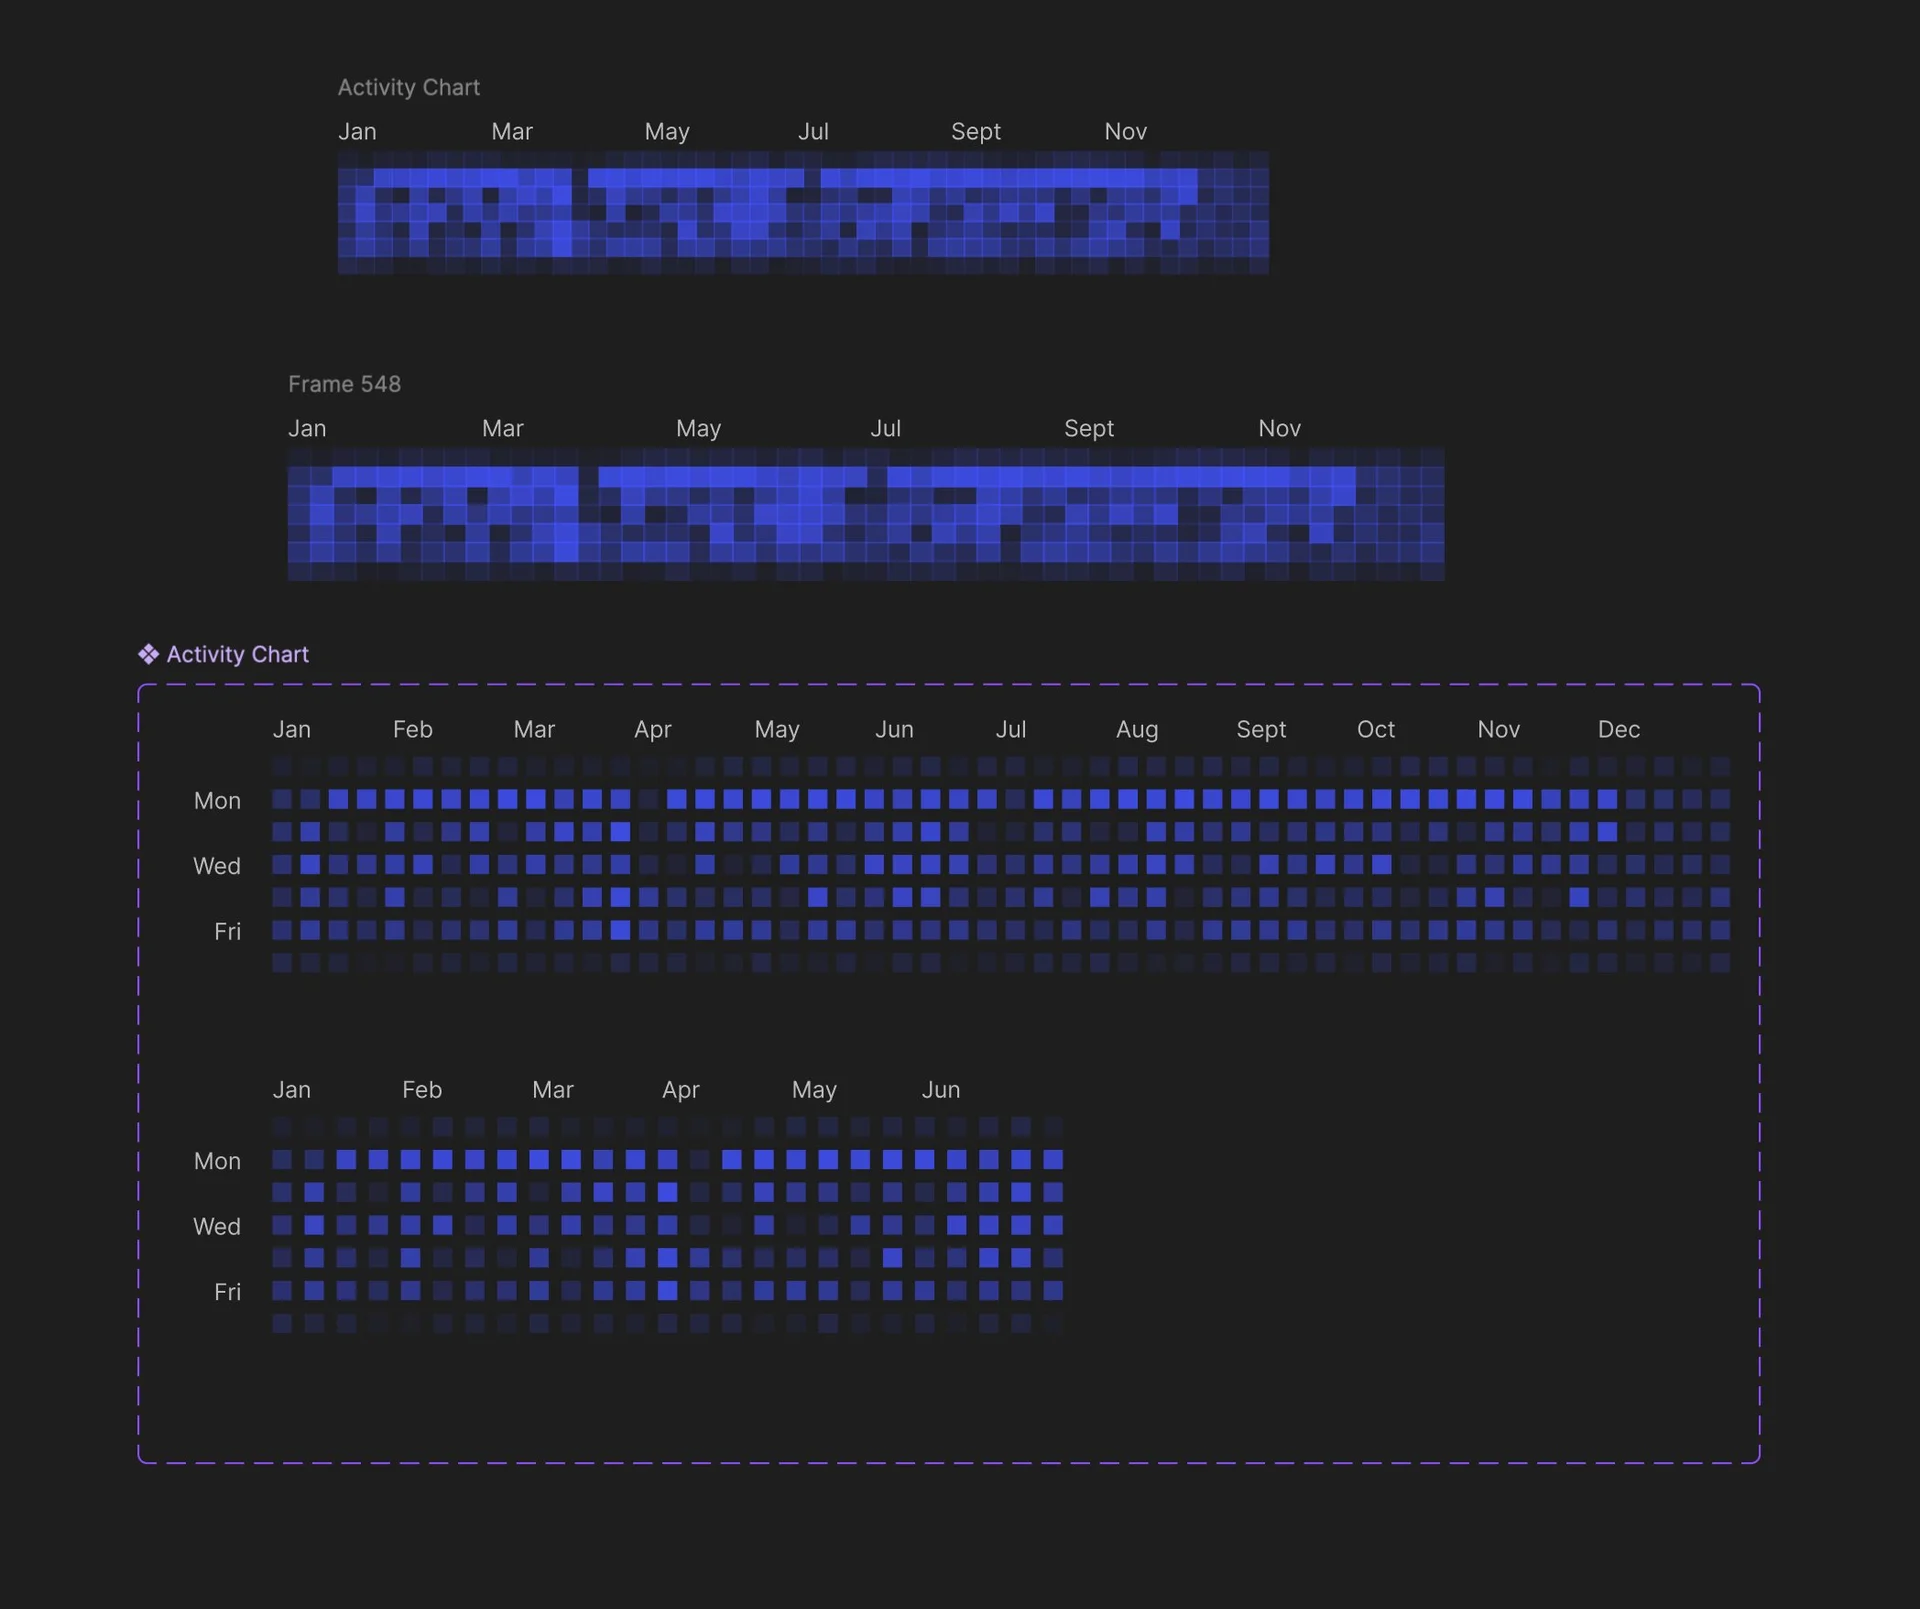
I do love me a GitHub ActivityChart. Still one of my favorite features of Basedash.
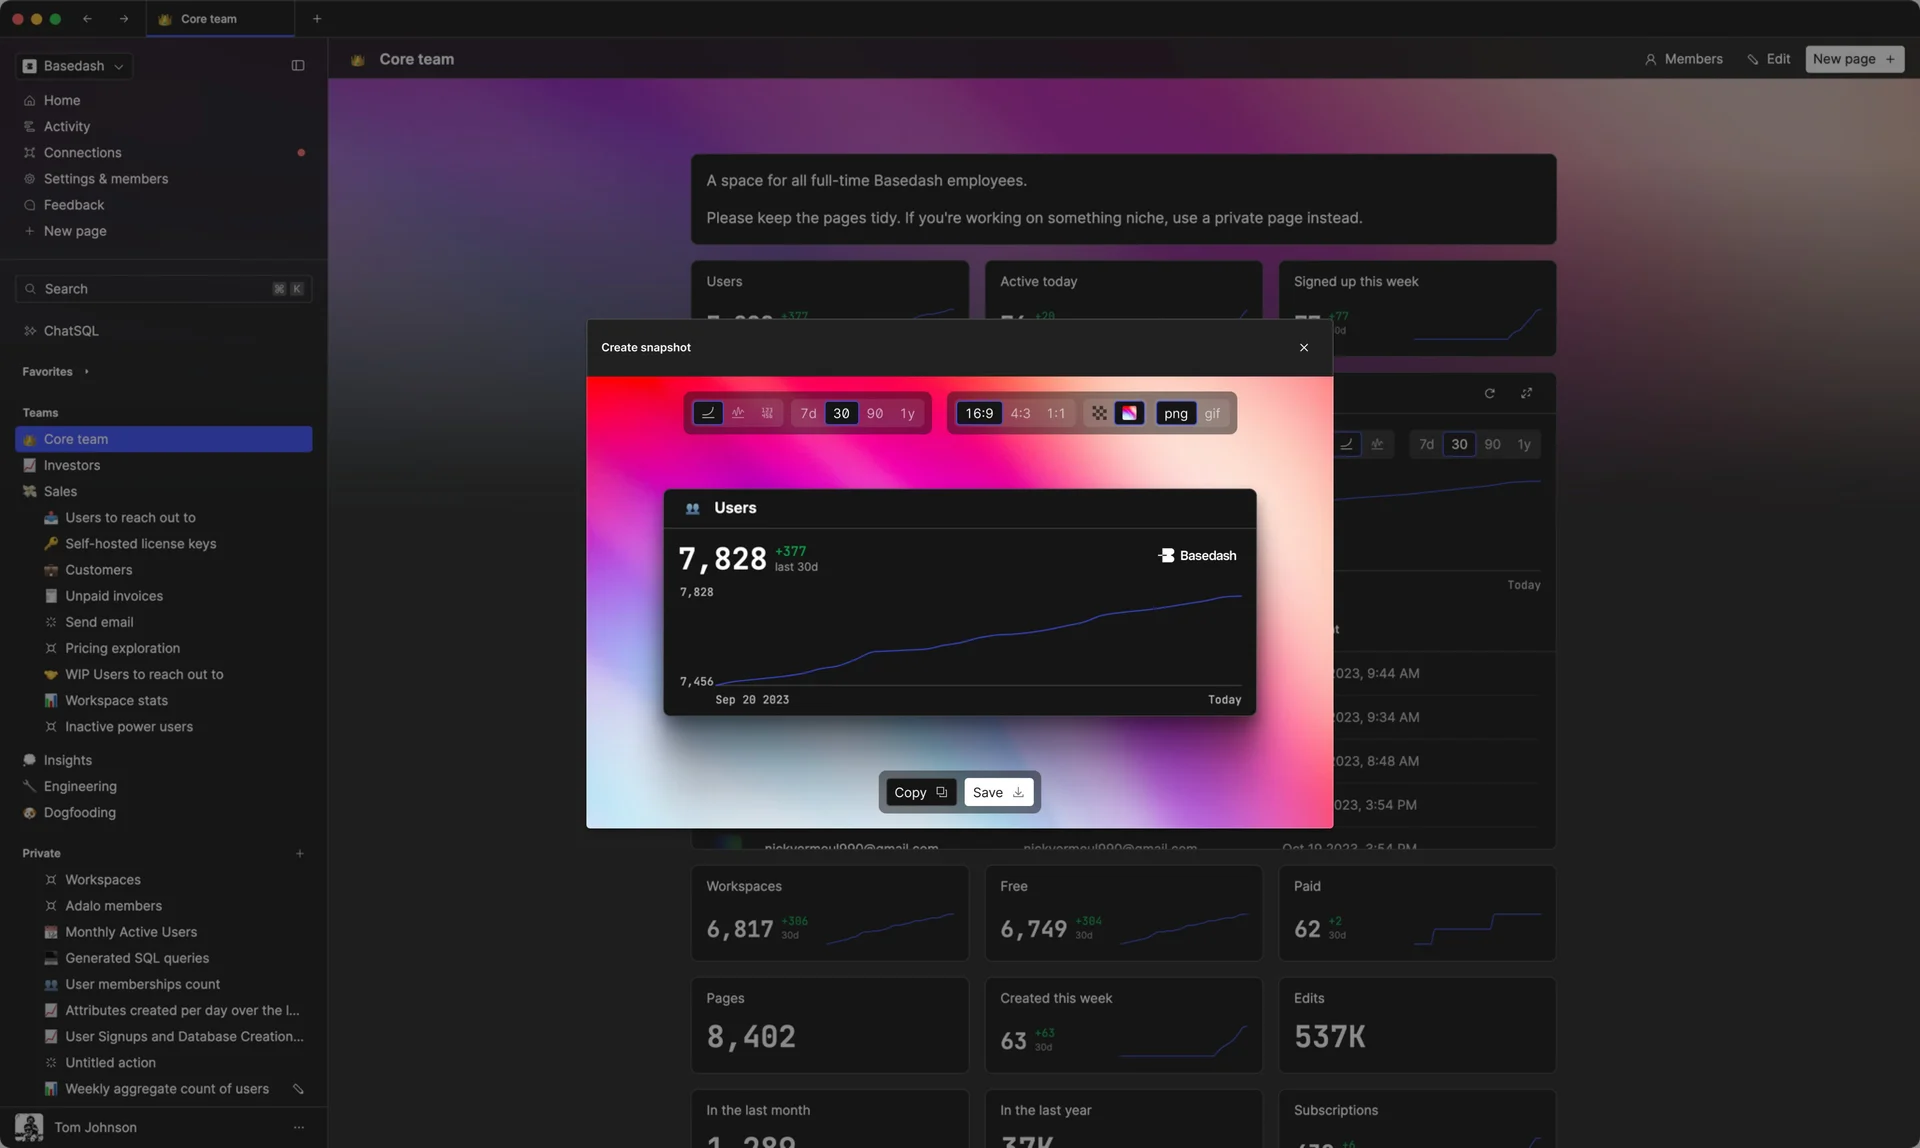
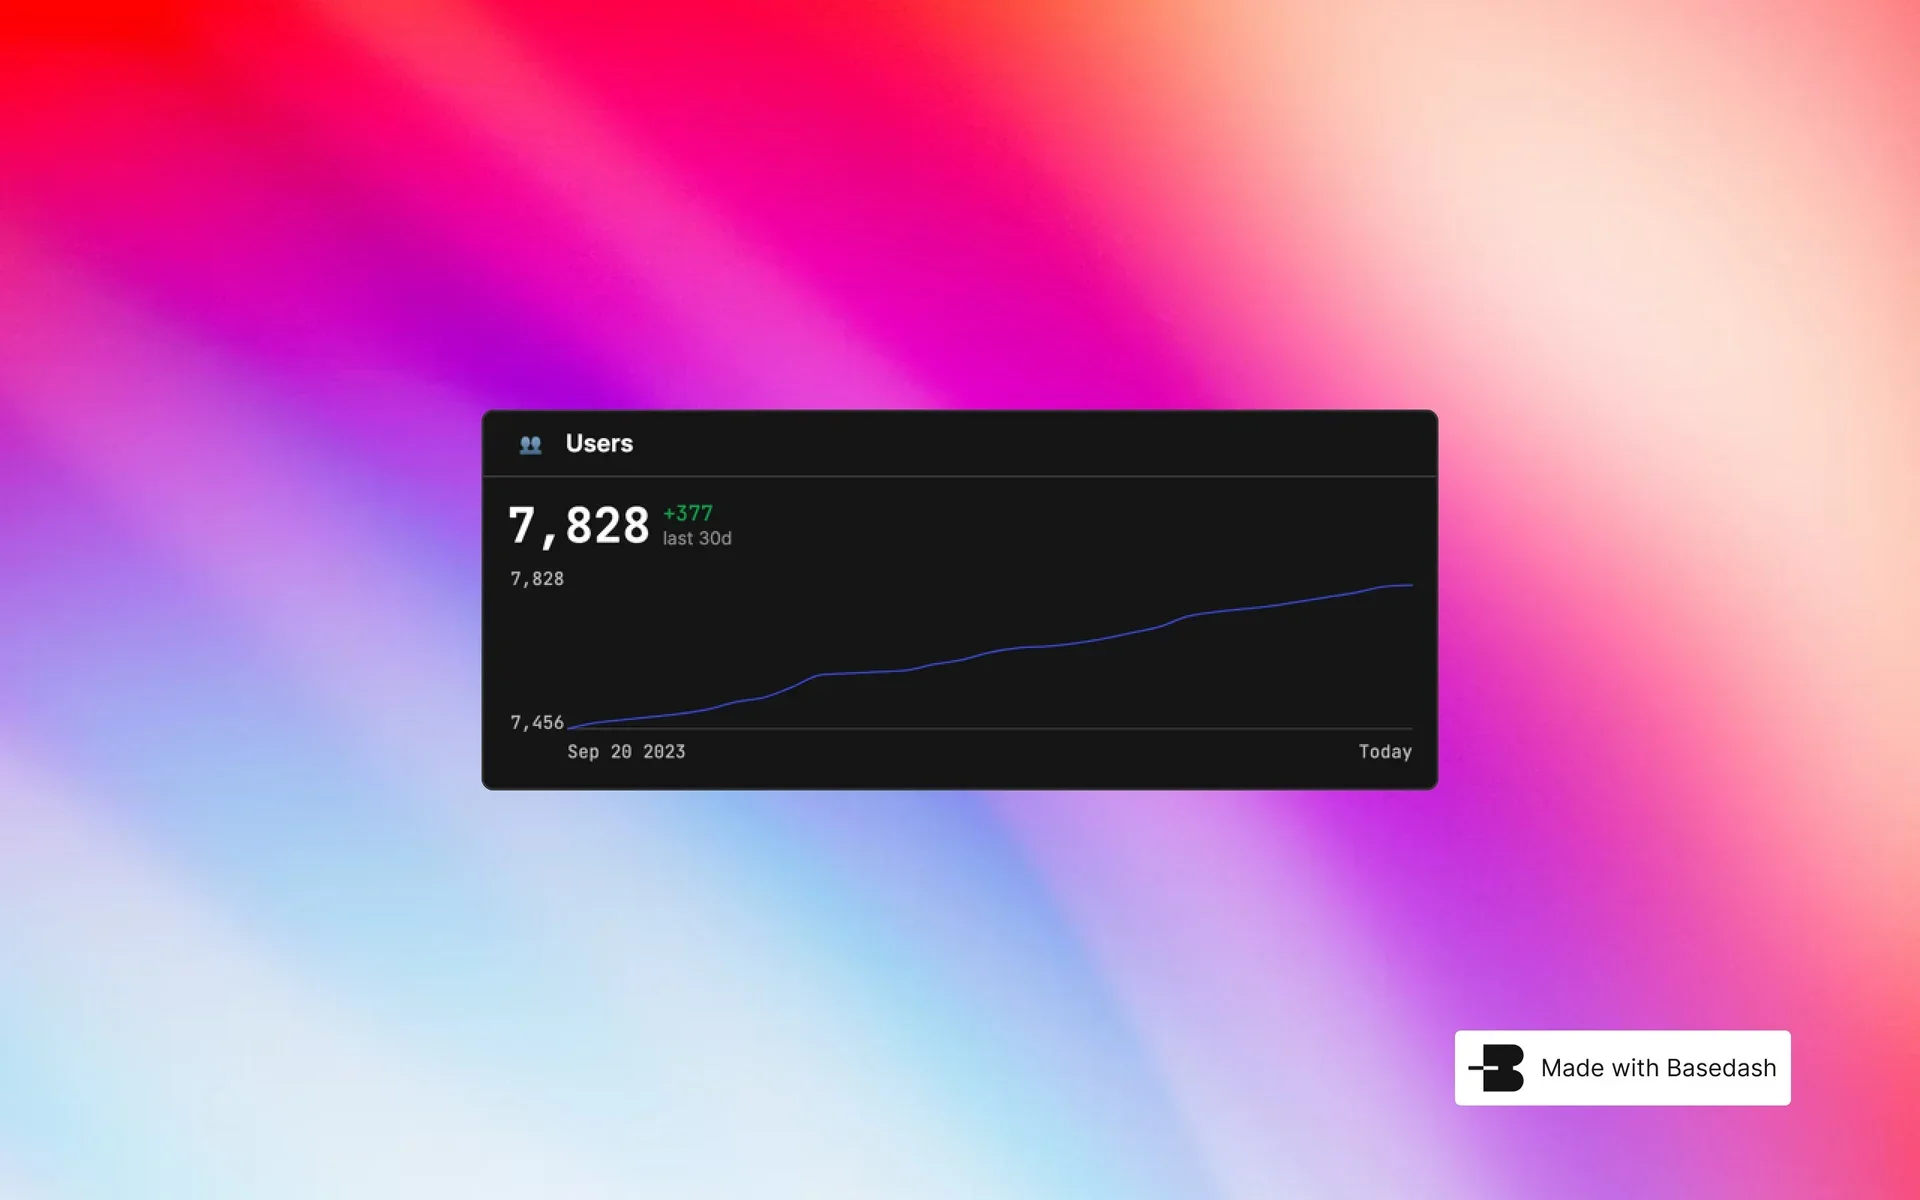
Snapshots, snapshots, snapshots.
I am convinced that this is still a great feature.
This was right before we decided to pivot. We saw some users sharing charts of Basedash on social media and blurring out elements of the data. MRR, user growth, yada, yada, yada. You just can't share everything publicly, but you can share the line itself. (also why is the blue line so low contrast cmon Tom).
So the idea here would be that you would select any chart that was created within Basedash, and then when you share it, you're able to remove or obscure parts of it for use on social media or somewhere where you can't expose sensitive data. The idea would be that you would also create a micro-website for that data. So that you get the benefit of not just a screenshot, but also a living, breathing version of the visualization for external sharing.
I still think this is a good idea.
Update banners, page editors, and more experiments
What even is this???
I know exactly what it is. We had an issue where people would not click the update banner. So my solution was: let's make it... more annoying? I guess?
I think I was inspired by other tools that make a really compelling update banner. The solution for this is just have the app update itself in the background. Don't bother me. Nobody cares about app updates if you don't tell them about it.
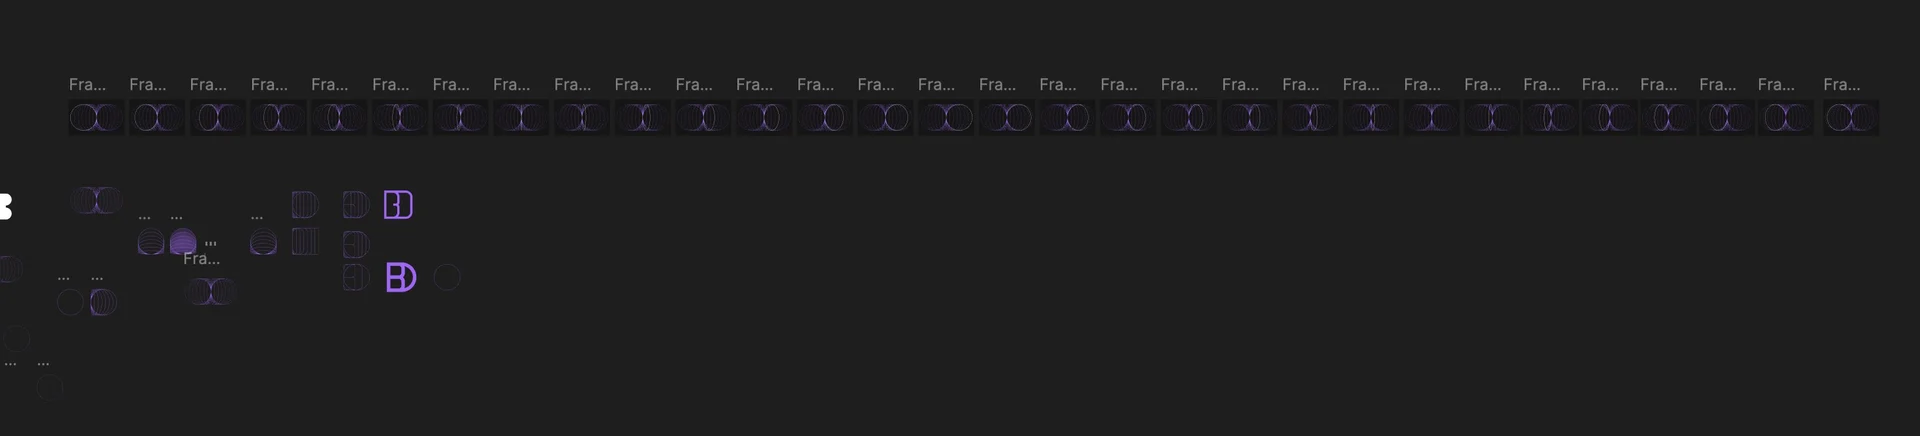
More frame-by-frame animations.
I've never been sure if this one is terrible or decent. I think terrible. Again, thank goodness for shaders.
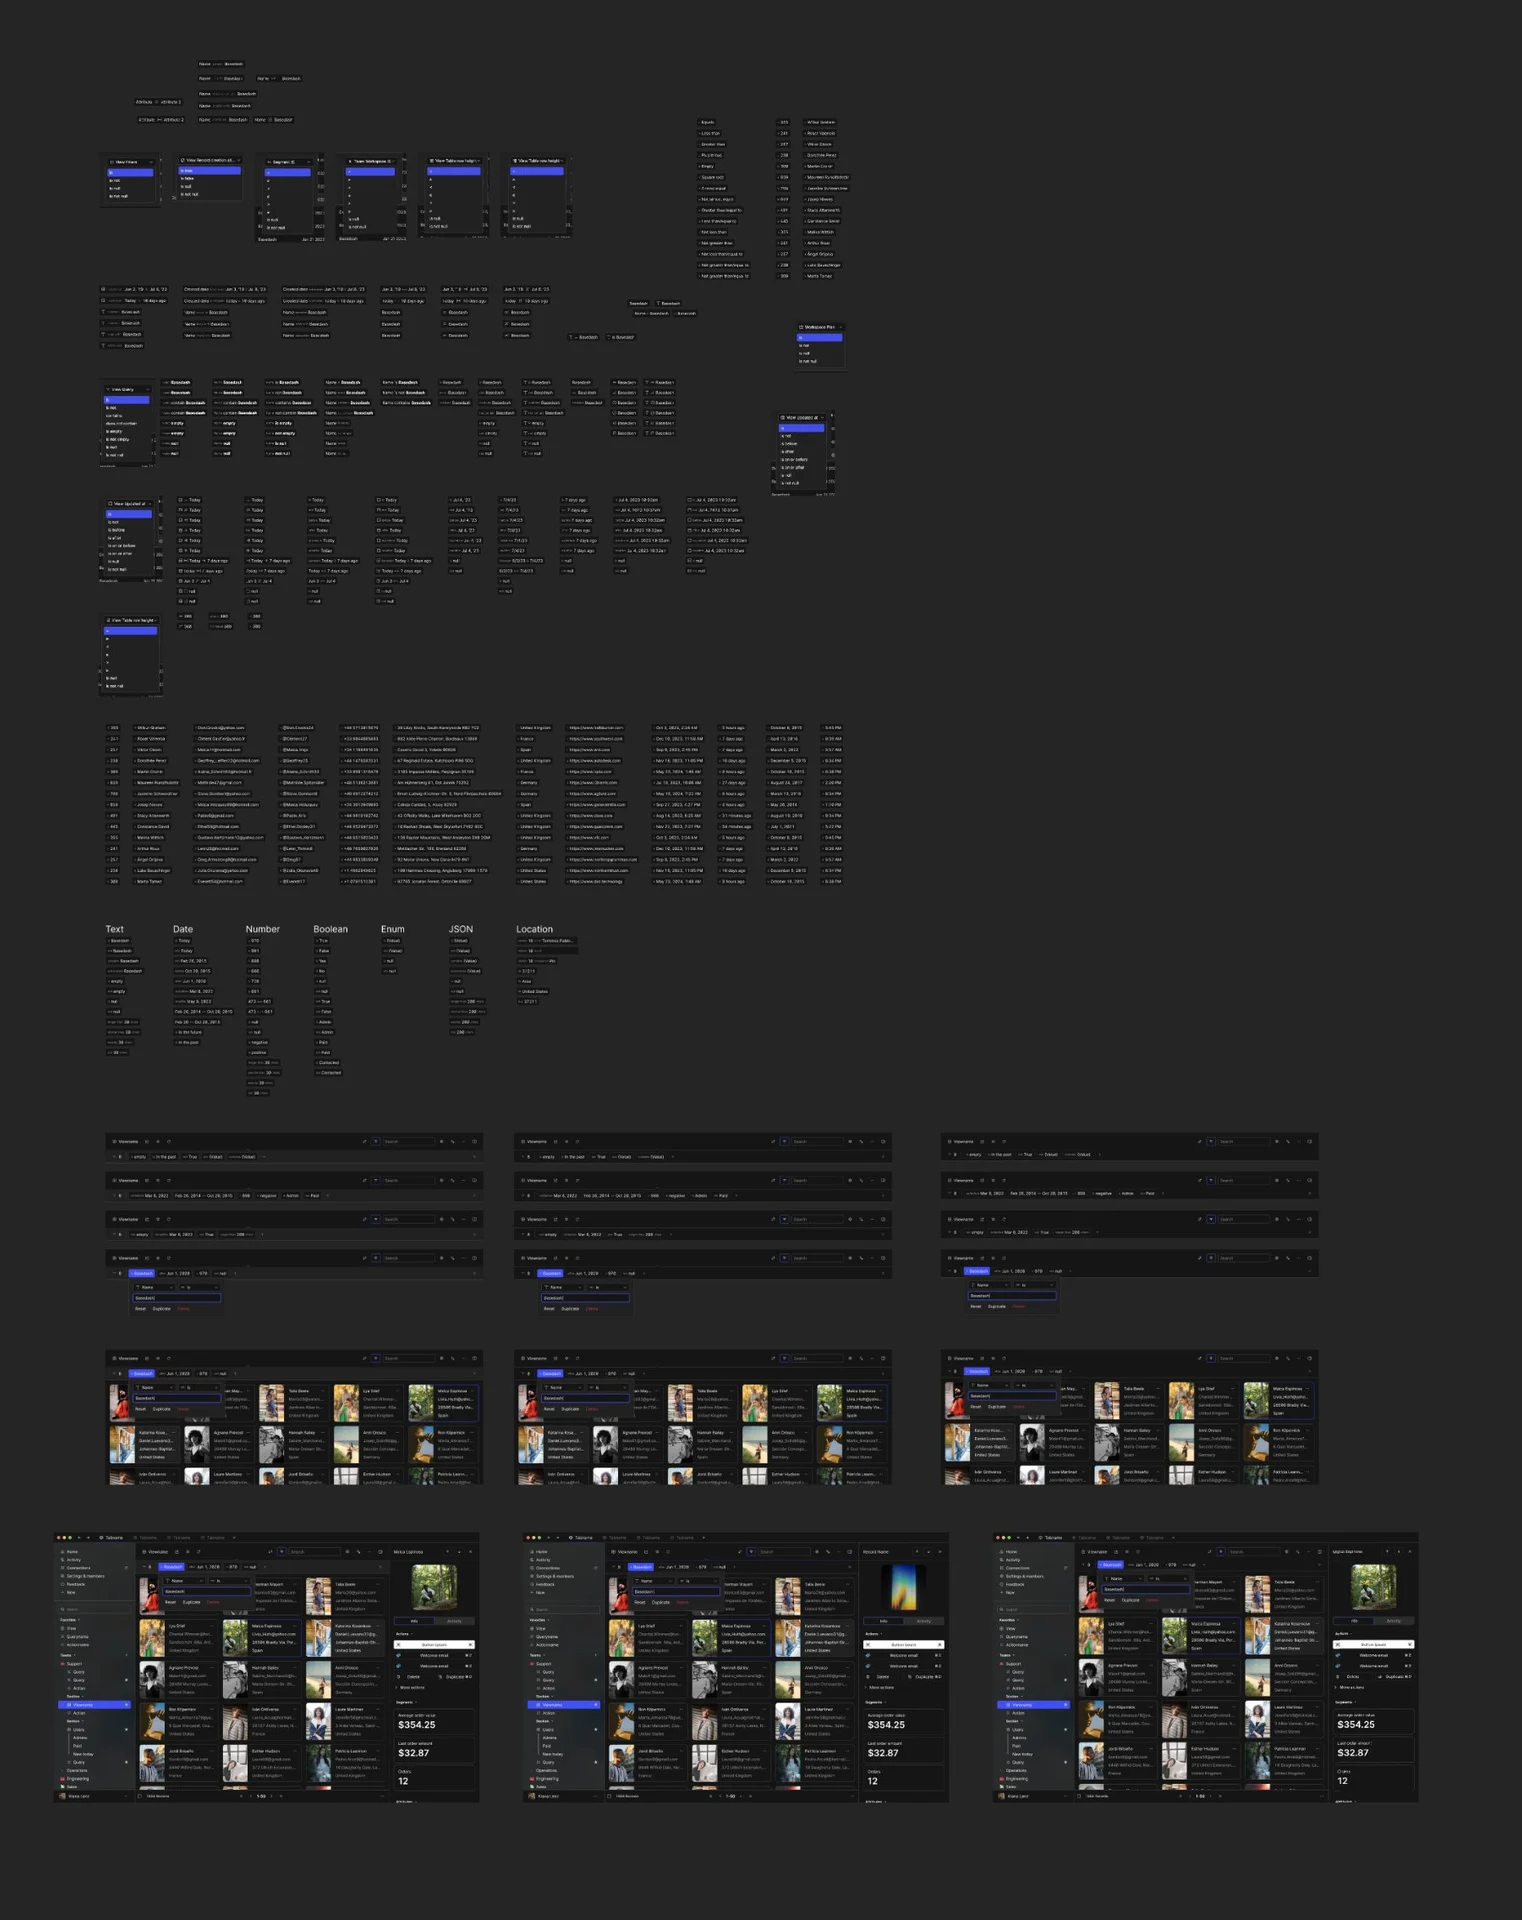
So much filter exploration.
Filters are so hard.
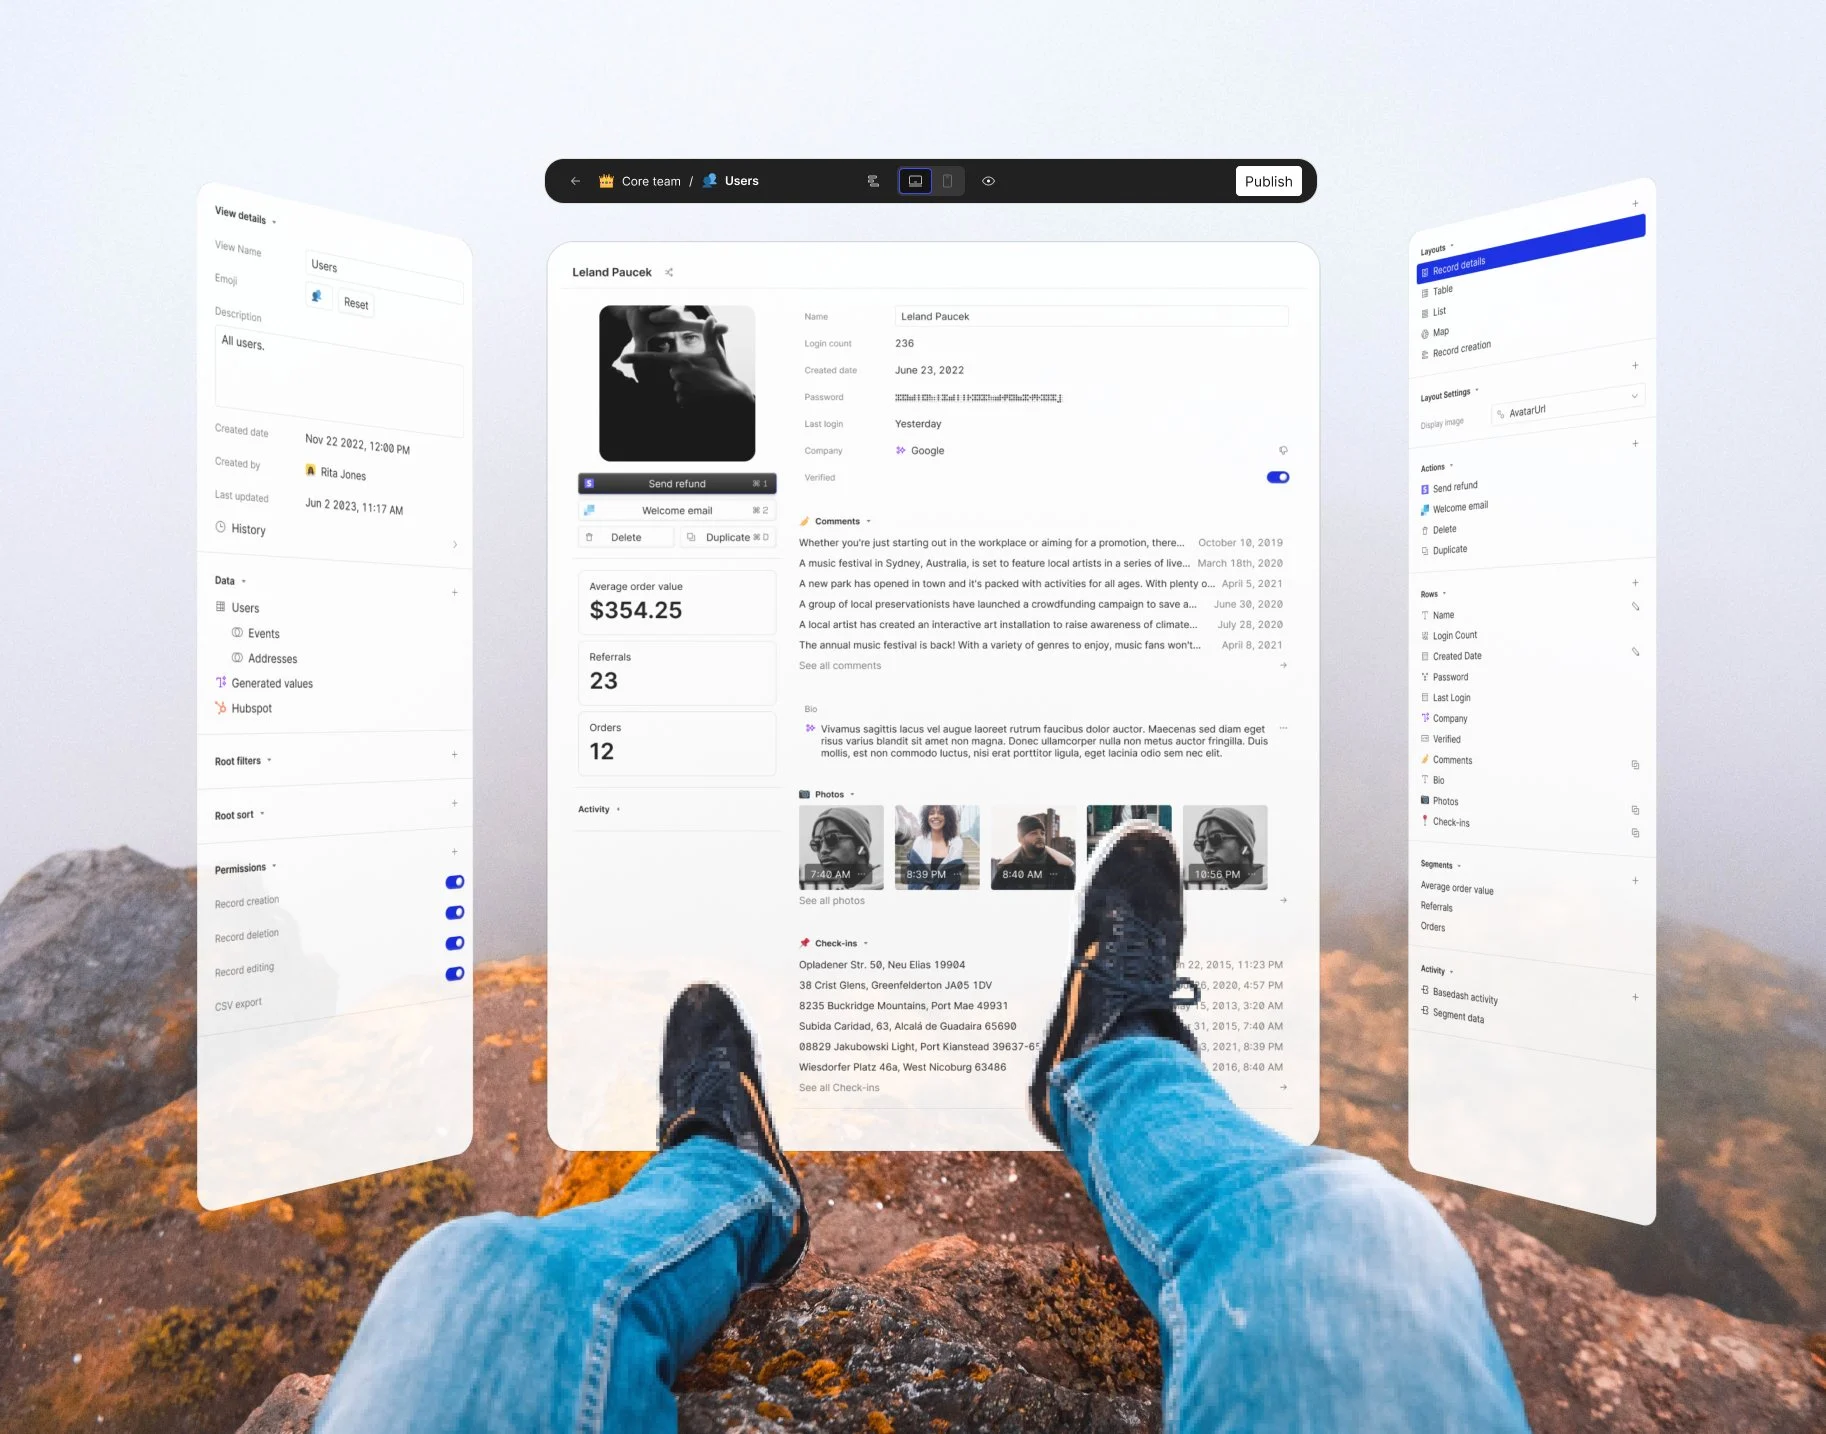
Another direction from the admin-panel explorations.
The 2023 page editor.
A Kanban view was another direction I explored.
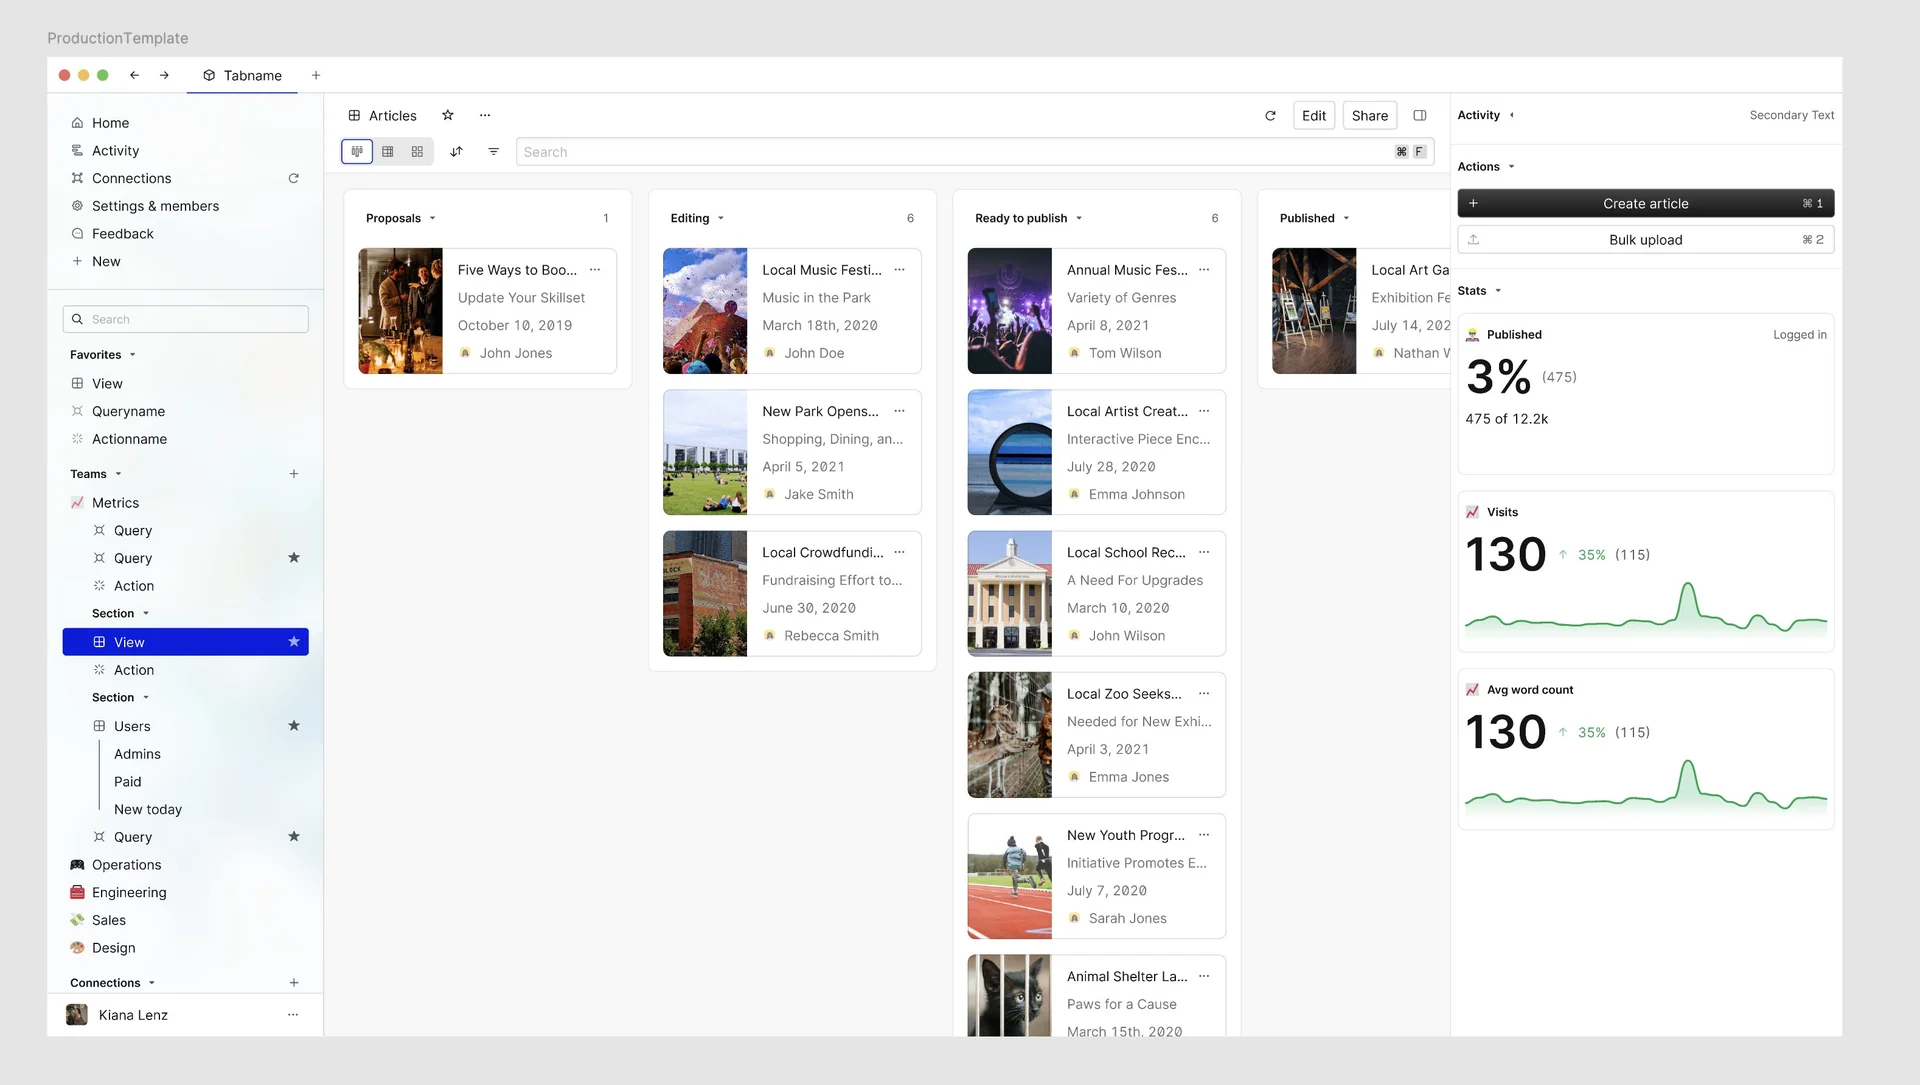
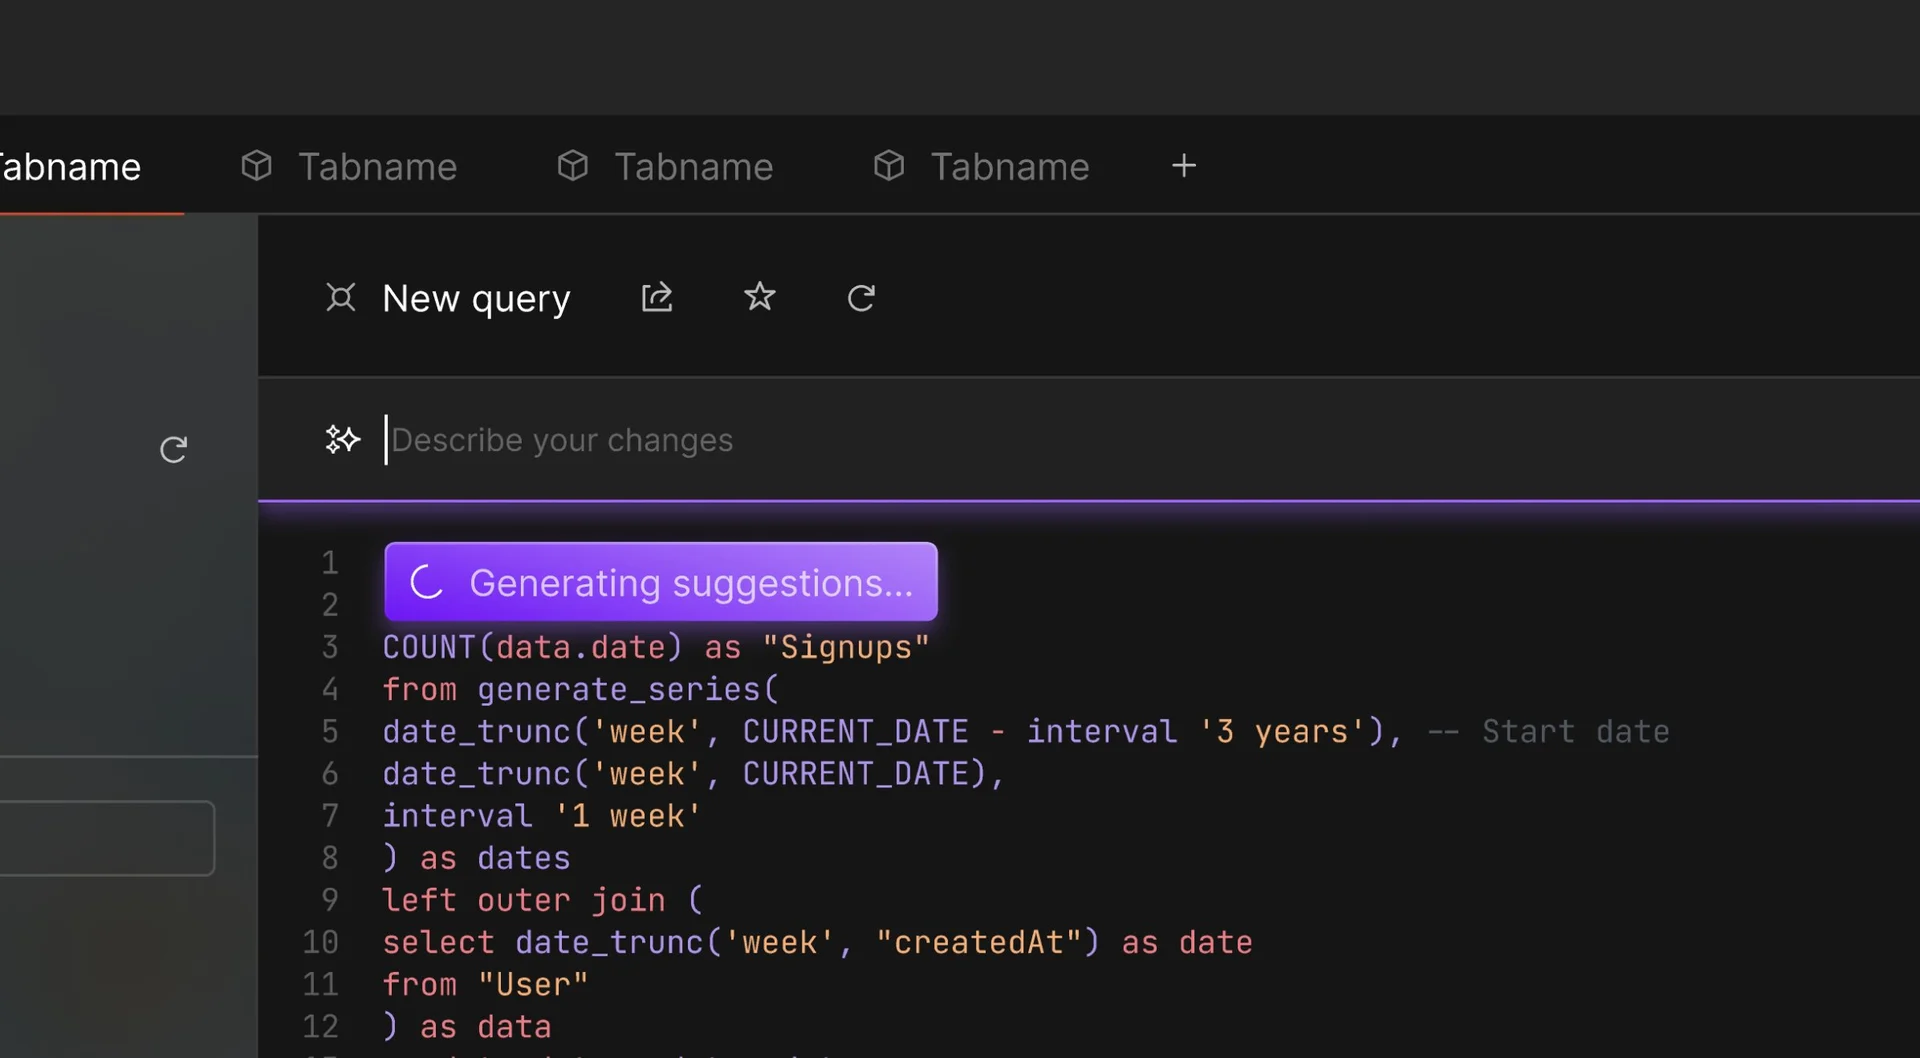
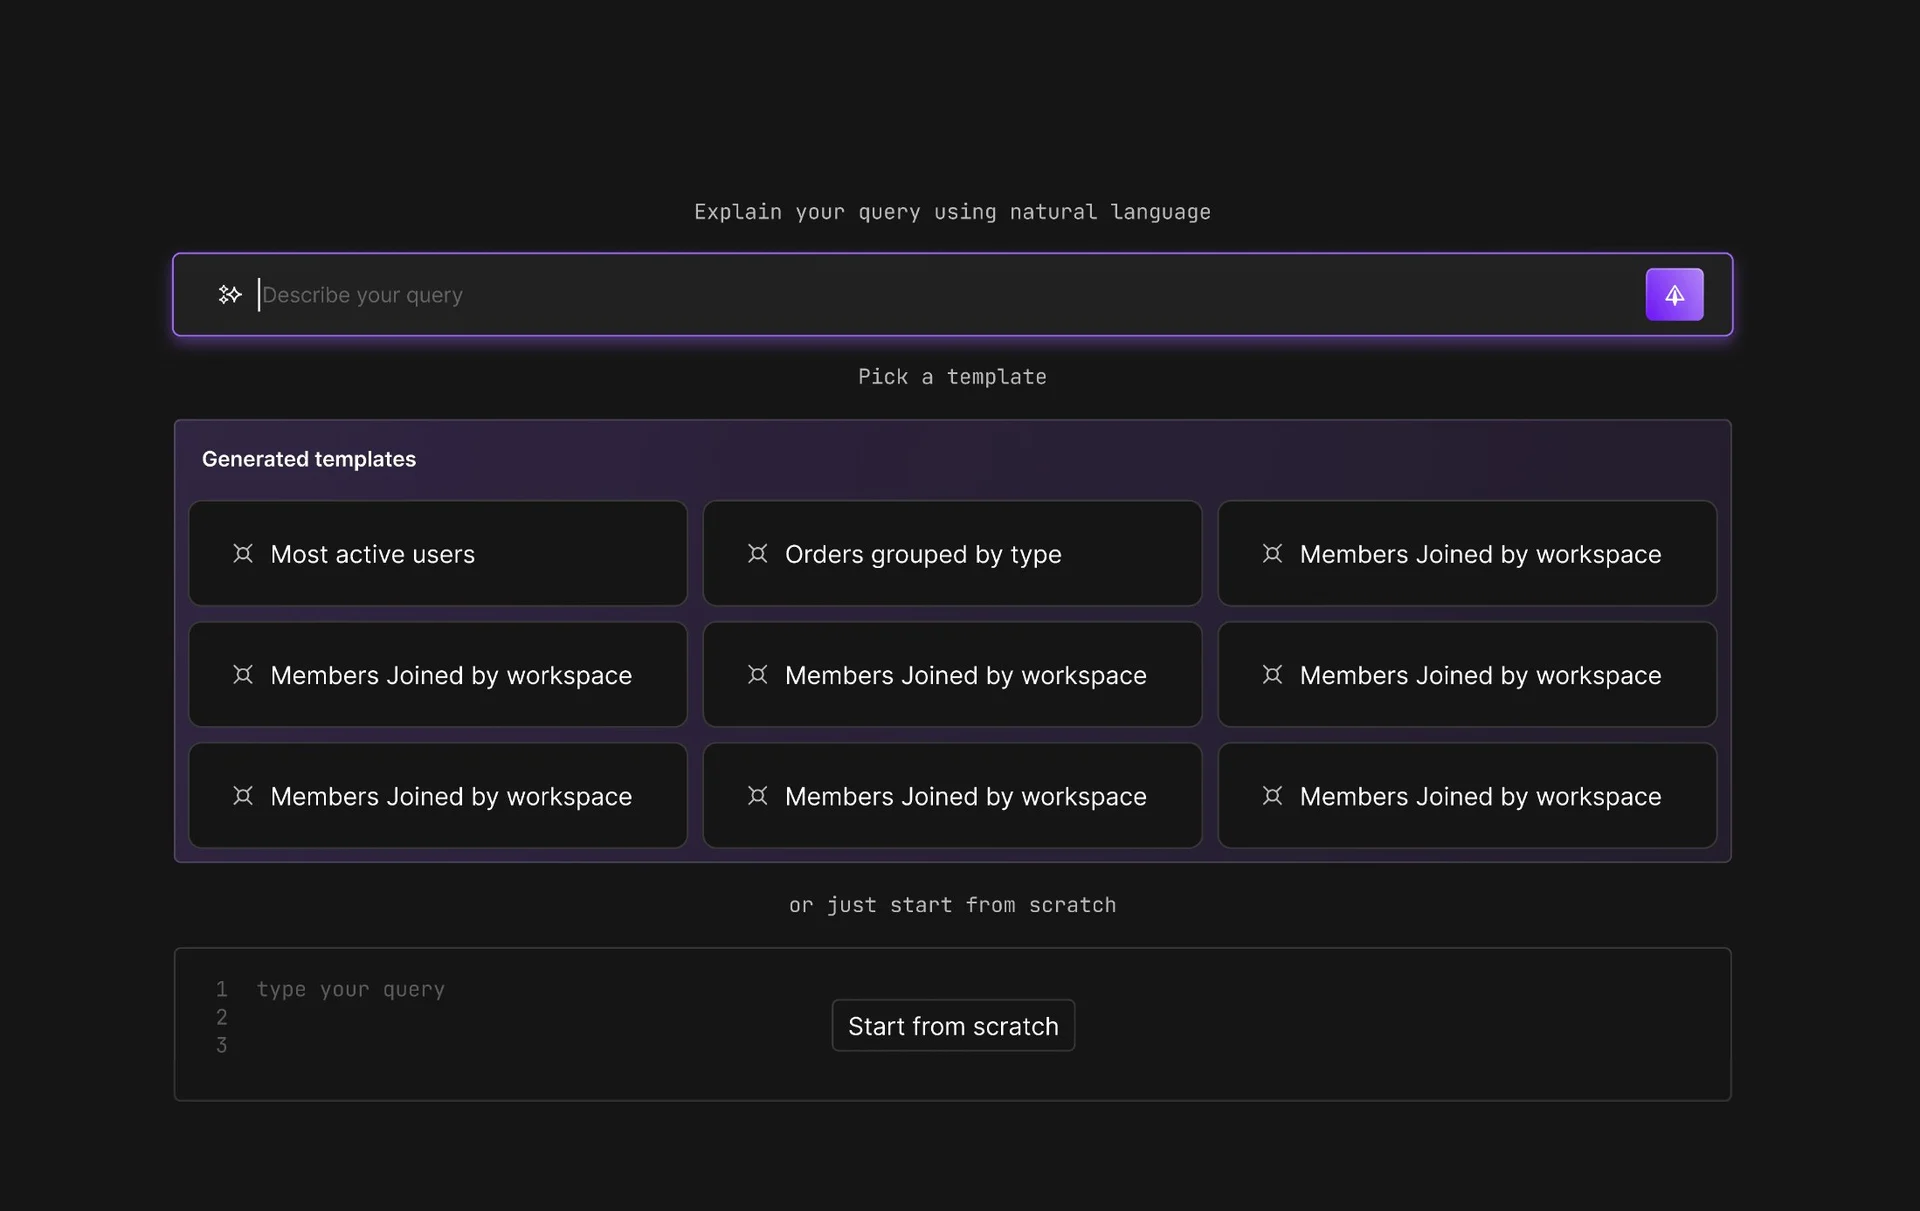
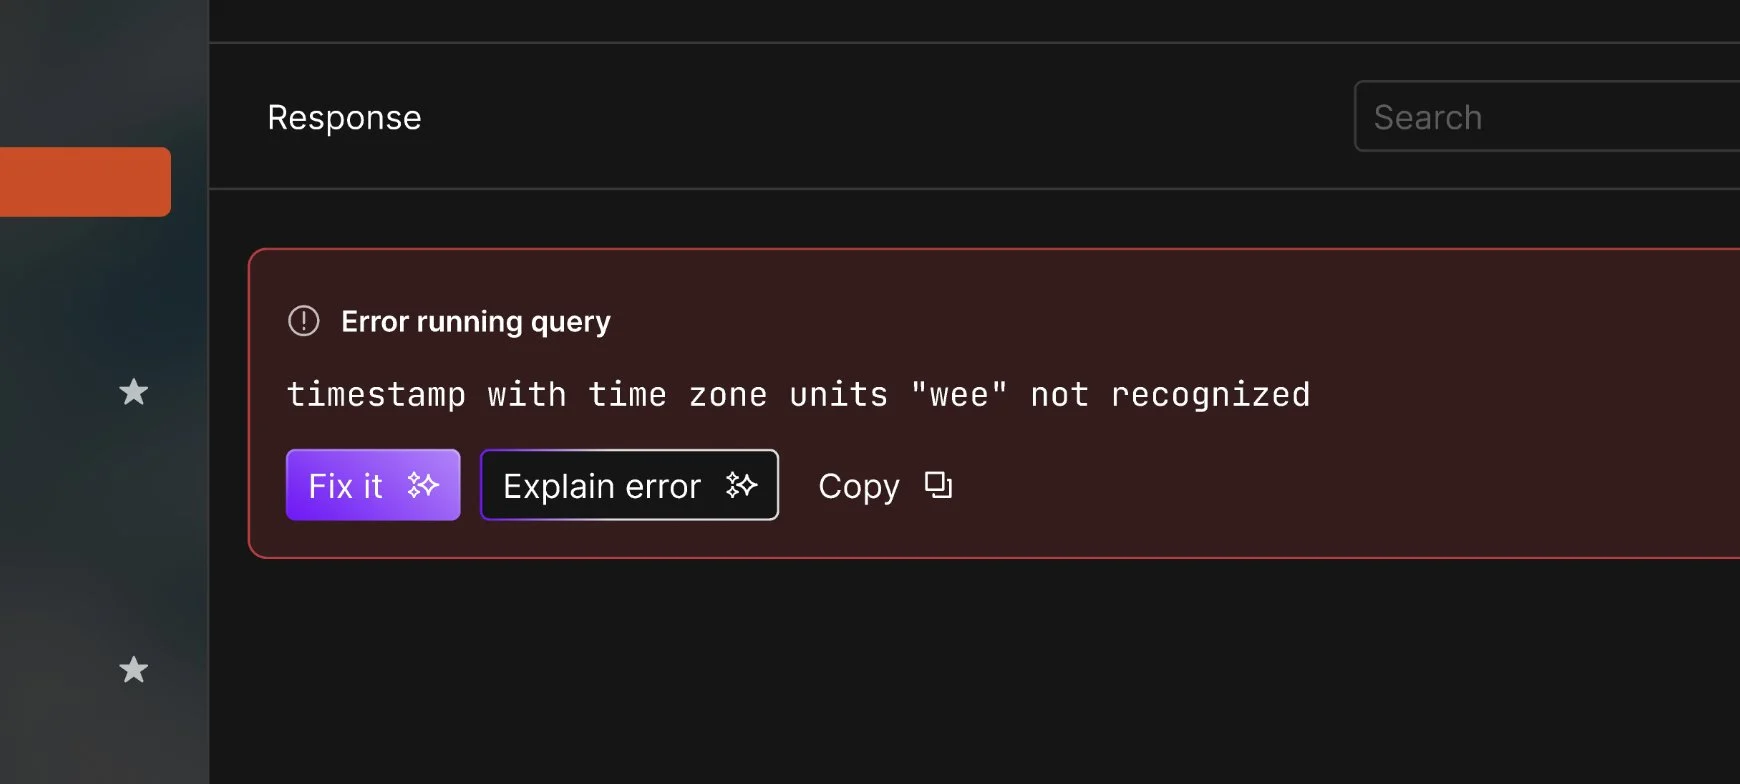
So many different explorations around how AI would work and where it would live.
Vector dithering experiments.
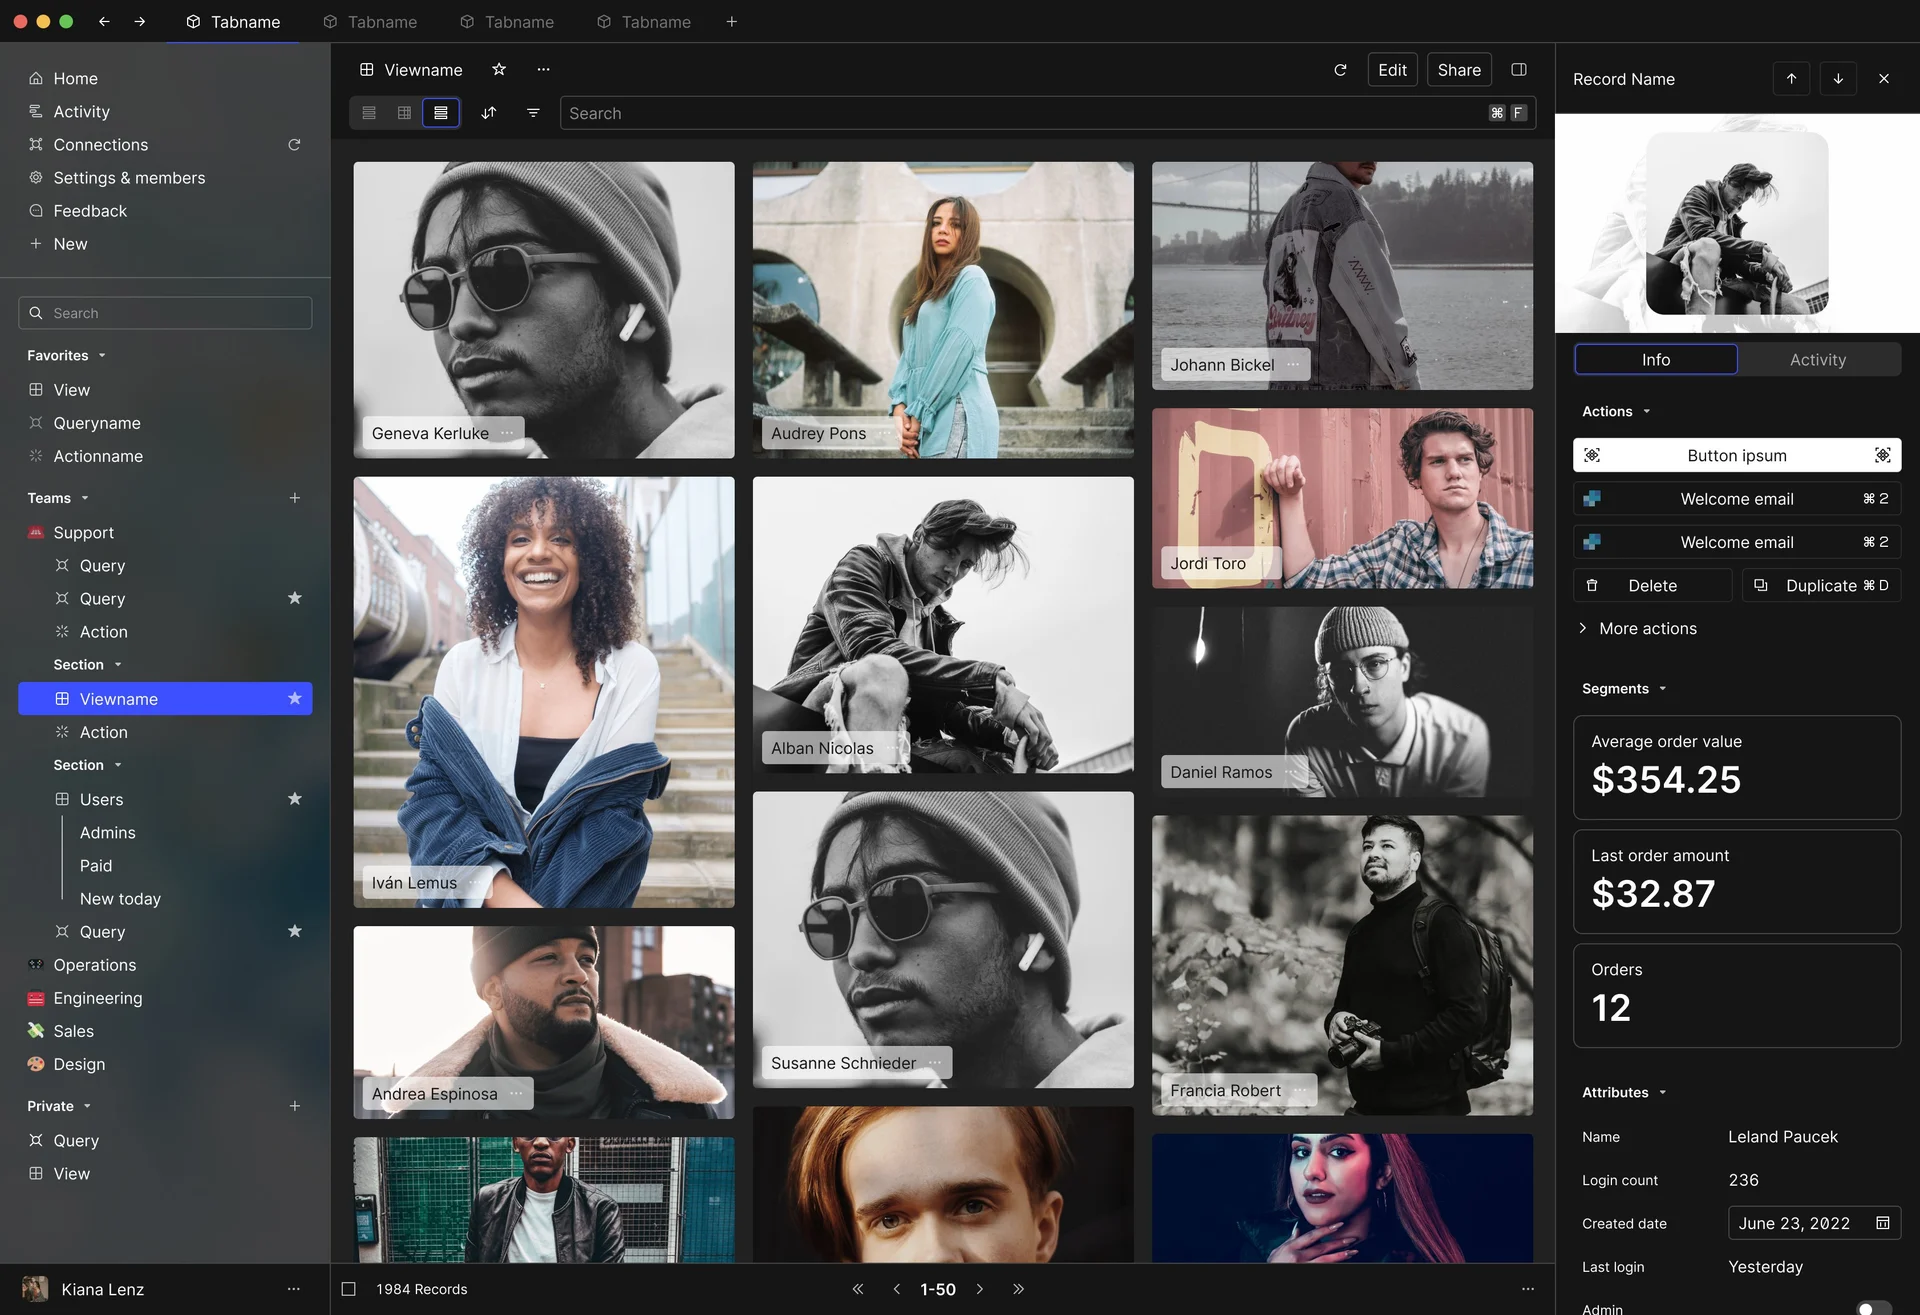
A masonry layout experiment.
Searching for product-market fit
Hey this is cool stuff! I remember being super excited about this idea.
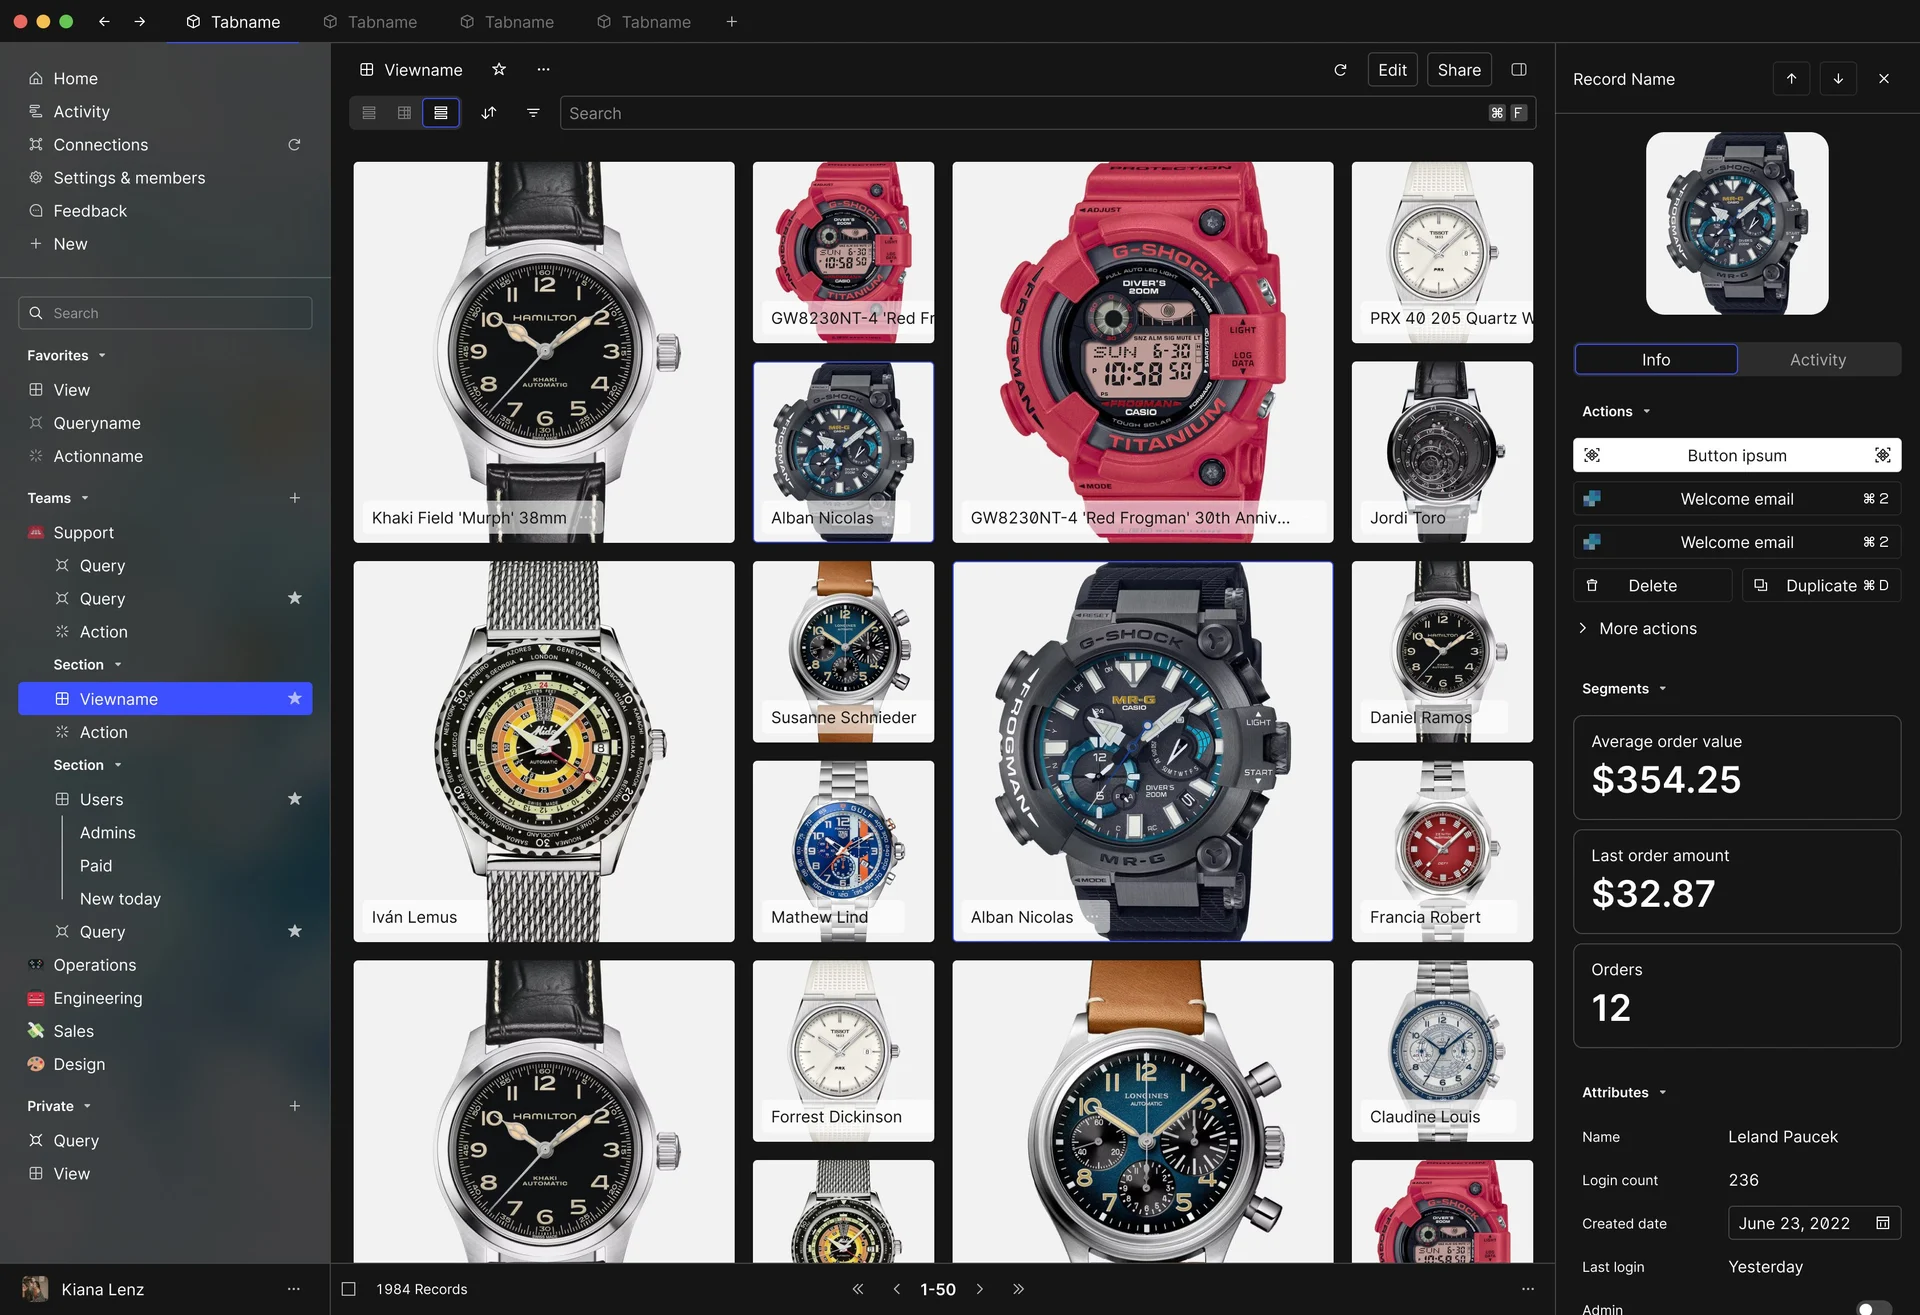
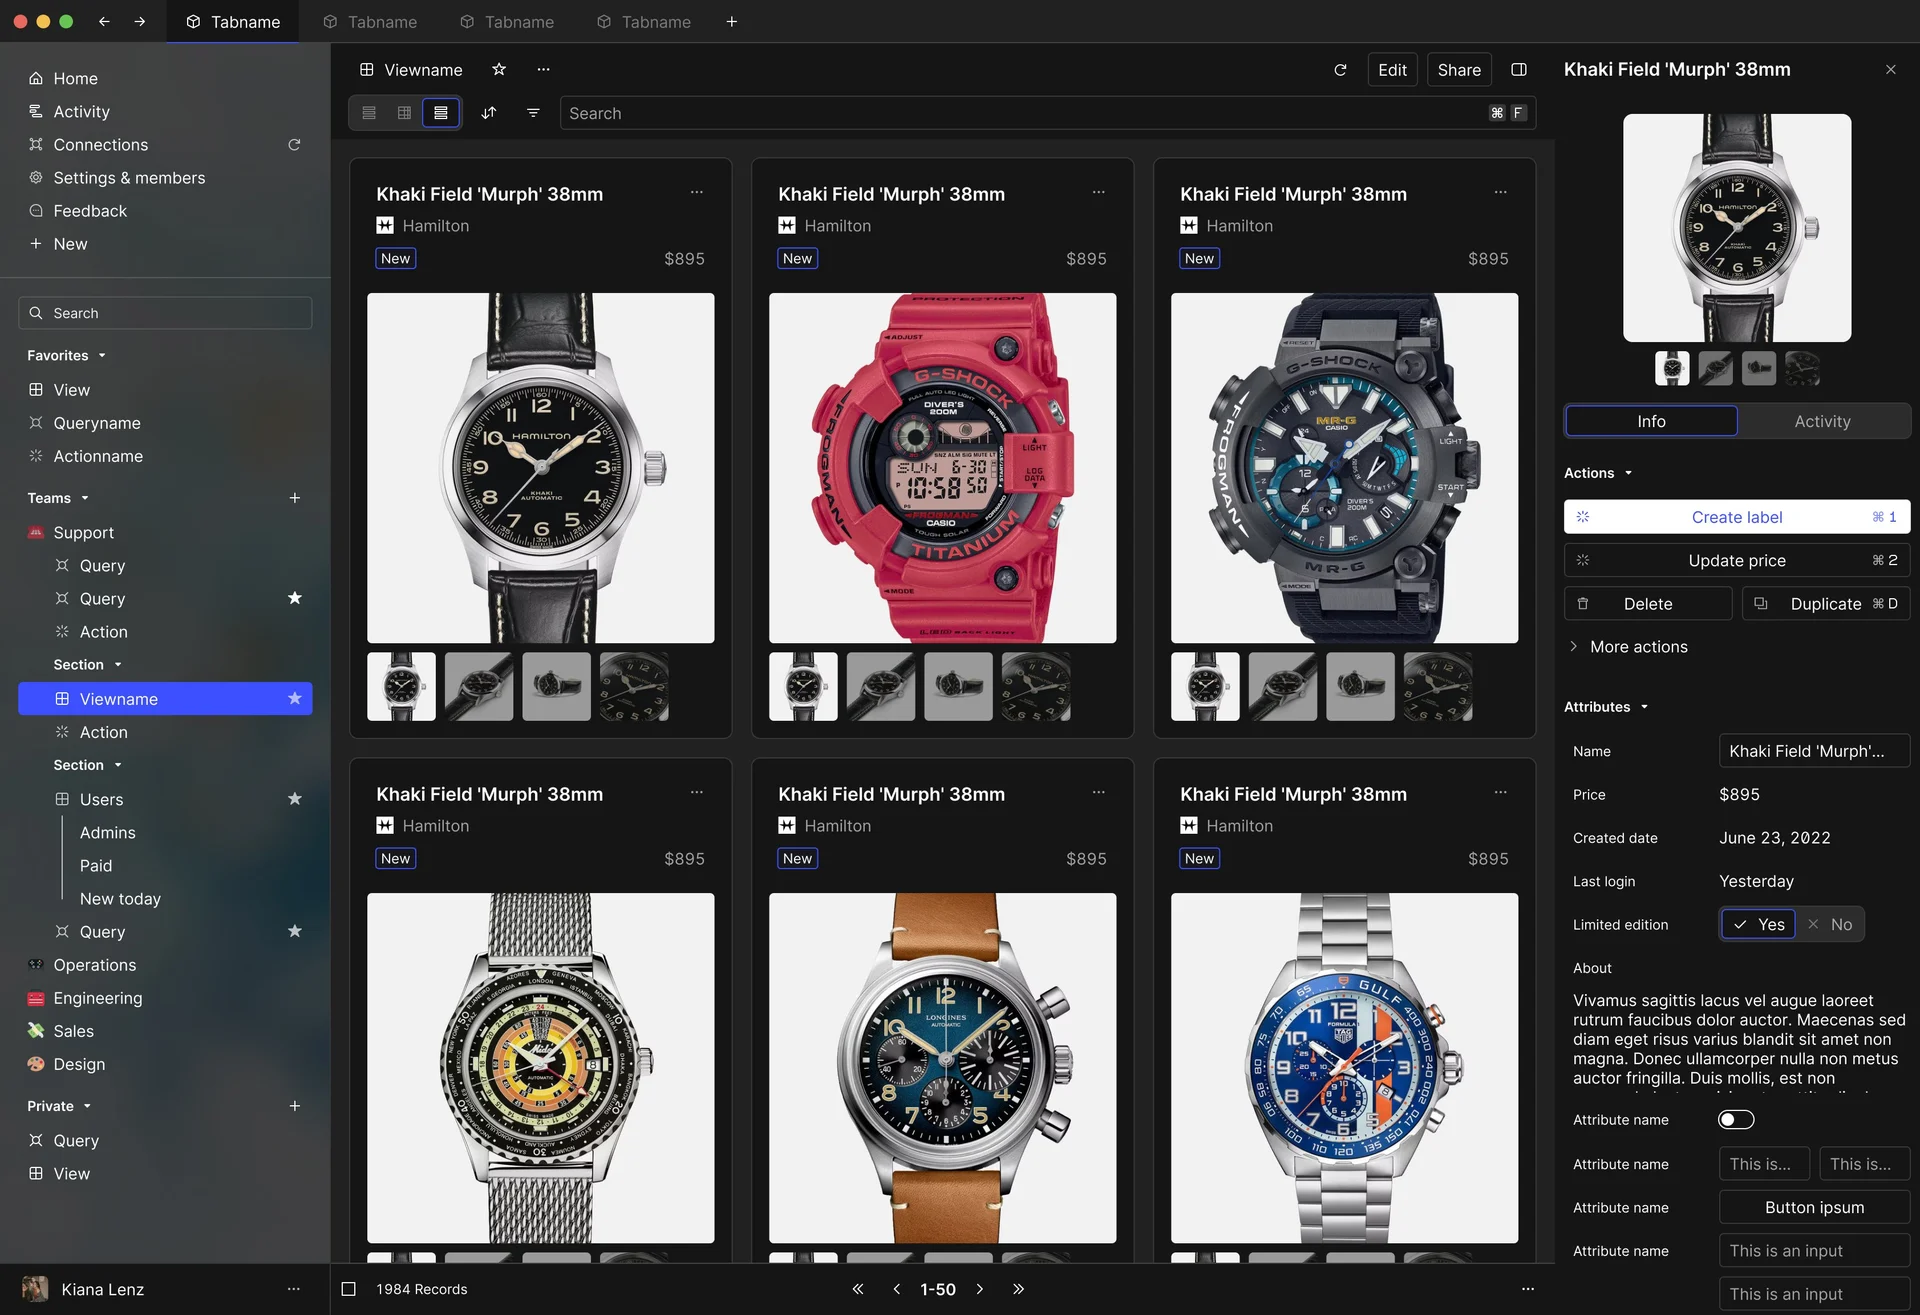
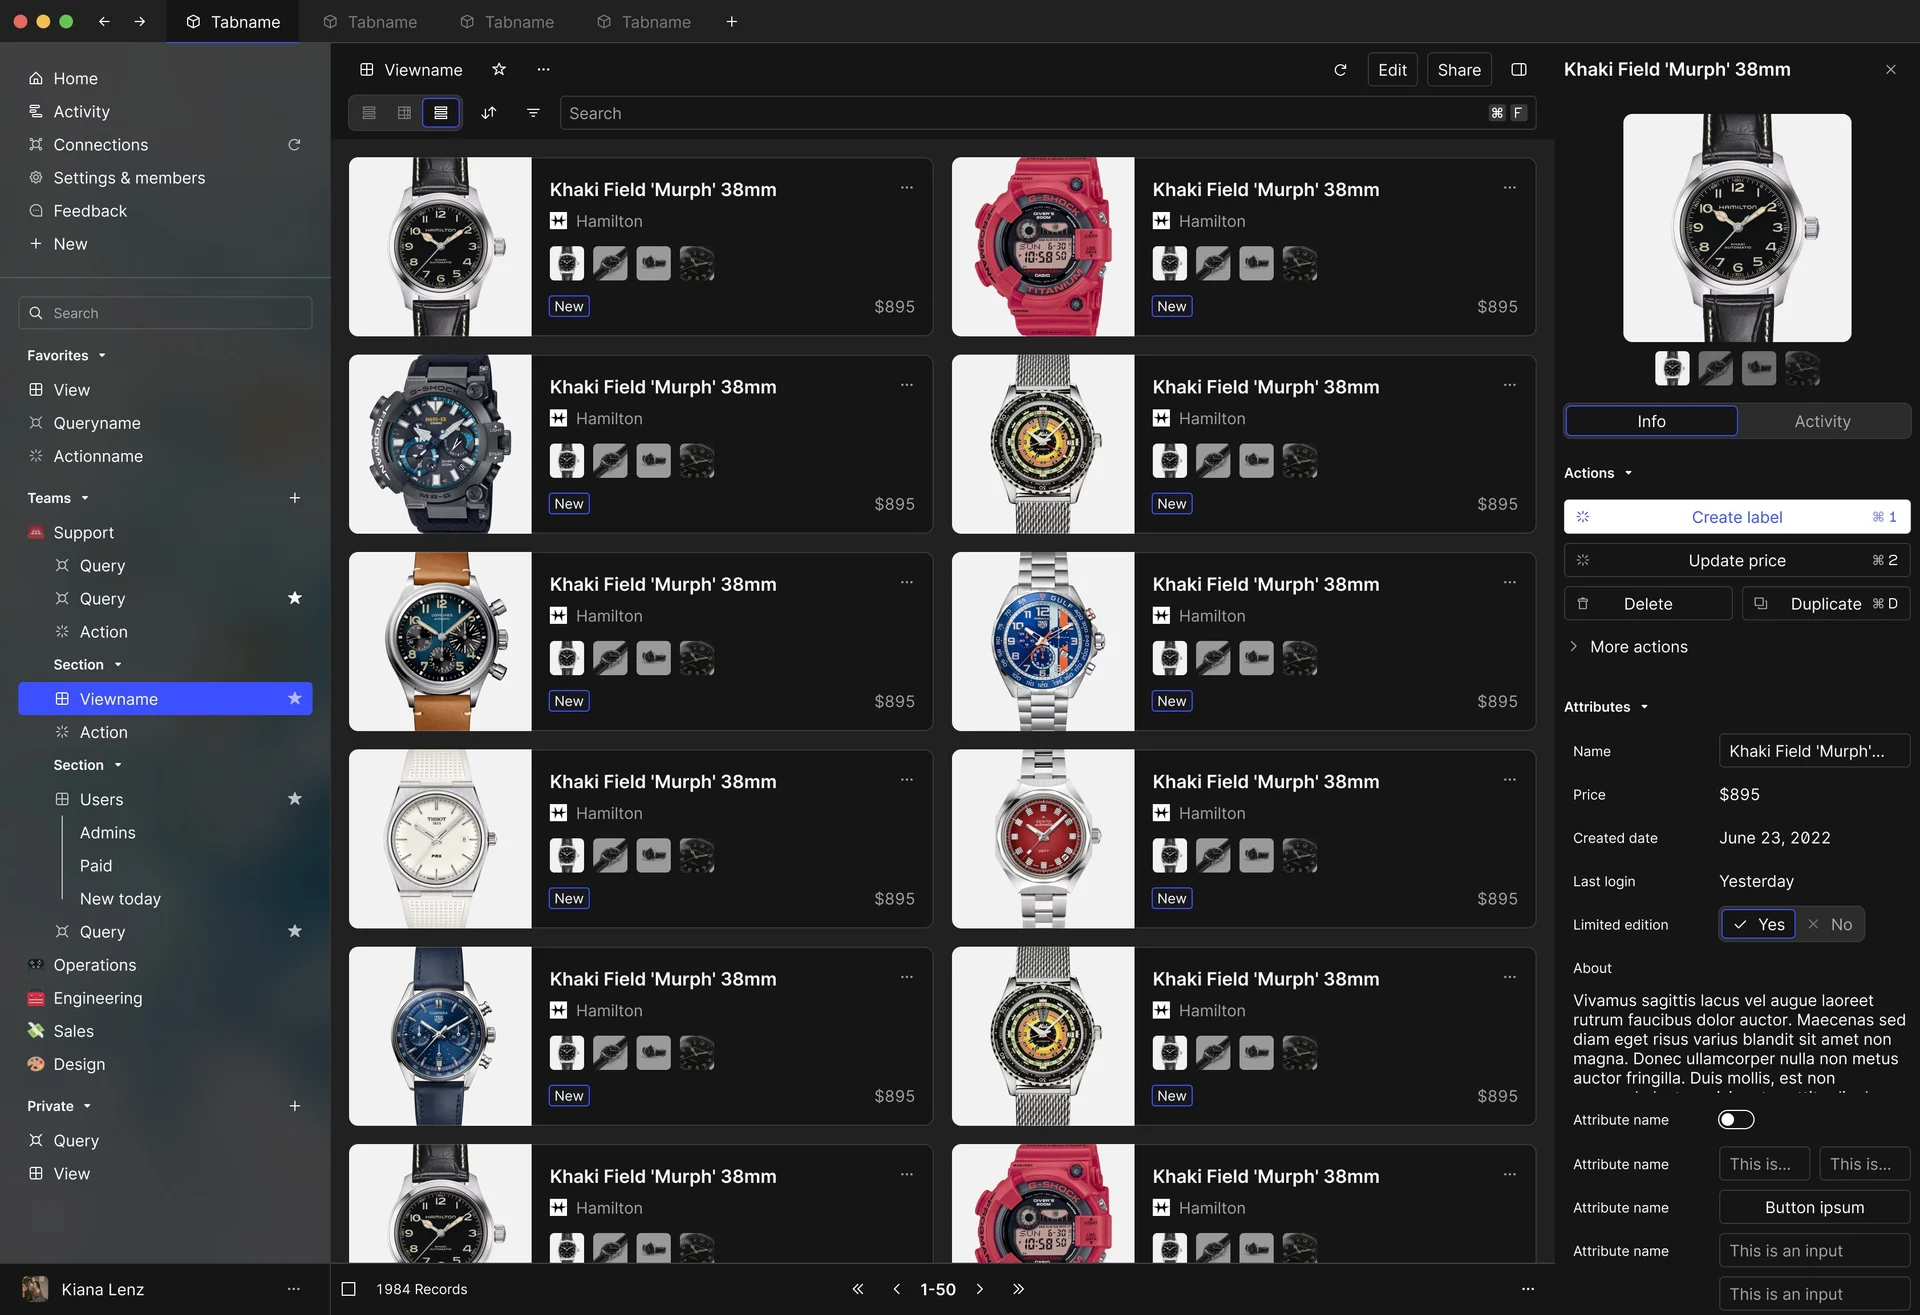
My rationale was that there's a ton of e-commerce stores, and a lot of them use SQL databases, so we could build layouts that were purpose-built for managing inventory.
I have a close friend who is working at @Hodinkee at the time, so I went all in on watches as the placeholder content. These are legitimately actually decent ideas... I've bashed a few of my past things that I've shared, but this is not bad. Well done, 2023 Tom. Well done.
If you've made it this far, you should know that we were trying literally anything to get PMF.
Anything.
CMS inventory management, user CRM, API Explorer, digital asset management....
Anything.
So many signals from users that yielded no growth, no results, no signups, but we had to try them.
The 2024 onboarding experiments
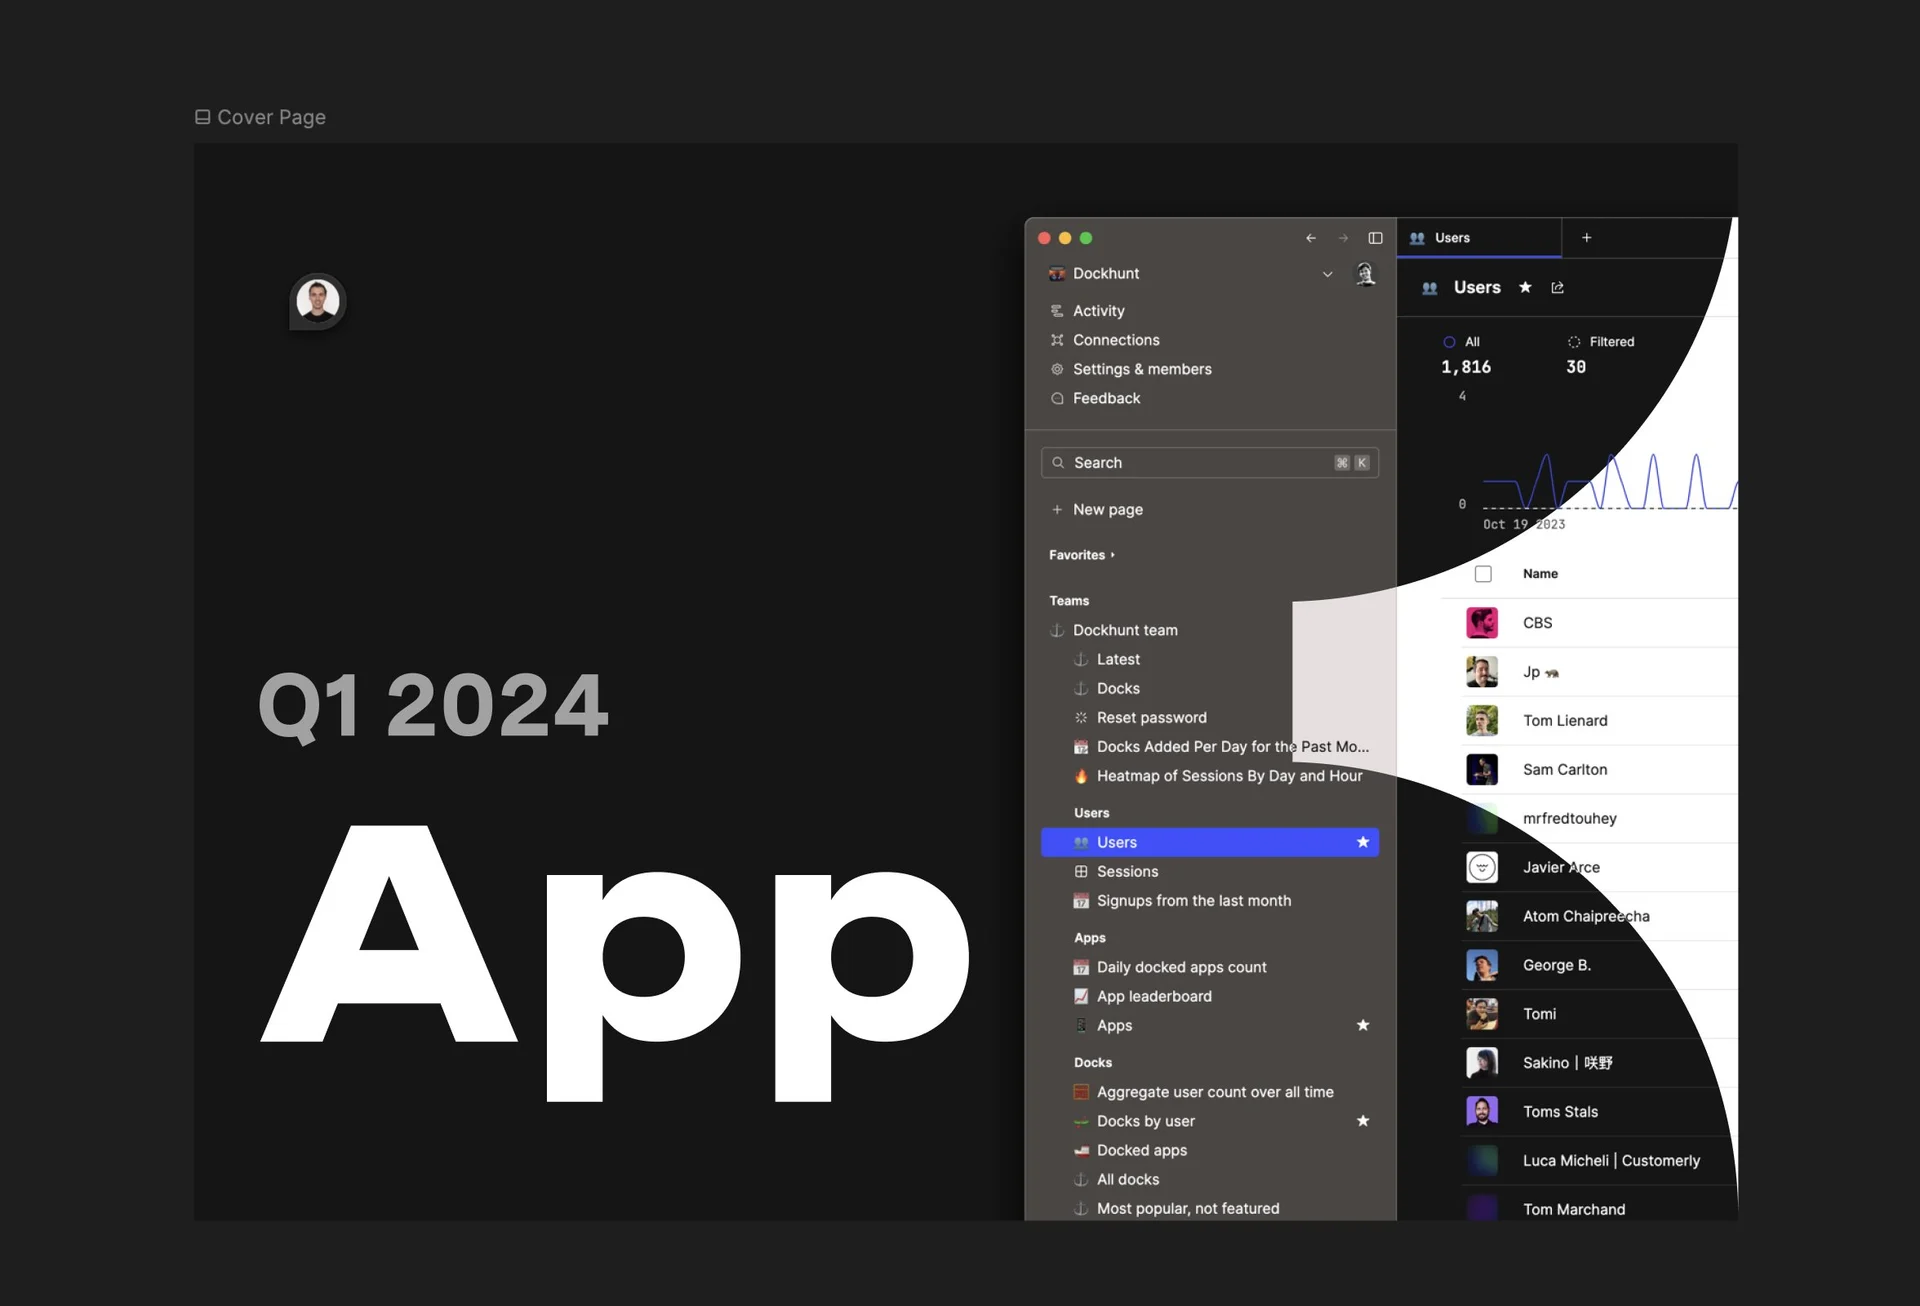
The 2024 design file sits near the boundary between the old admin product and the new charts product.
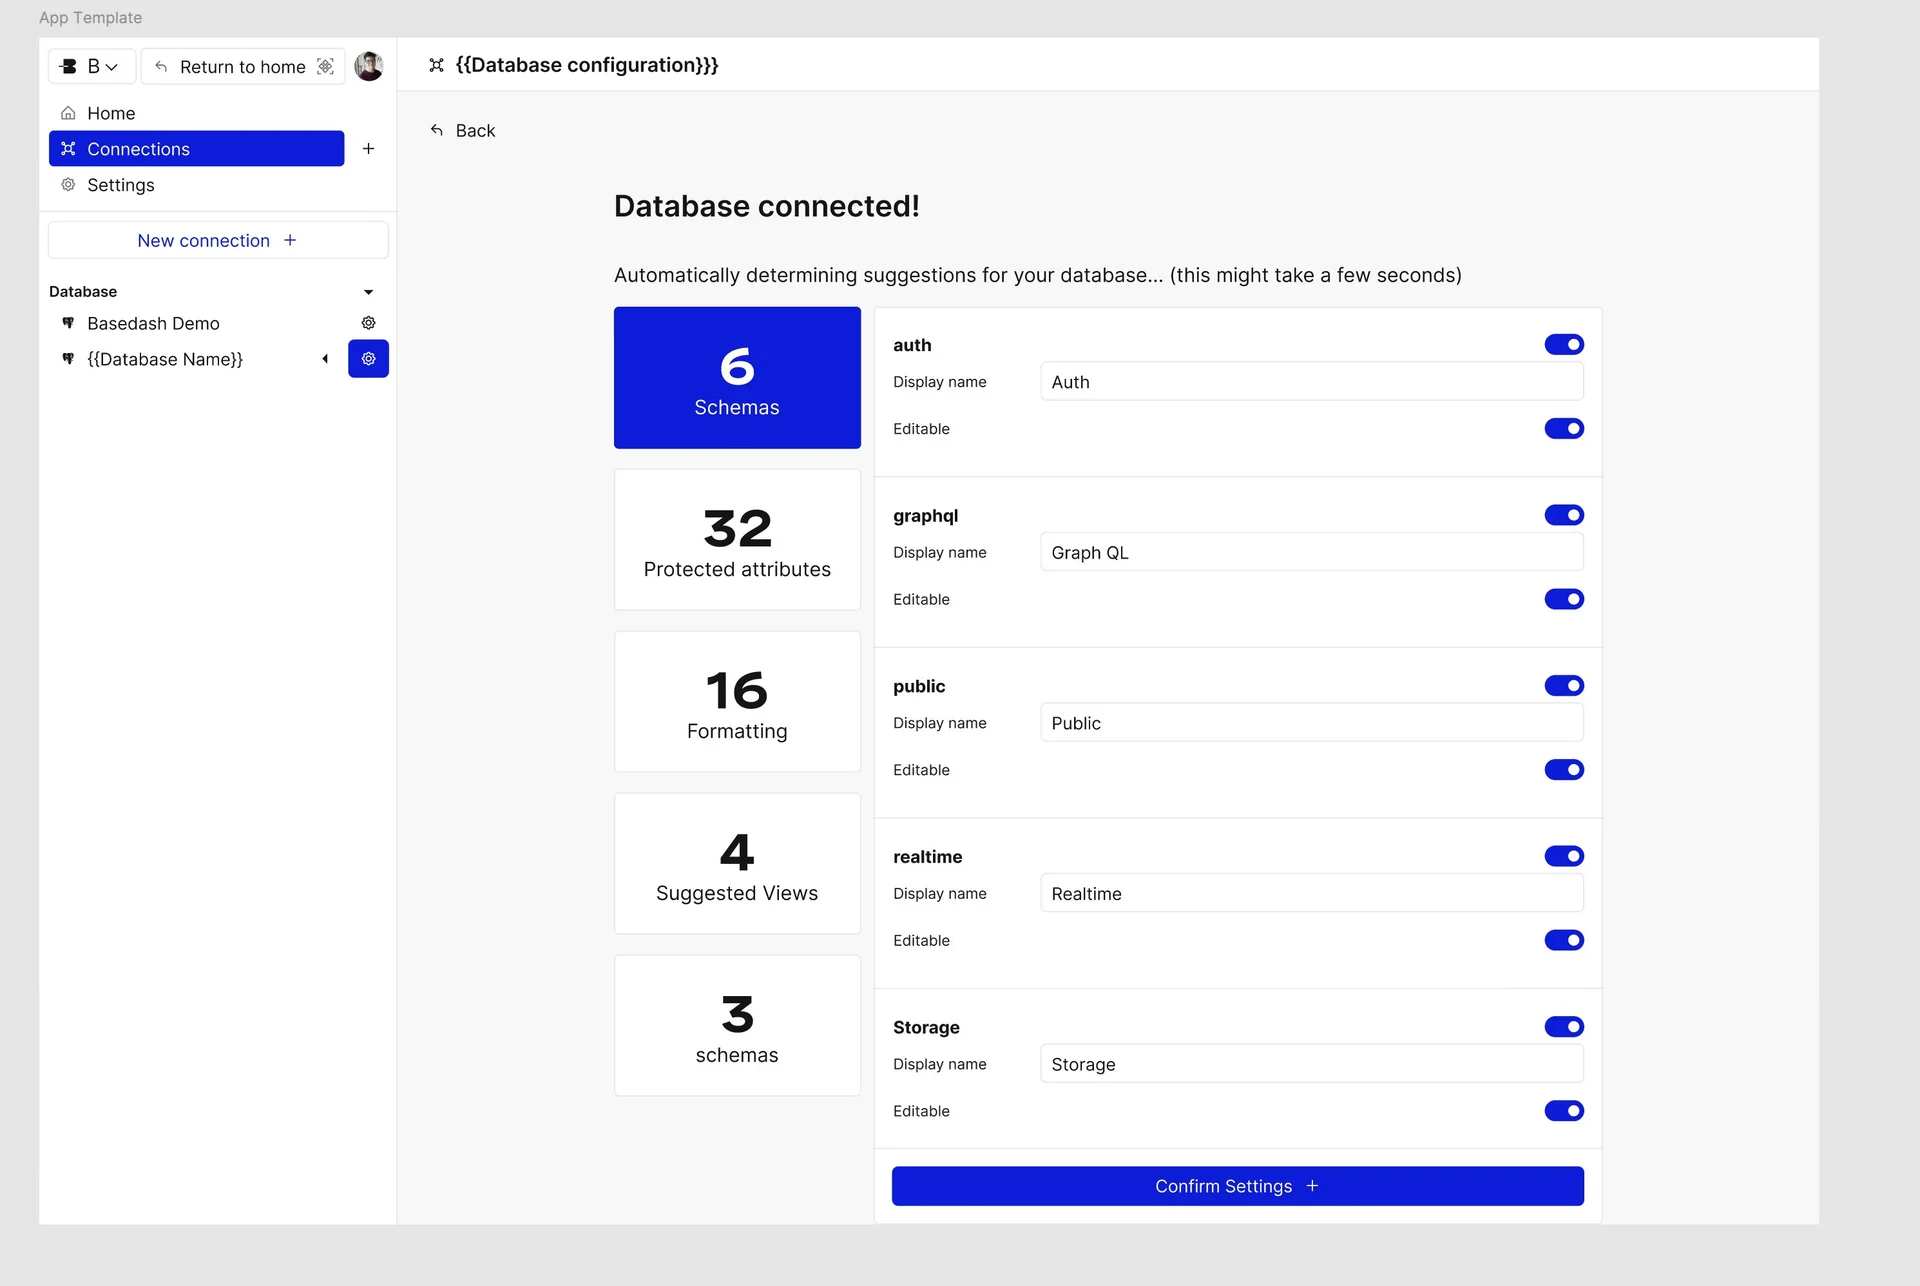
Another onboarding exploration, this time with richer connected-data states.
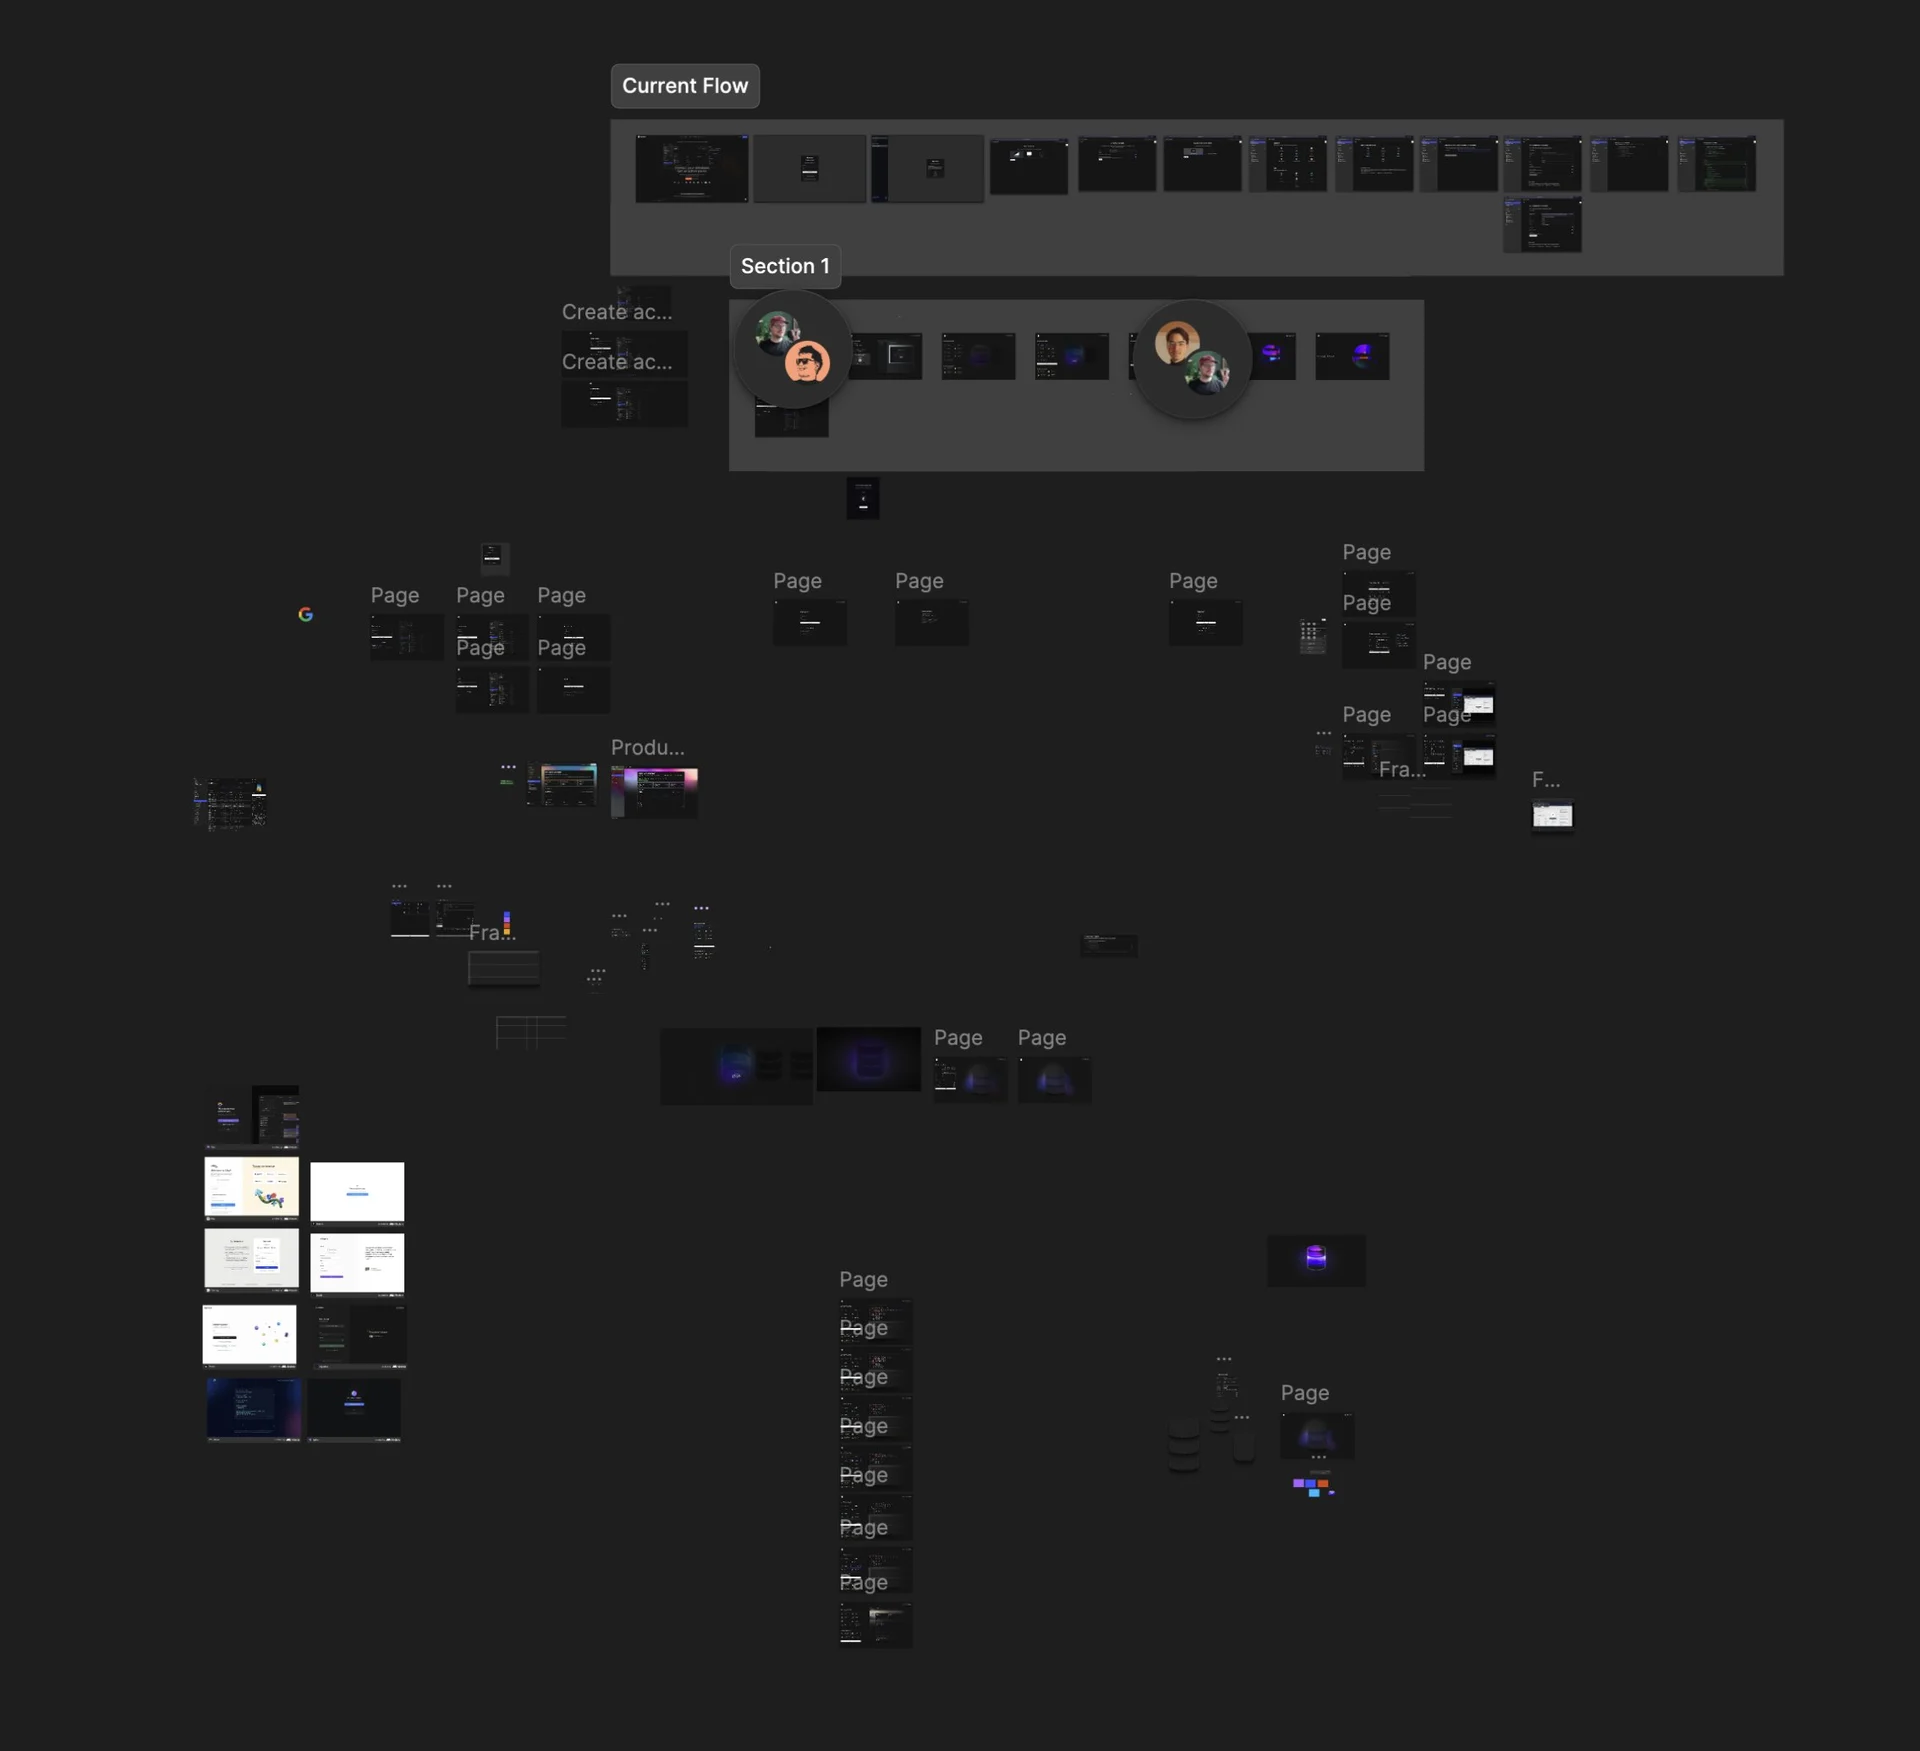
So I used @splinetool to generate a whole bunch of assets that would show up when data was connected or loading.
But we also made it so that based off of the type of data you connected, it would change the colors of the loading indication.
This is the staging animation, but we would have different colored orbs show up that match to the color of the database's branding.
It was cool.
And also completely and totally unnecessary. @drk I'm sorry for all of the wasted work here, but we pivoted shortly after.
Also, this is when I went really deep into spline and embedded assets instead of static animations and loading states. But Spline had a lot of performance issues based off of the way our application was architected, and we realized it wasn't quite the right tool for our use case.
The second recording shows how it looks when the blur is removed. Pretty cool.
Making raw data feel human
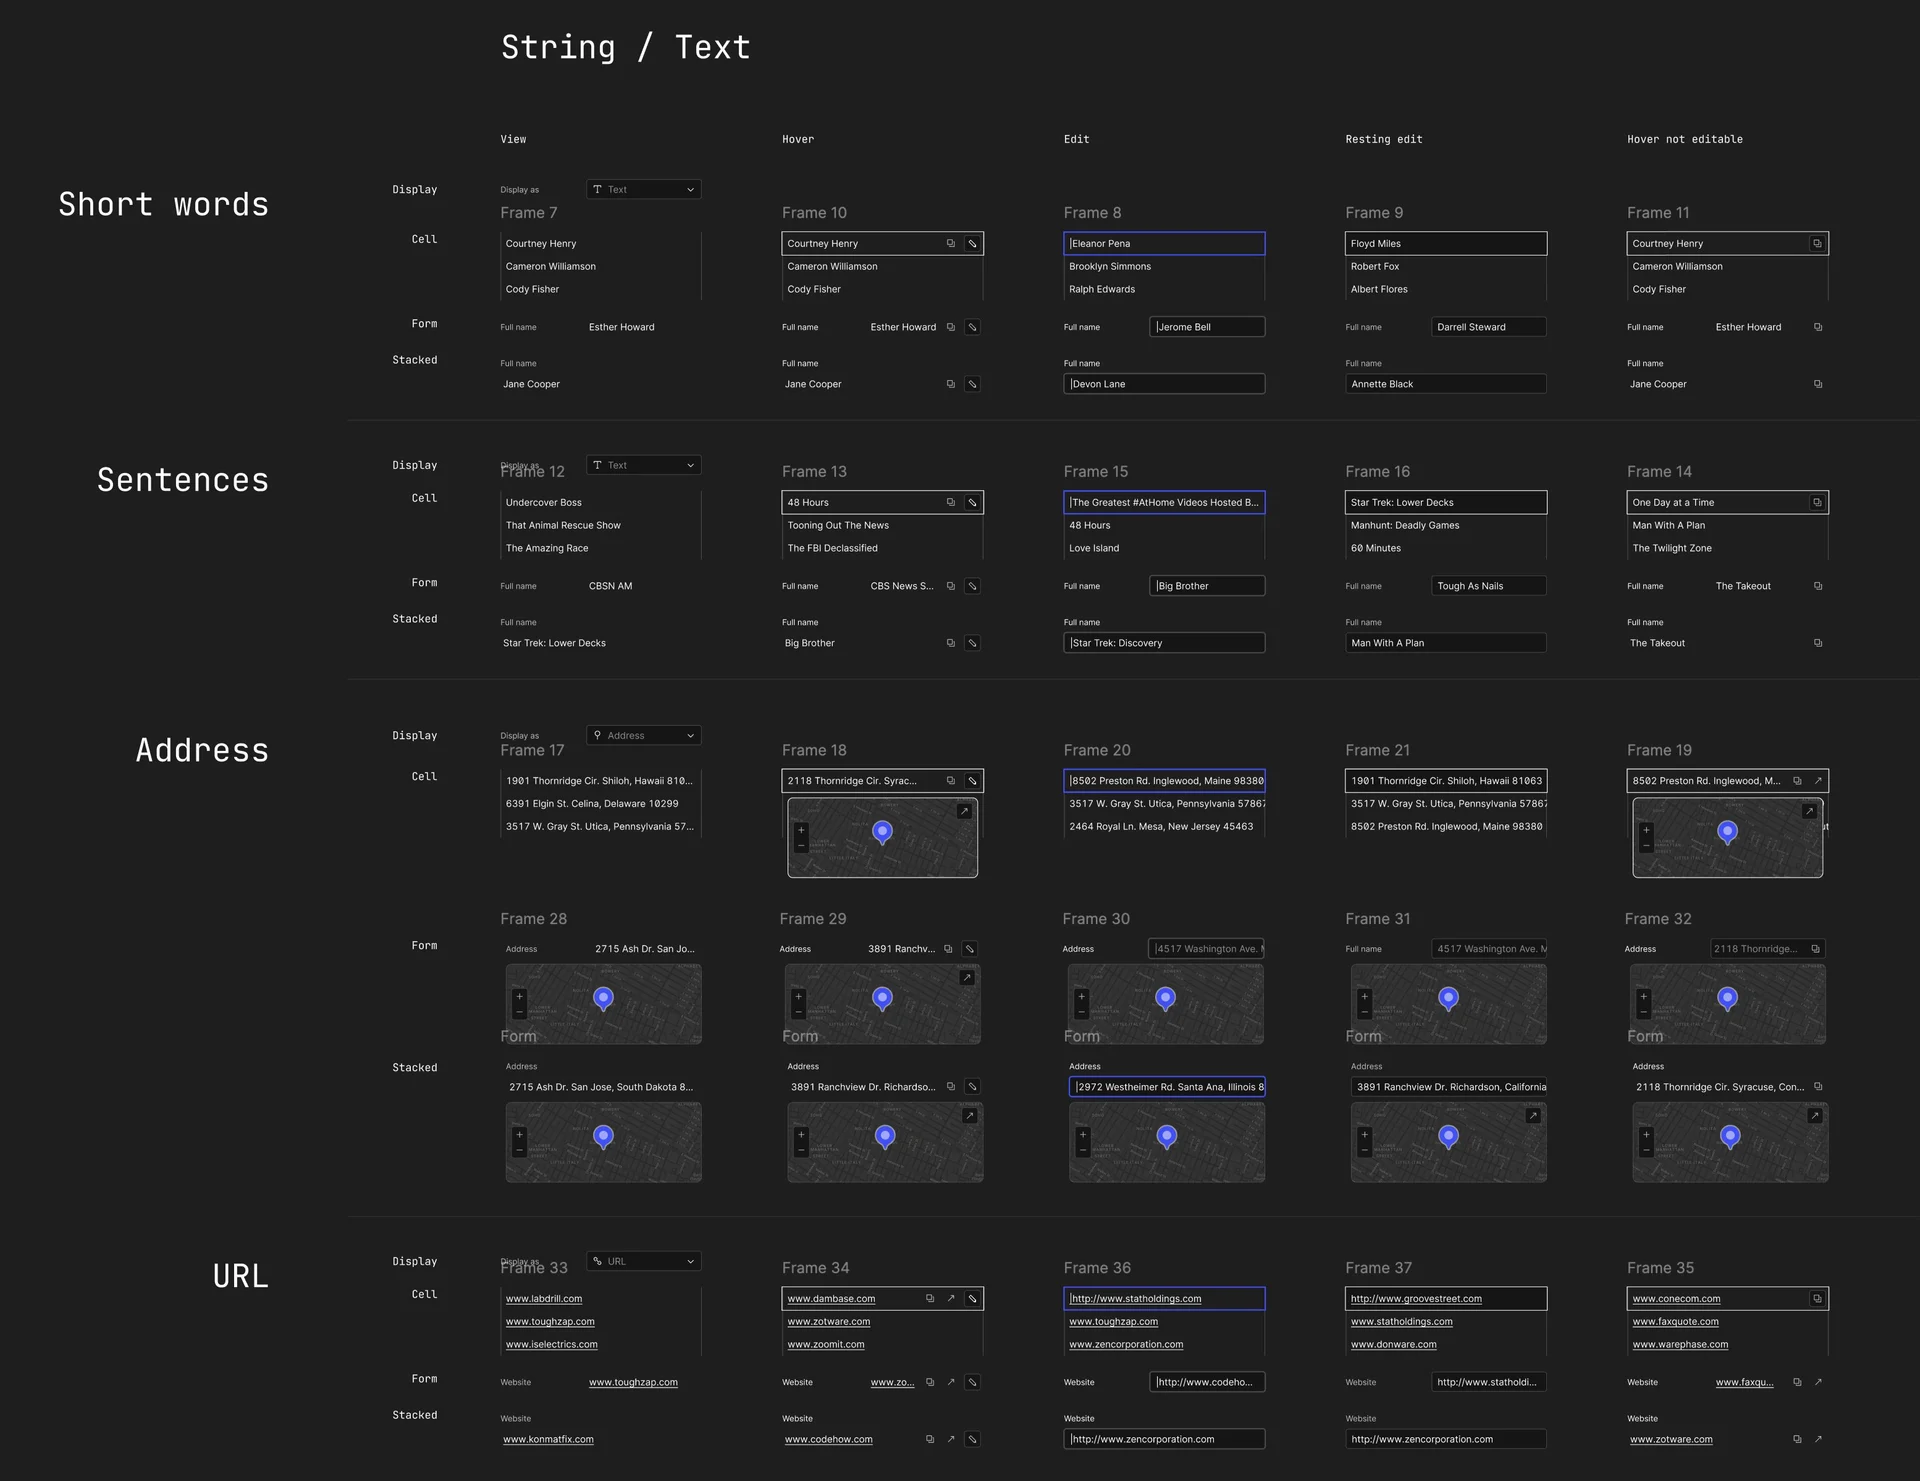
Ooh, these are also some interesting explorations around data presentation.
The thought here was rather than showing the straight string as it exists in the database, we could transform it and do some binding to it.
So if we see the address, we could fetch an actual geo pin for the address instead of just showing the string. Or if it's a URL, we could fetch and show more details about the URL or do some more formatting, rather than just raw database data.
The rationale for this was that non-technical users found Basedash very intimidating, technical users found it kind of limiting, so we're trying to find a balance between showing data as you would if you built the application yourself.
No one is building admin tools where they're showing raw SQL date strings, for example, and it's mostly always shown as a location pin if you have an address. It's just better data presentation.
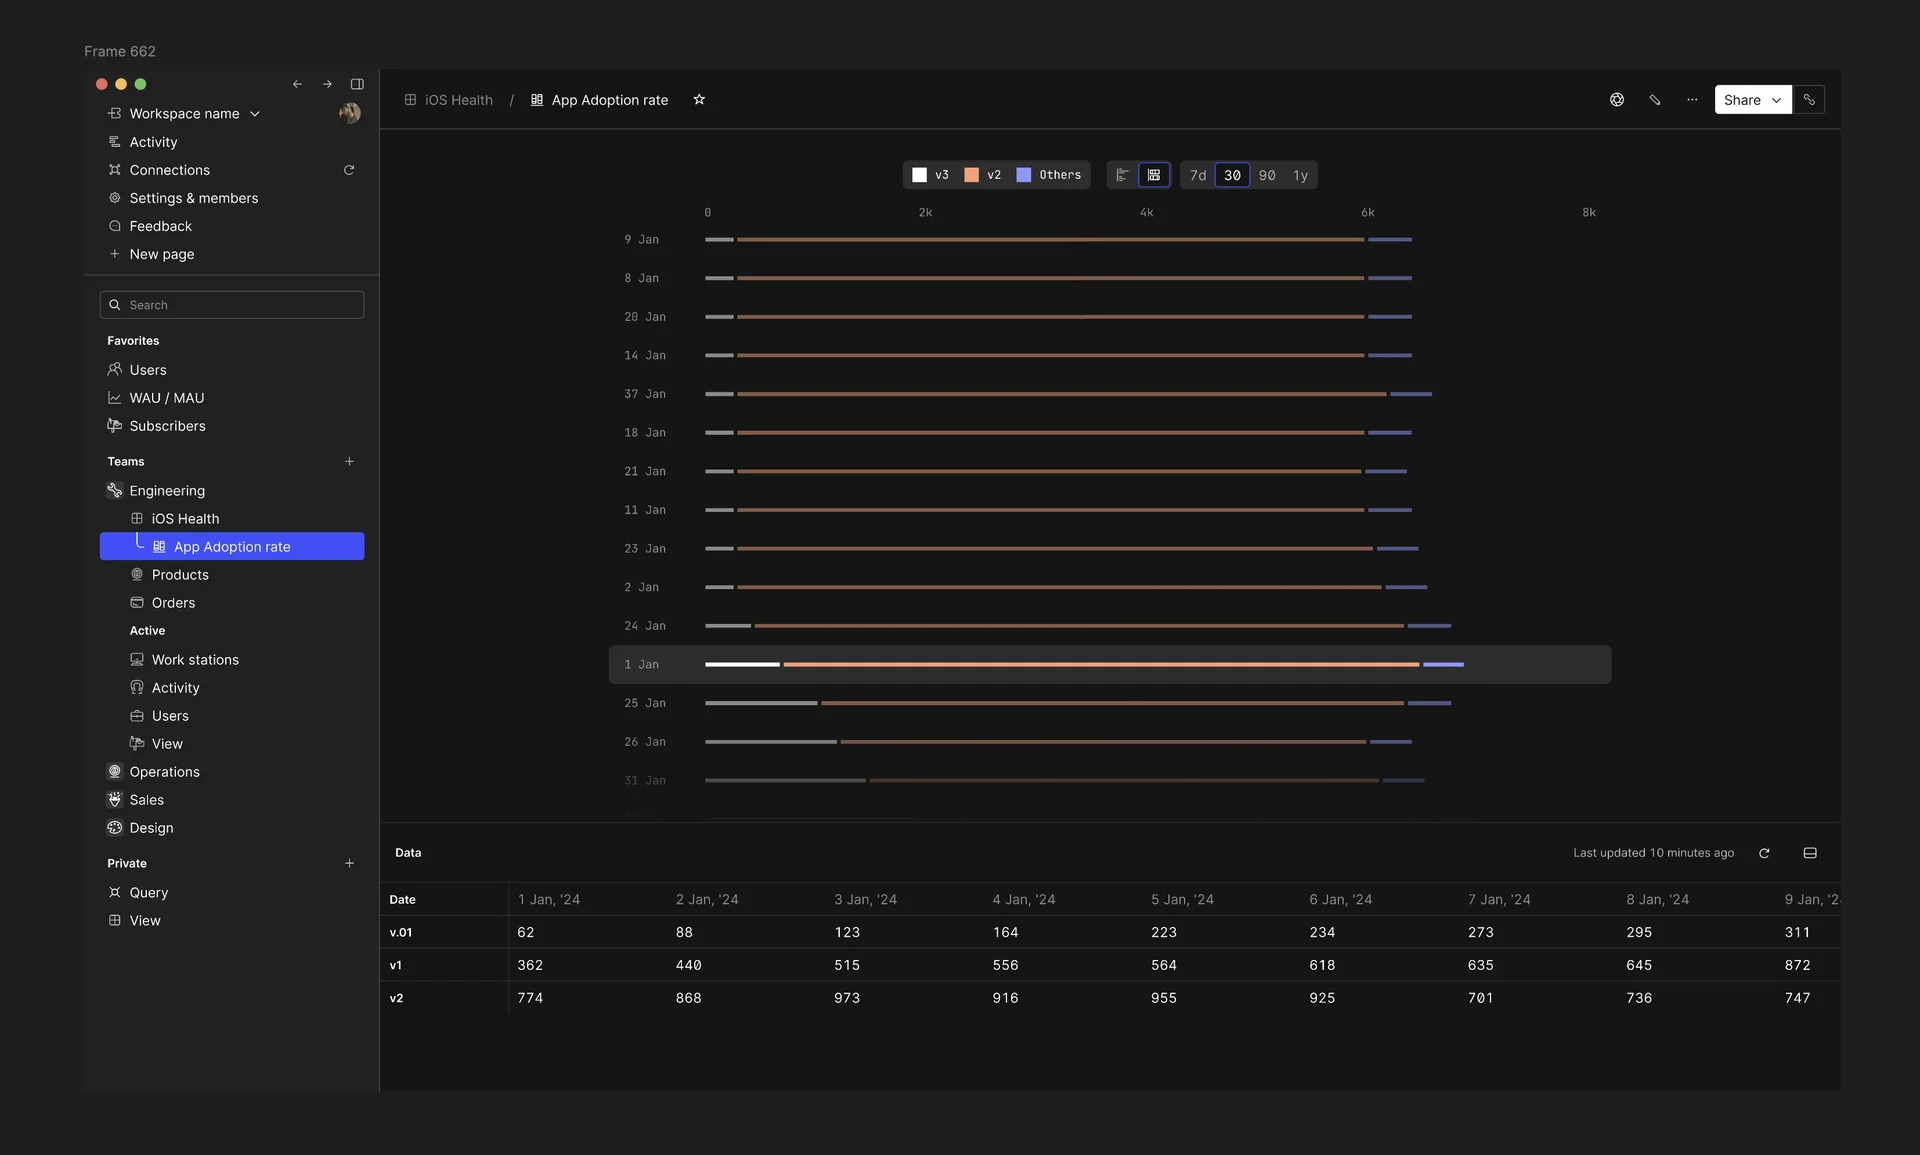
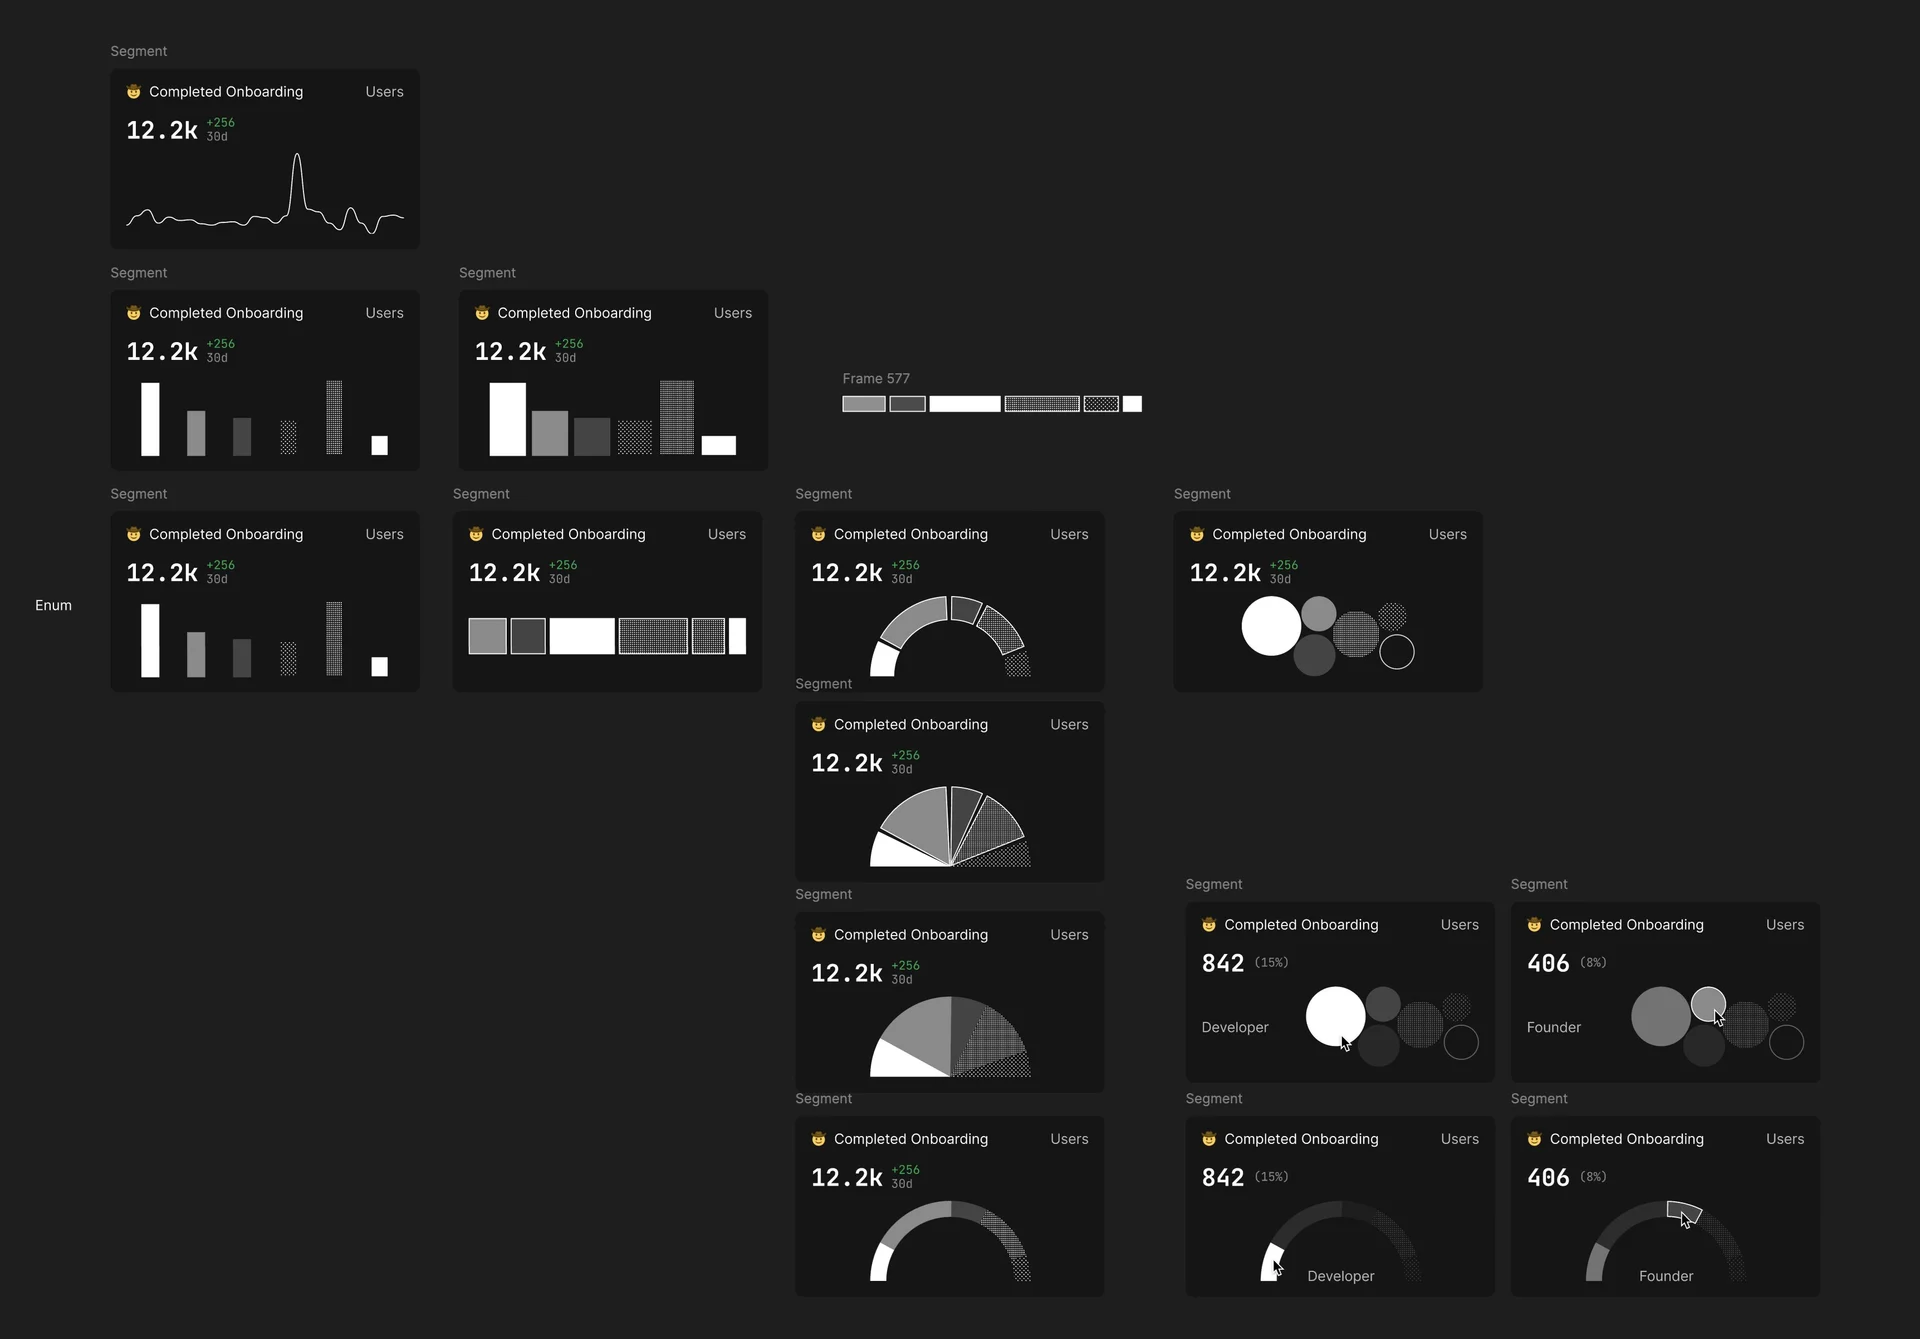
What if we did charts really well?
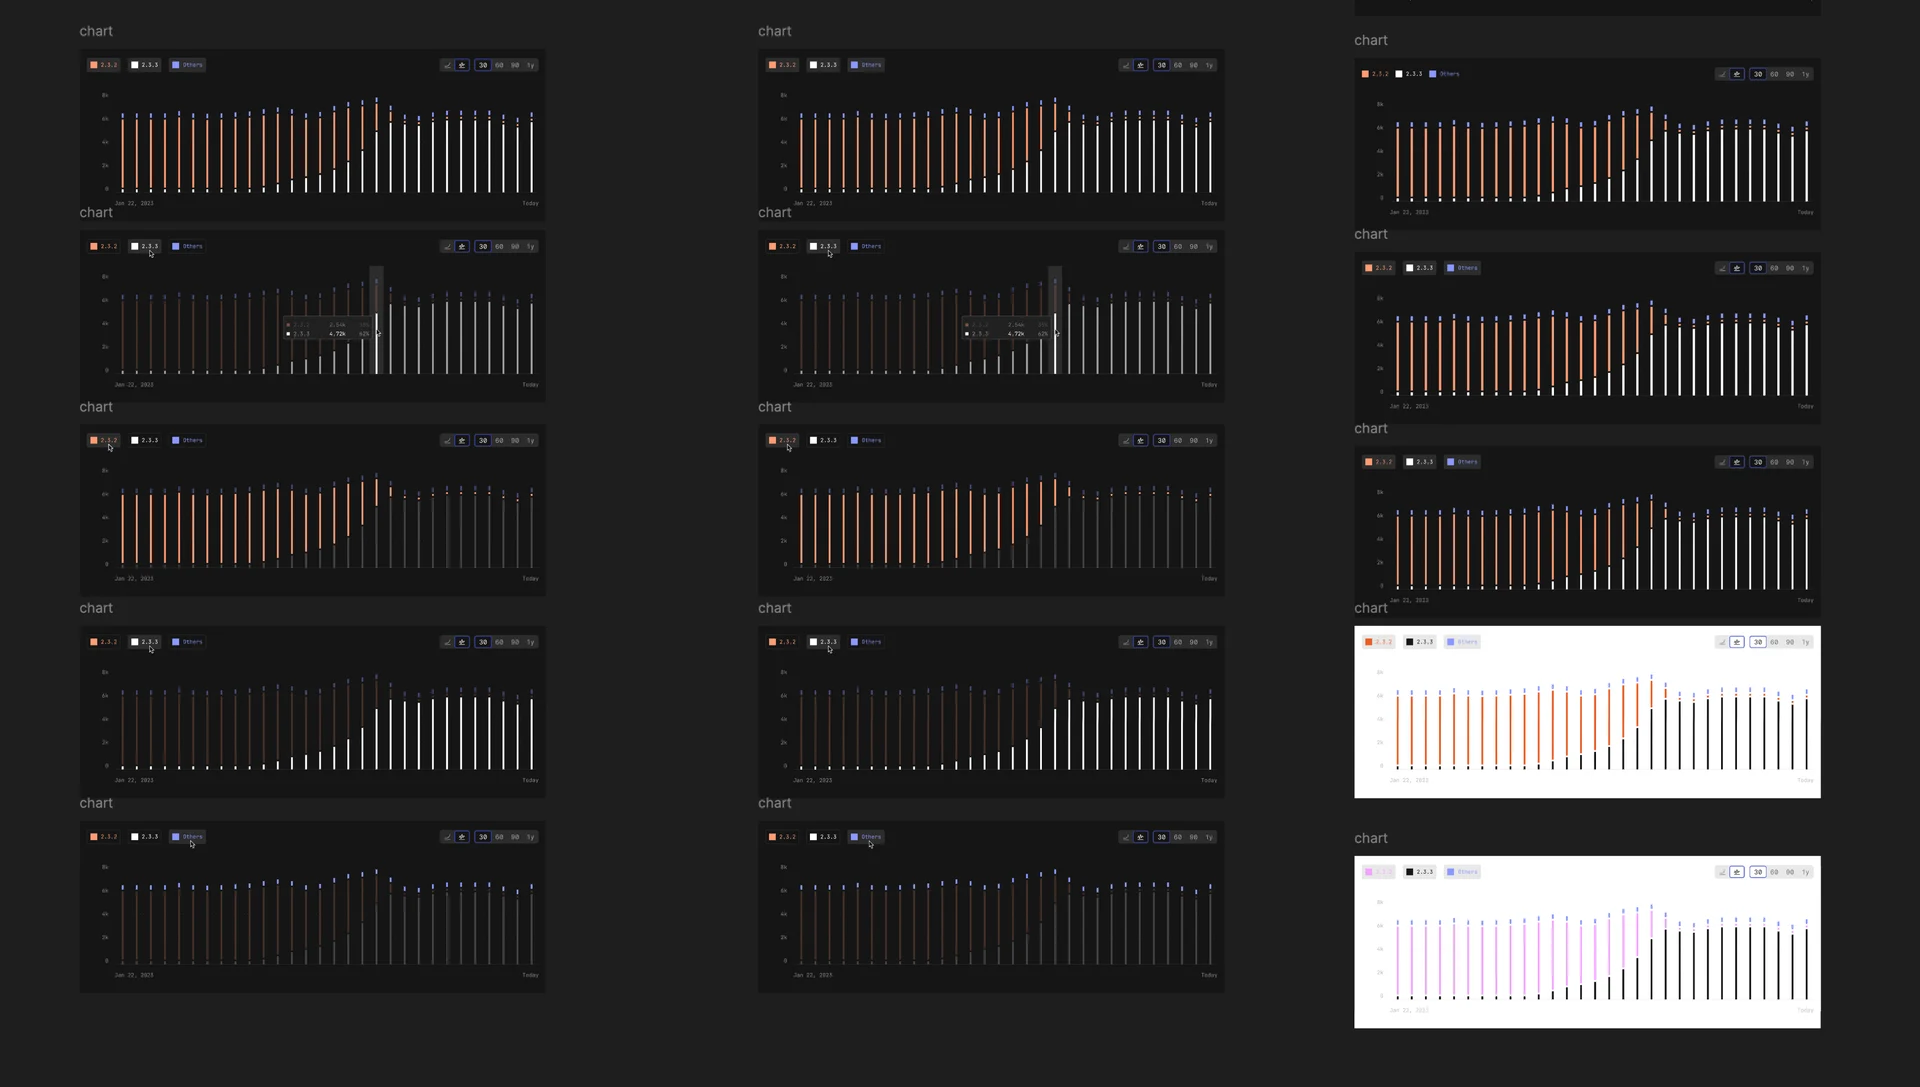
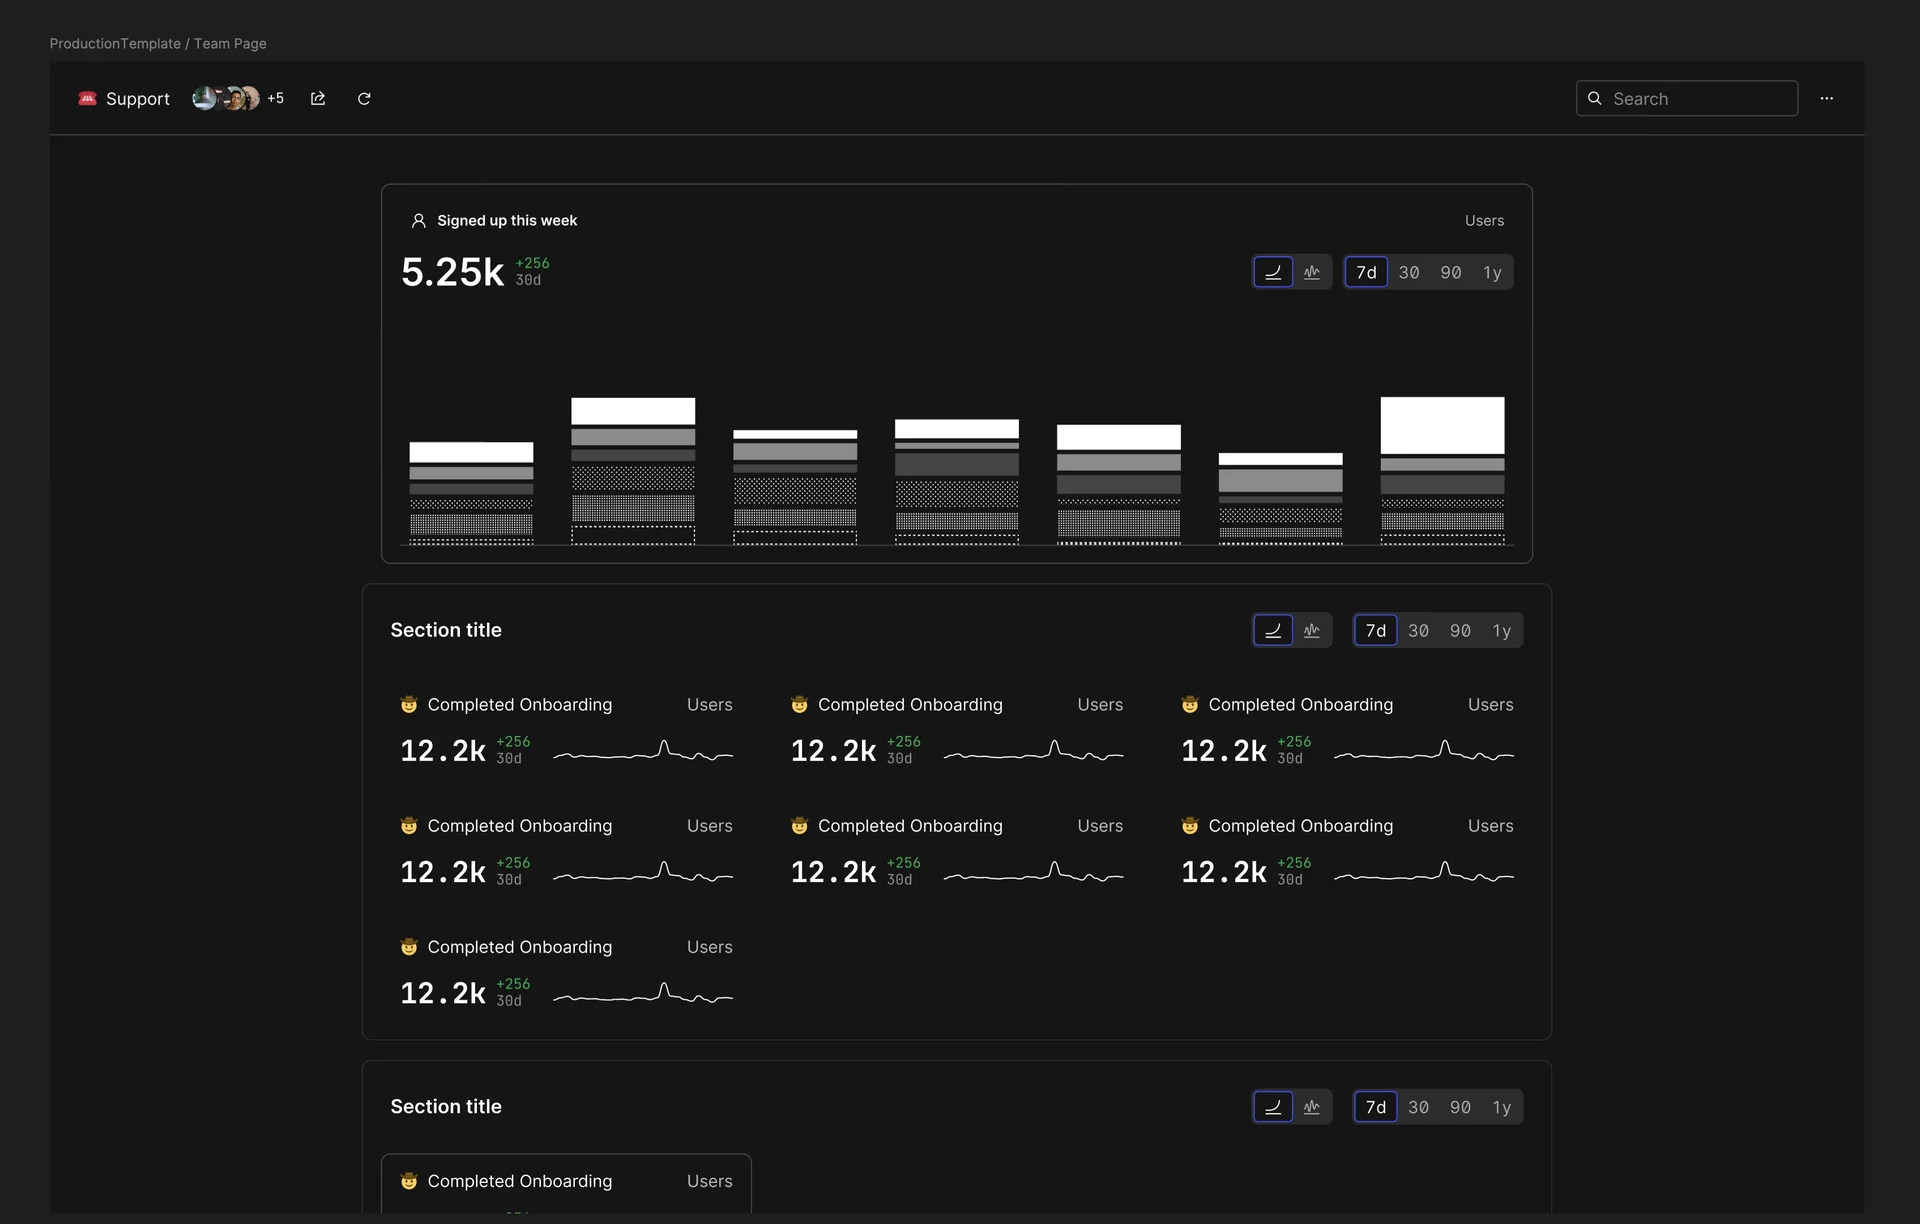
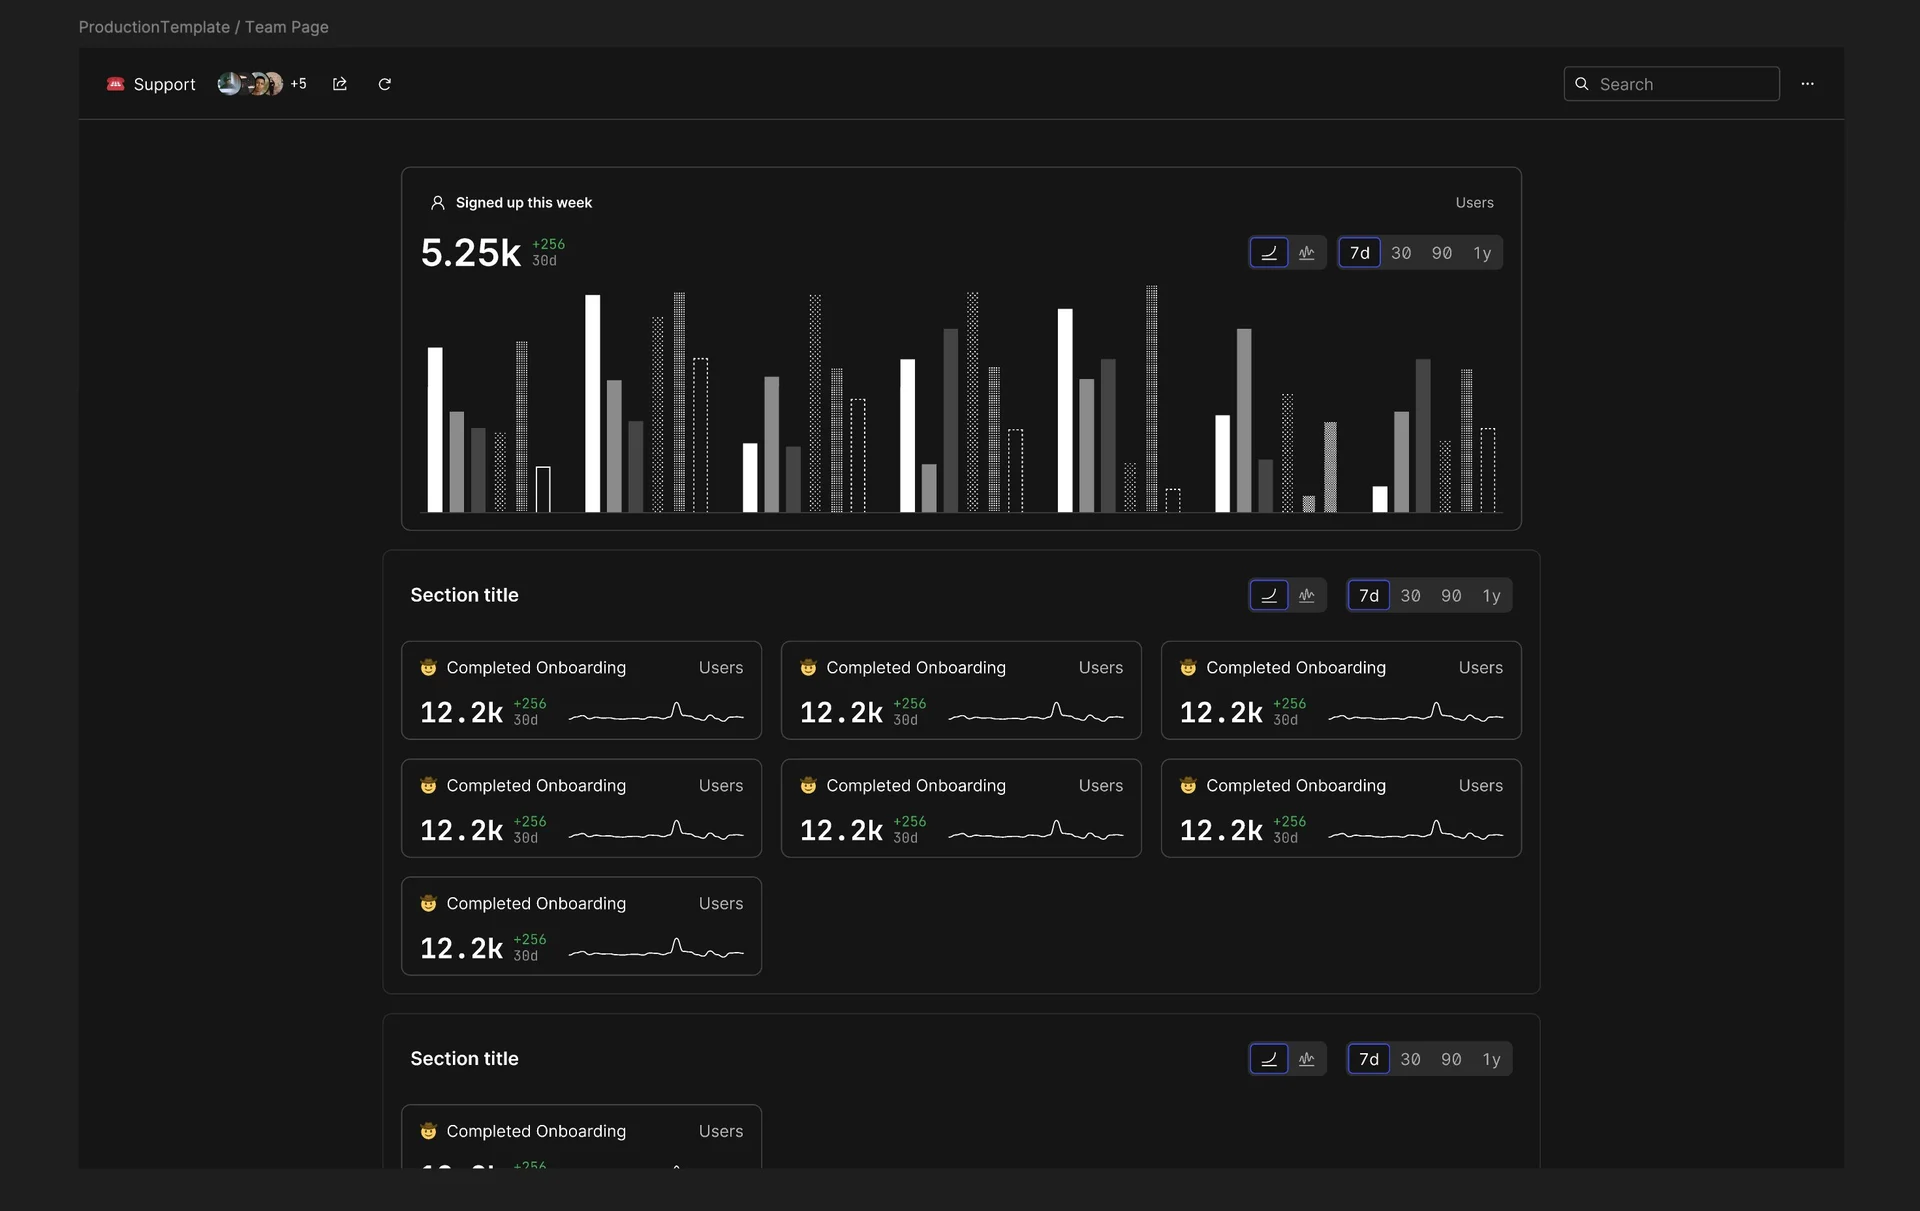
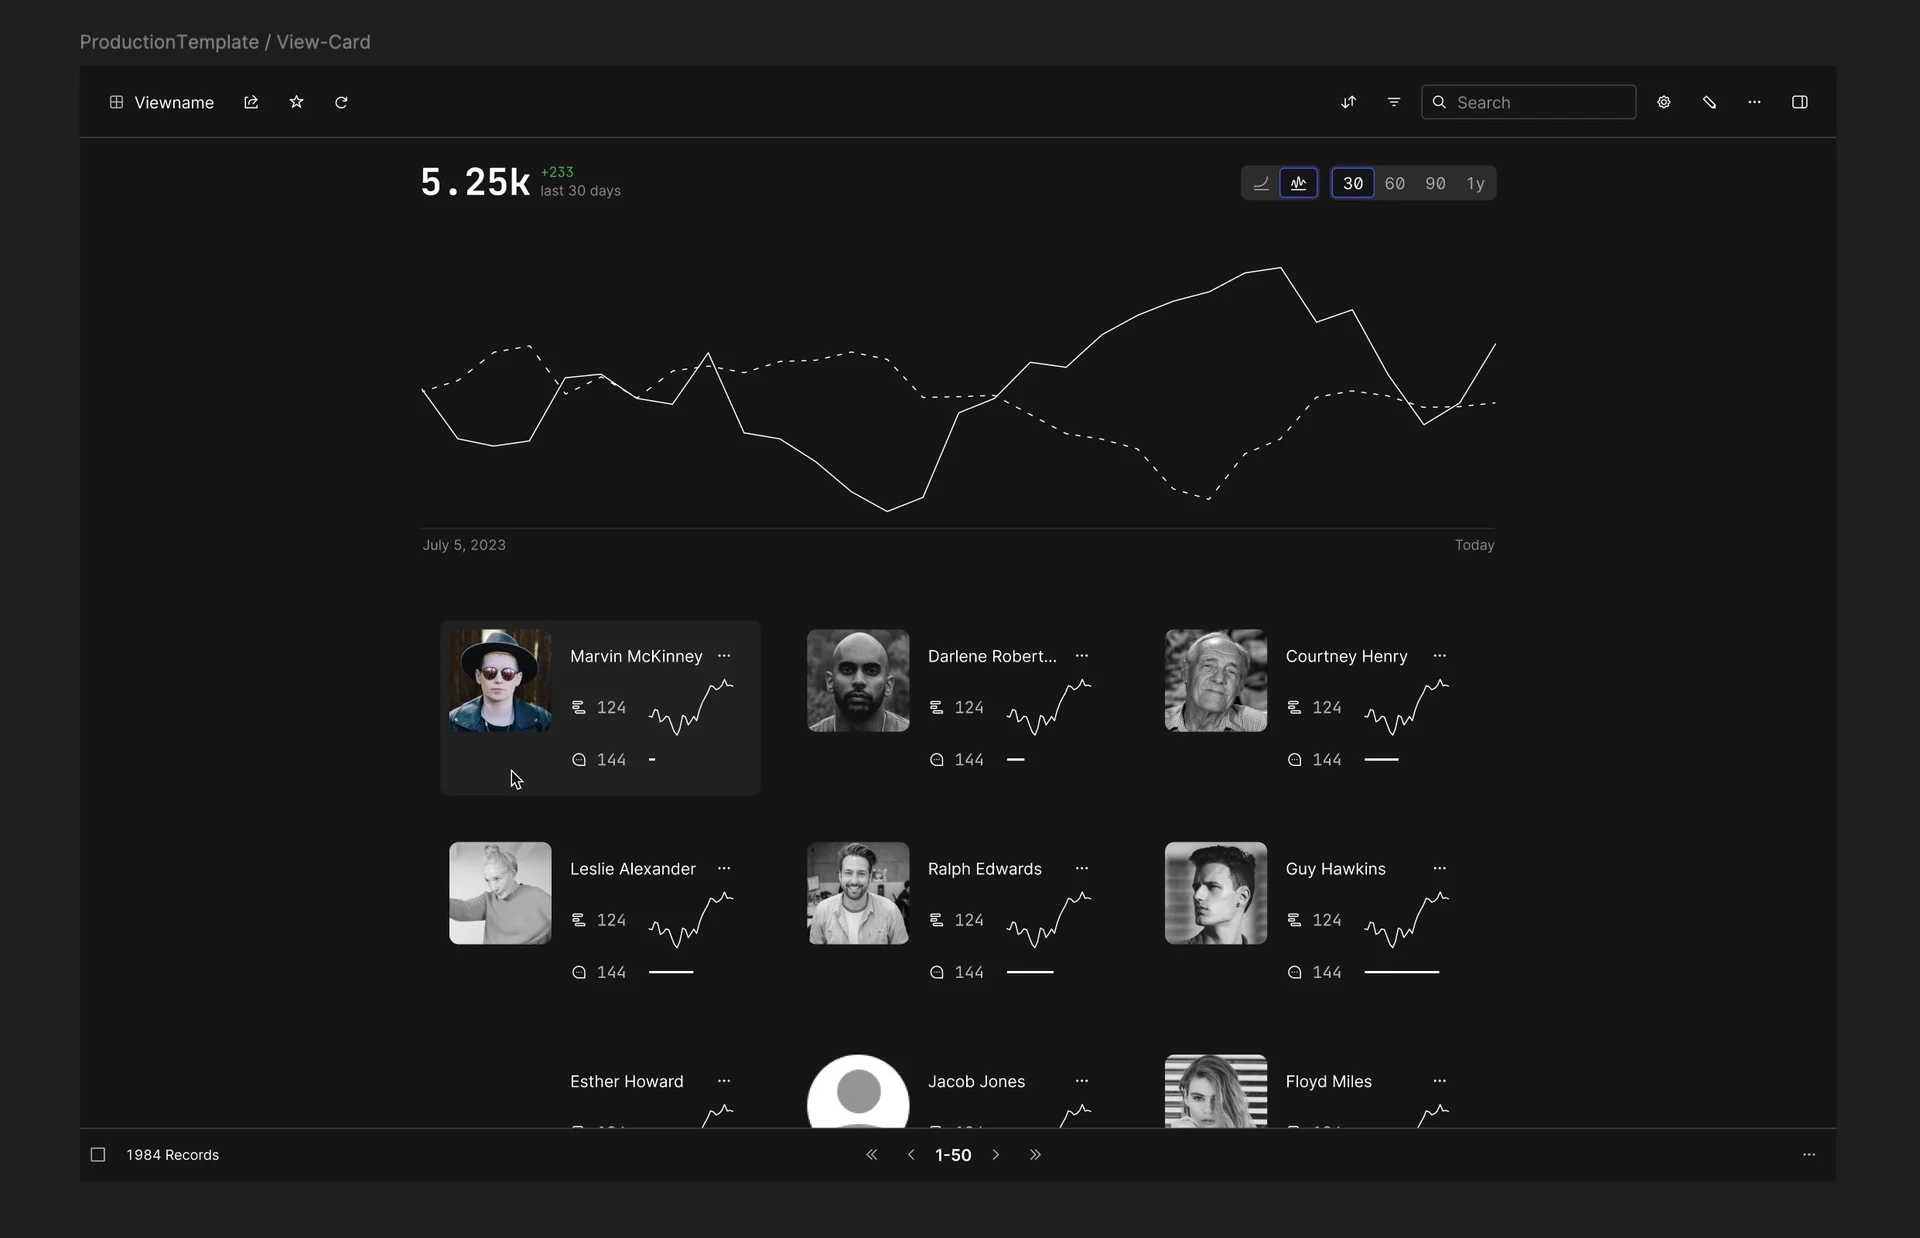
I found my first chart explorations!!!! I've been looking for these for ages. Turns out they were in the old product file, of course. That makes sense.
This is when we decided, "What if we did charts, and what if we did them really, really well?"
But it was before we had known if we wanted to put them in a separate application or if we wanted to put them inside of the admin application.
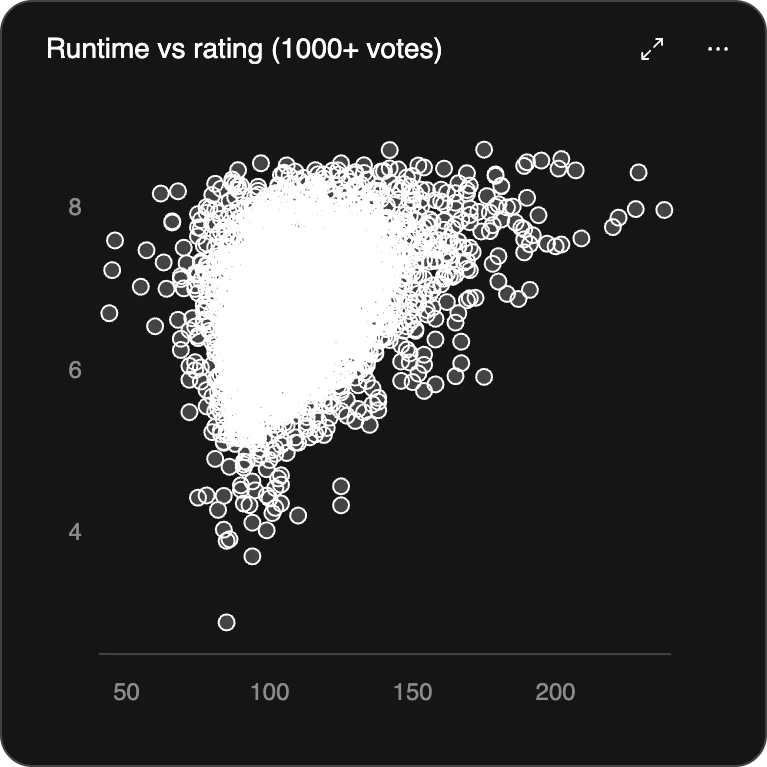
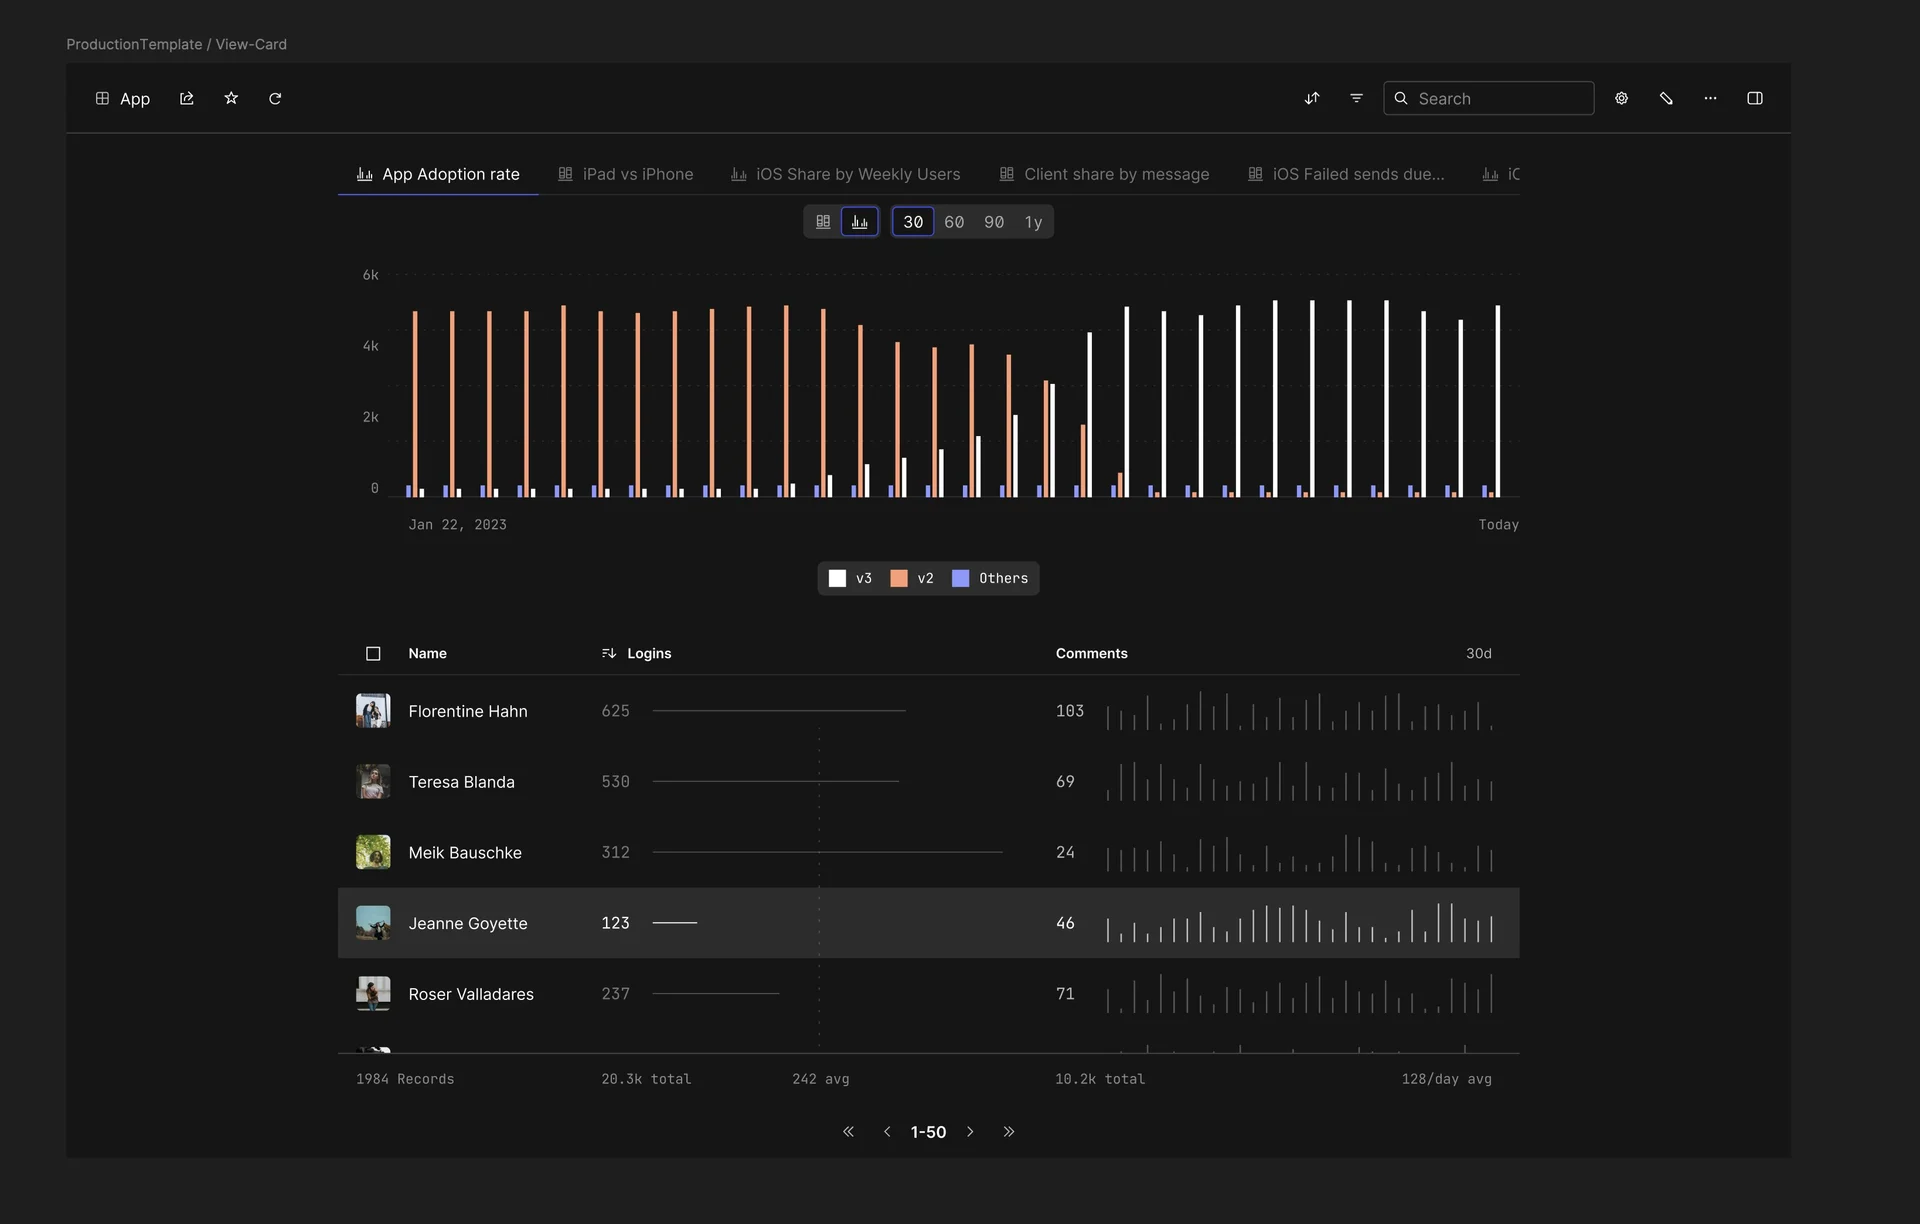
I took that as an opportunity to completely rethink the way that our charts had been rendering, leaning into a different aesthetic, contrast, legibility, labeling, much of which exists in Basedash today.
More early chart directions.
Some super minimalist stuff too. Also different explorations based off editorials and non-traditional data visualizations.
A dashboard that grows like a city
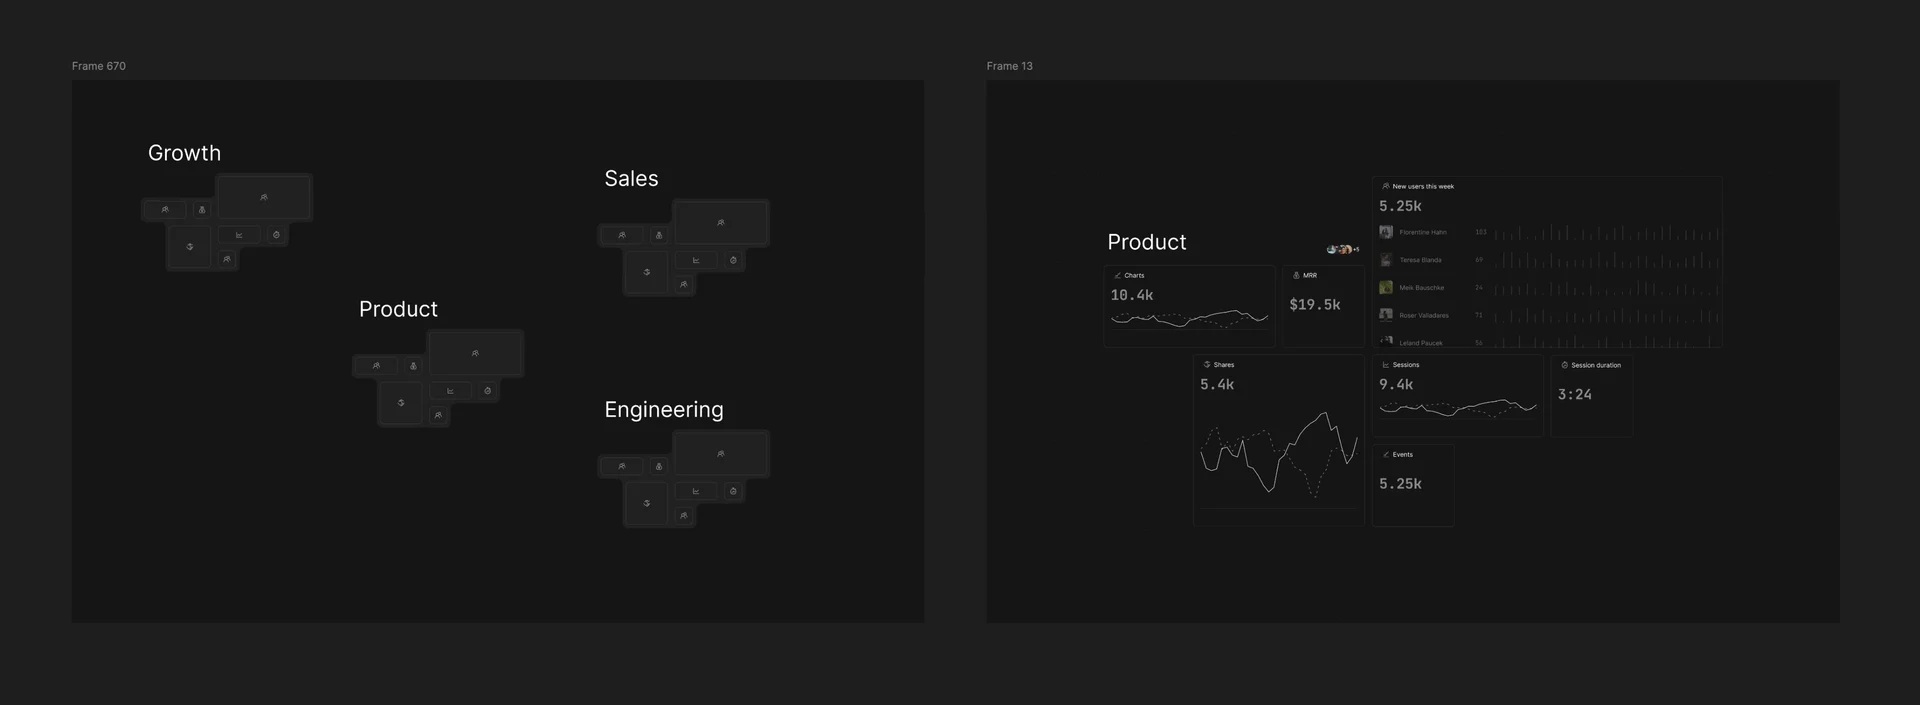
Oh man, this was a wild idea.
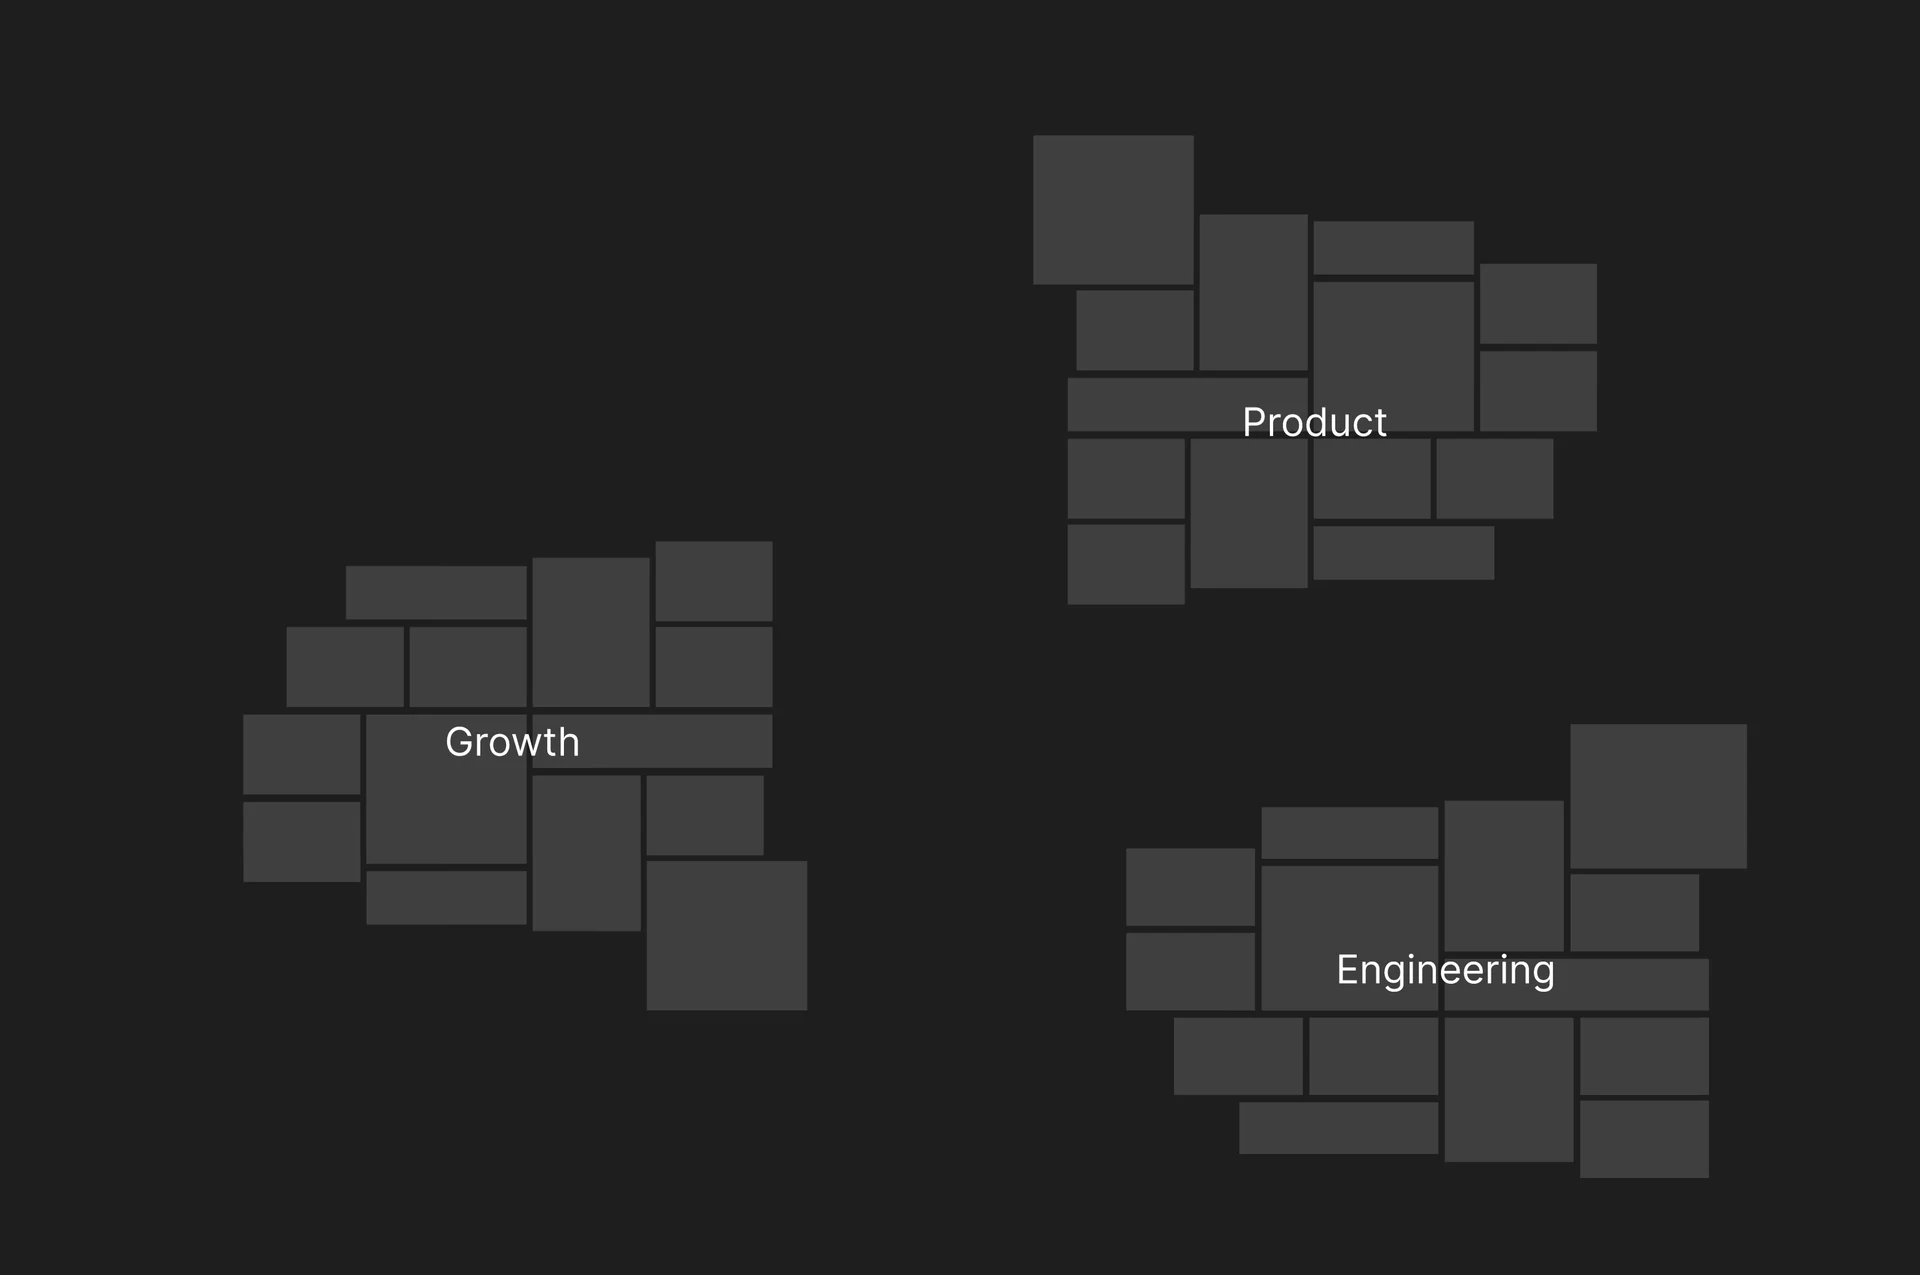
The concept here was that dashboards, rather than being a strict grid that started at the top and went down, would emanate from the middle of the page.
So, as you added more visualizations to a page, it would grow out up and to the sides.
My metaphor was that cities start with a downtown, and then roads branch off from that, gradually growing in complexity.
So my thought here was not a page, but more of a canvas where you would be able to go inside of it the dashboard/canvas and just start exploring and branching out, going down "avenues", if you will, all of which would build that dashboard over time.
You'd then be able to hide charts that are tangential or not related, or click on some chart and then explore a rabbit hole that's based entirely on it or that's fed from it.
This one was really abstract. I still think that there's an opportunity for a data canvas like this. Not something technical, not something node-based, but just a growth of data emanating from a center where you could take interesting pieces of information off to the side and explore them in isolation.
Or maybe I'm just a designer who's used to a canvas...?
Why we moved from admin panels to charts
This is where Basedash admin ends and Basedash charts begins.
So when I joined Basedash, the idea was editing data with the ease of a spreadsheet, internal admin panel, operations, inventory management, basically the ability to edit things that exist in the database.
This is a necessary product segment. If you have a database, you need to be able to edit it.
Misspellings, typos, changing emails, changing names, refunds, avatars, etc. When you're an early stage startup, you find out quickly that you do need to have an admin panel.
Basedash still uses Basedash admin to this day for things just like that.
But there was a huge hesitation with companies to do or connect anything to a database that makes it editable, understandably. It's a big security risk.
And we saw that people really didn't want to use a vendor to solve that unless it was via an API.
We added a ton of security functionality. We added the ability to make edits via an API. We added a lot To address those concerns, but it was still perceived as an issue.
Our hypothesis was because other internal tools took a long time and effort and expense to build, and usually they were just fragile and frustrating to use, complicated and bloated and on and on and on, that people would want an easy-to-use, fast, zero-maintenance internal admin product.
But the window of opportunity for that to be Basedash was only when they were making the decision to initially build. As soon as they built their own internal tool, the cost of switch was too high. Even if the cost of maintenance was higher than the cost of switching. Because there's also a cost of training, onboarding, support, not to mention the cost of a vendor taking on that workflow.
Also, developers are exceptionally difficult to sell to. I don't mean build for, I mean sell to. When the initial user has to be technical to set up a database, they compare it to tools like DBeaver, pgAdmin, etc.
Which are free.
Do non-technical users use those? Not a chance.
But because the technical user has to be the one to connect to the data, they view it through that lens. And anything greater than zero dollars for that user seems like a waste of money. The odd thing here is that this is also coming from developers who wouldn't bat an eye at a six-figure AWS bill... But I digress.
So what we saw was that people who use Basedash admin really loved it. And some of them continue to still use it to this day. But it was very difficult to find the willingness to pay and the users who would grow.
Also, there was a net retraction in terms of people who would sign up for Basedash early on. They would start using it, grow, maybe add 10 to 20 people to the product as their teams grew. But once they reached a certain threshold, they started reducing the amount of members in the product because it was limited to only those who had security access and could make those significant changes to the database.
That's a whole bunch of background, but basically we also heard that people didn't like their BI tools. At best, they put up with them. At worst, they loathed every single second of using them.
That's when the pivot happened.
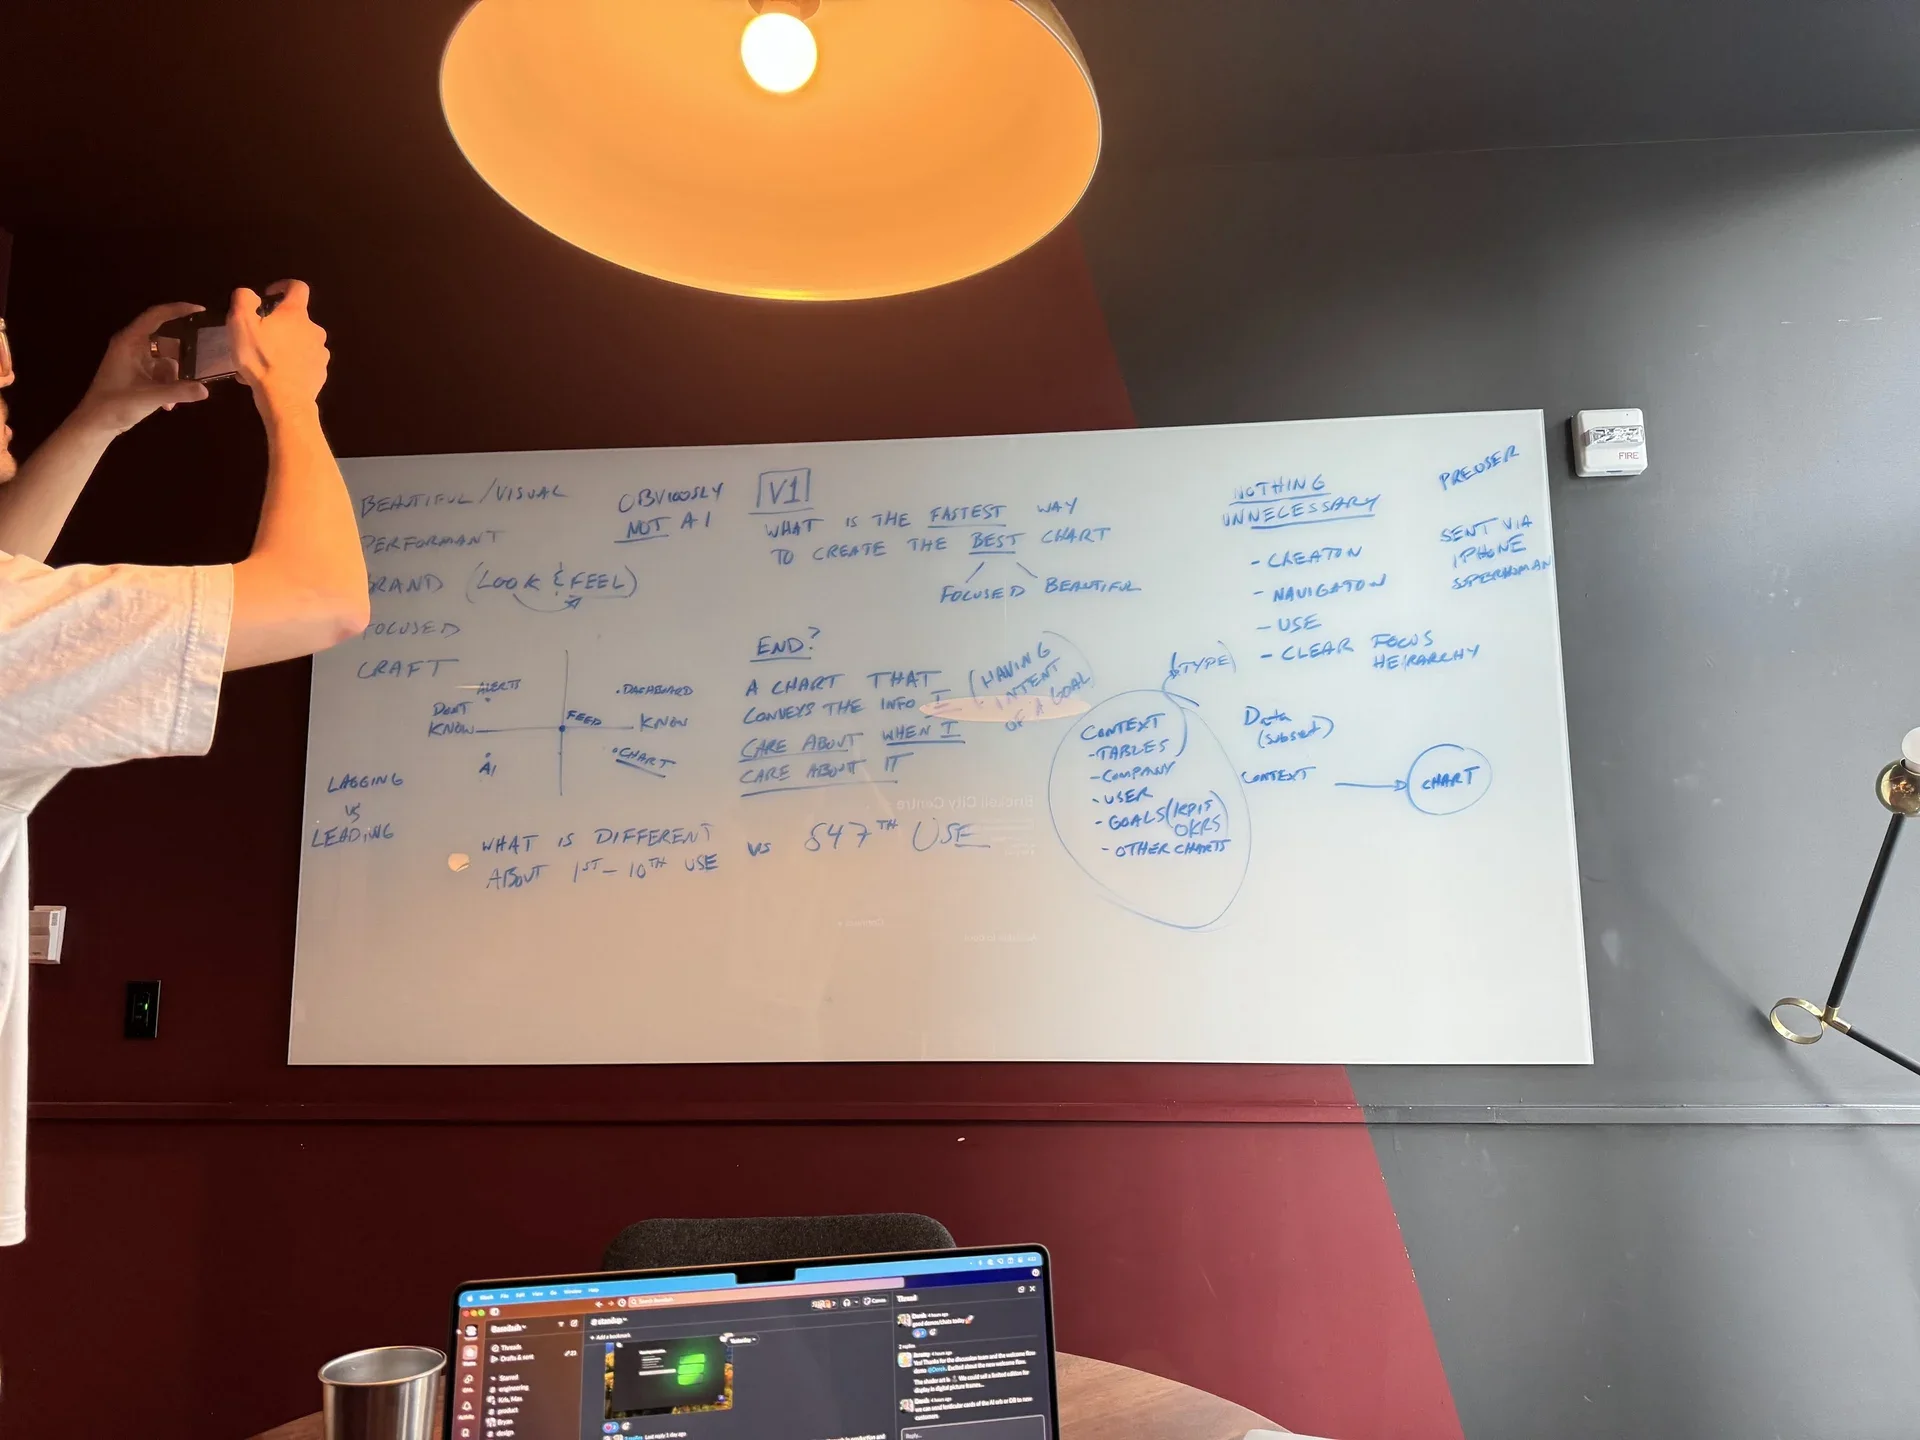
“What is the fastest way to create the best chart?”
Beautiful. Visual. Performant. Focused. Crafted.
It was a change in ethos. A call to action.
From a Framer prototype to AI-native charts
I actually designed the first prototype for this new product in @framer . It allowed me to bring in actual chart data, get much richer with interactive states, and of course use my favorite, the ticker component.
I also was exploring ways of making this feel very different, so there's no nav. Things feel much more approachable for a non-technical user. You can drag things around and explore data. There's also a homepage.
Lots of different ideas, some of which have made it into the product, many of which have not.
Check it out : https://tidy-recipient-652775.framer.app
Interestingly, nothing about our pivot was AI specific.
Yeah, we were going to use AI, but it wasn't going to be an AI native product. It was just going to be really good looking, fast, keyboard-centric, and easy to use. Very much aspiring to be at the level of @linear in terms of perception and quality and market segment.
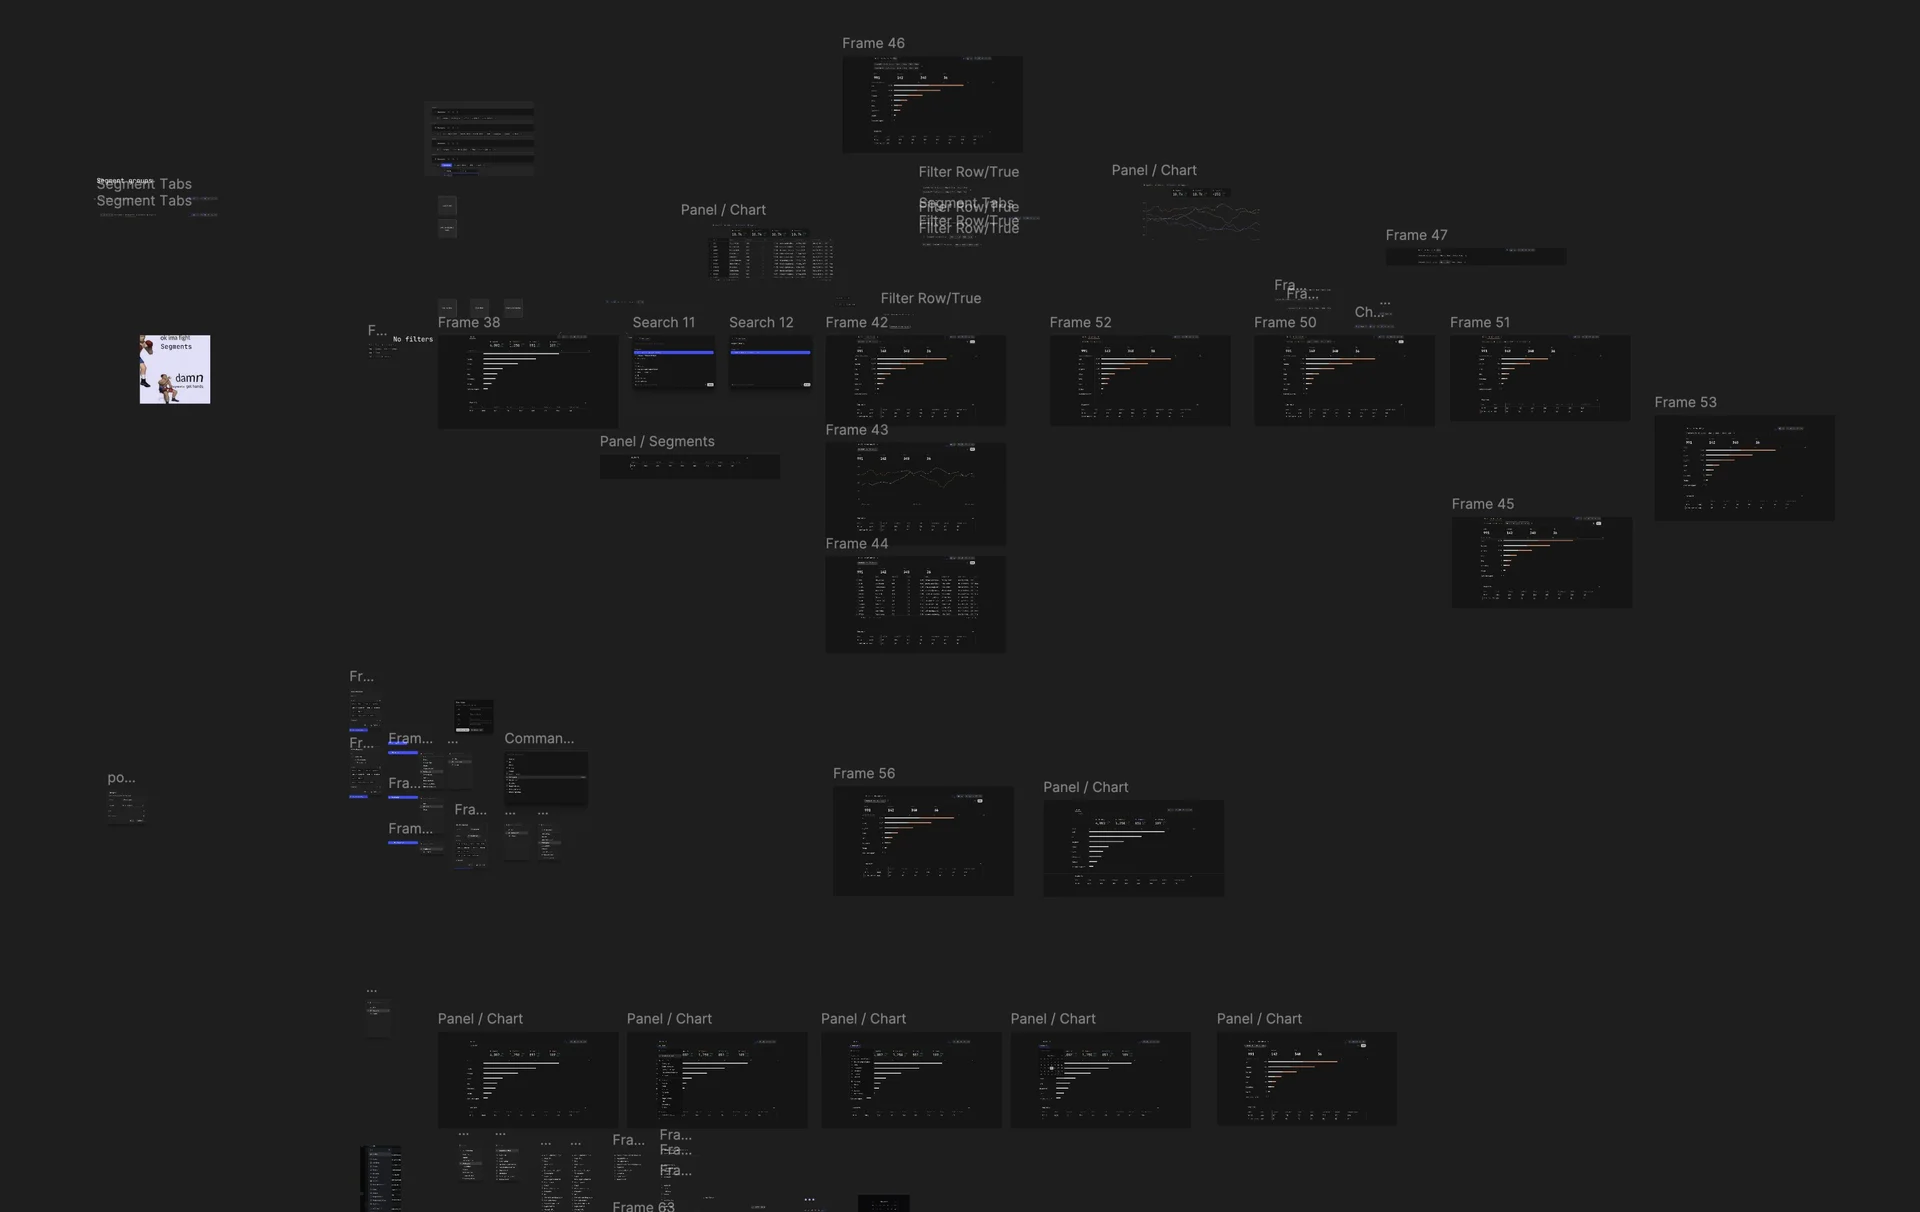
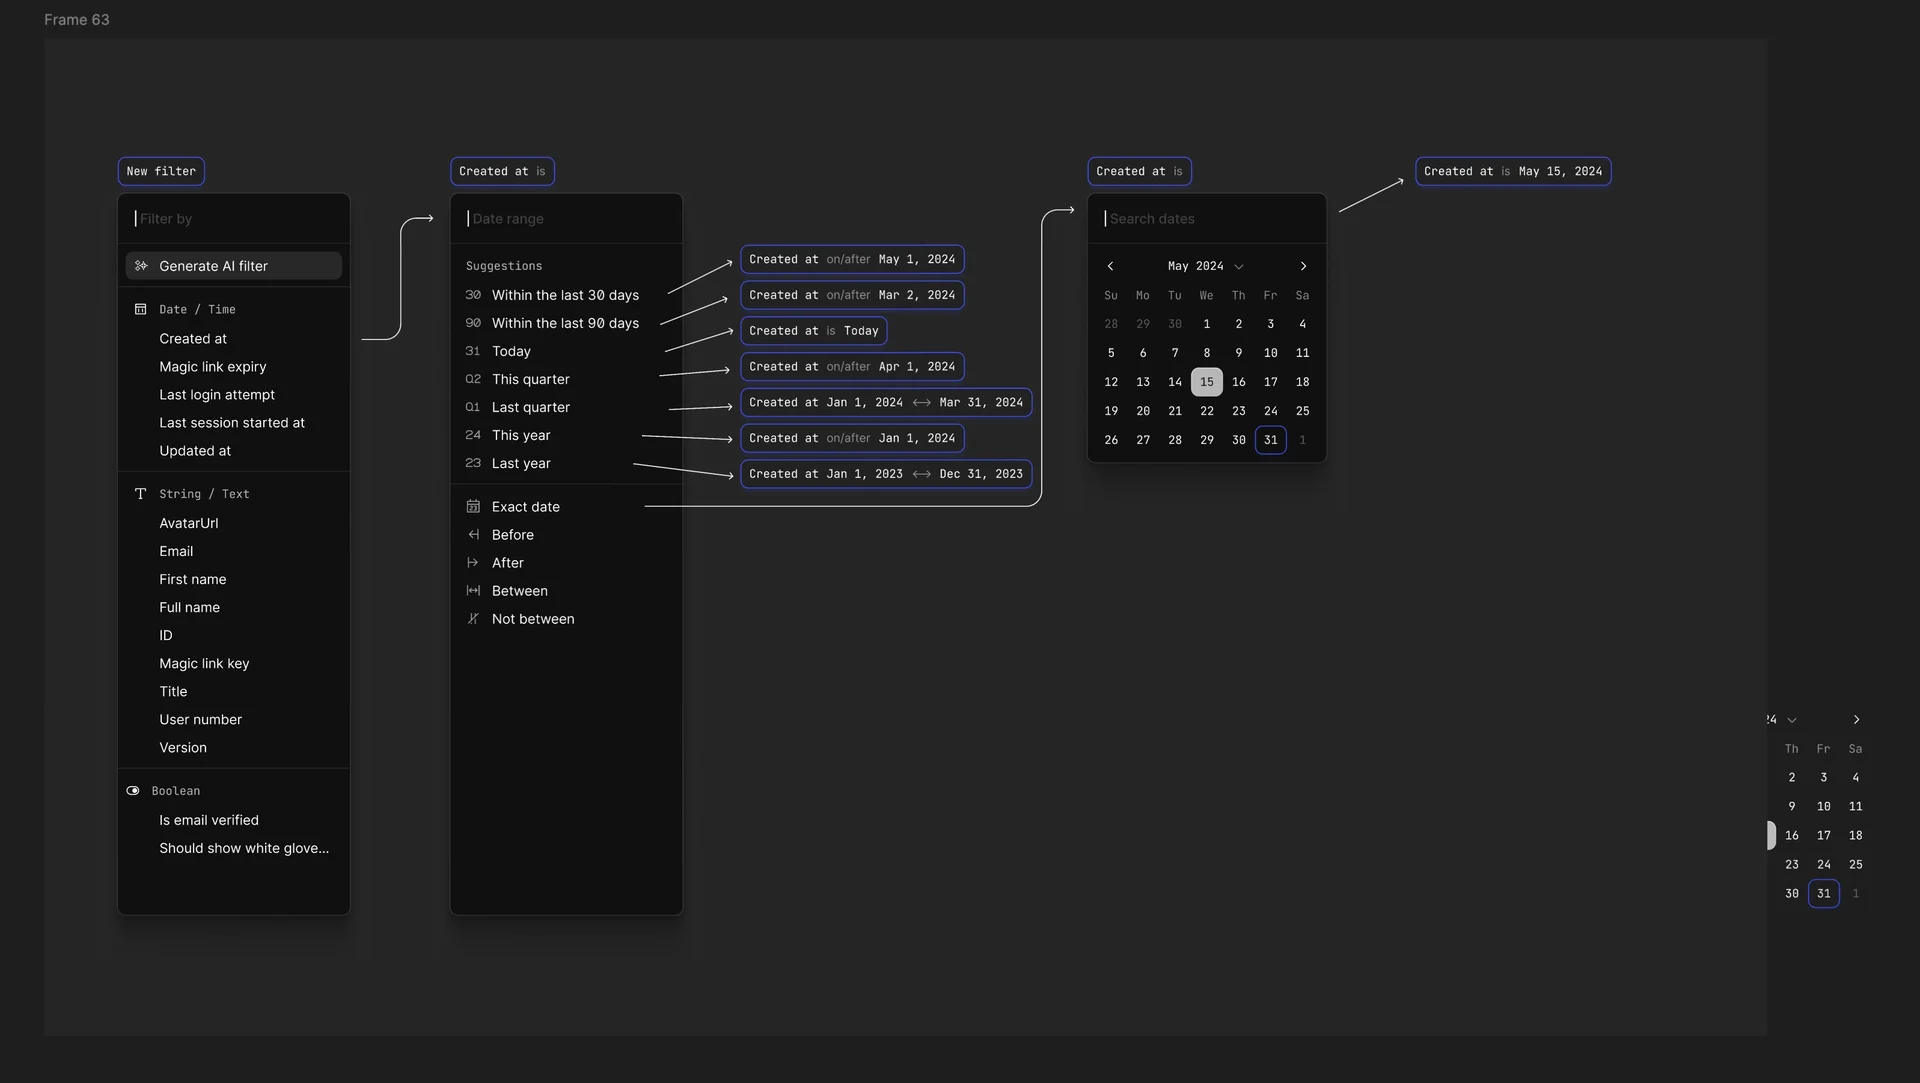
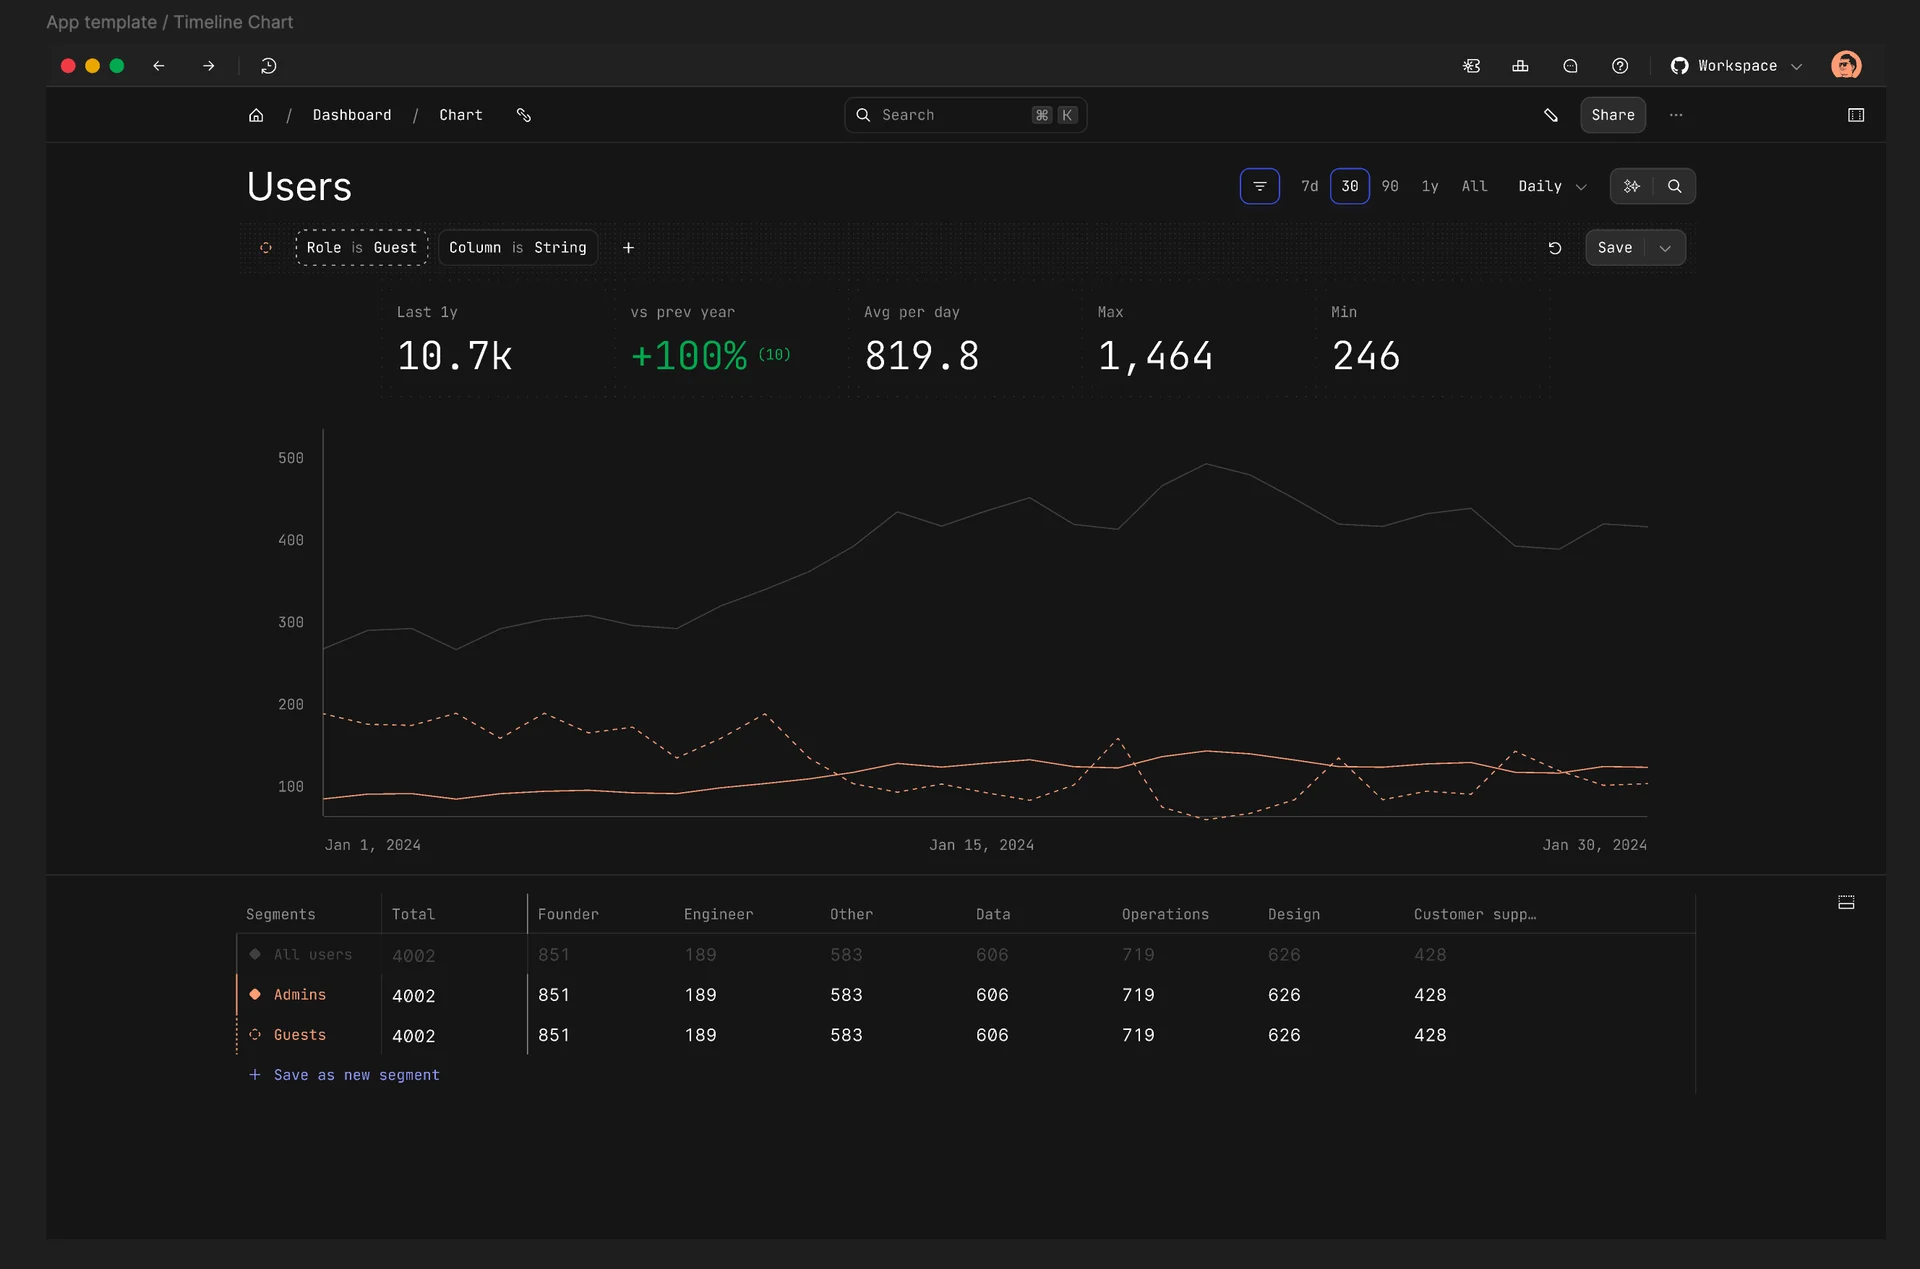
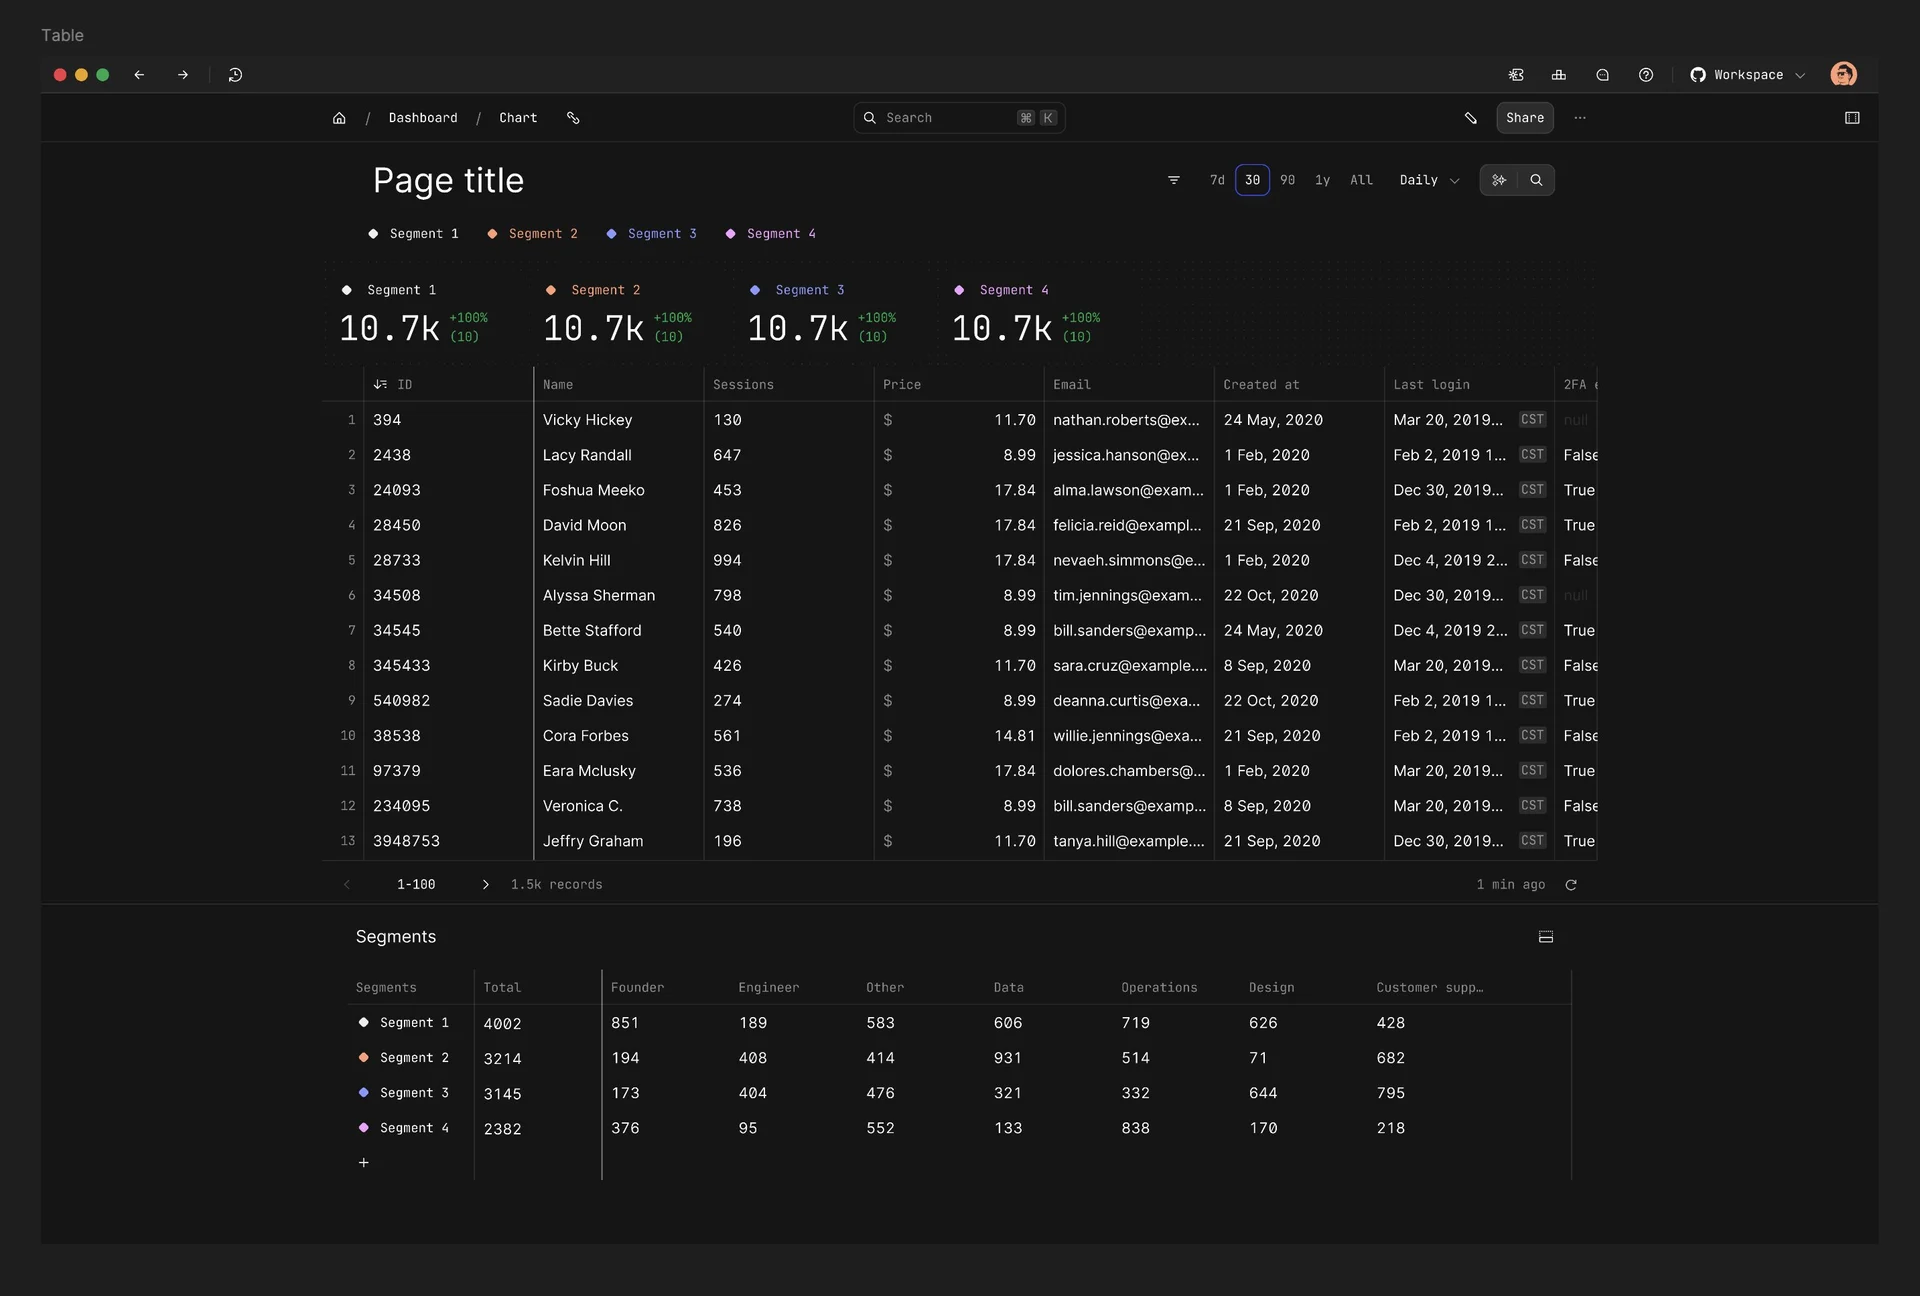
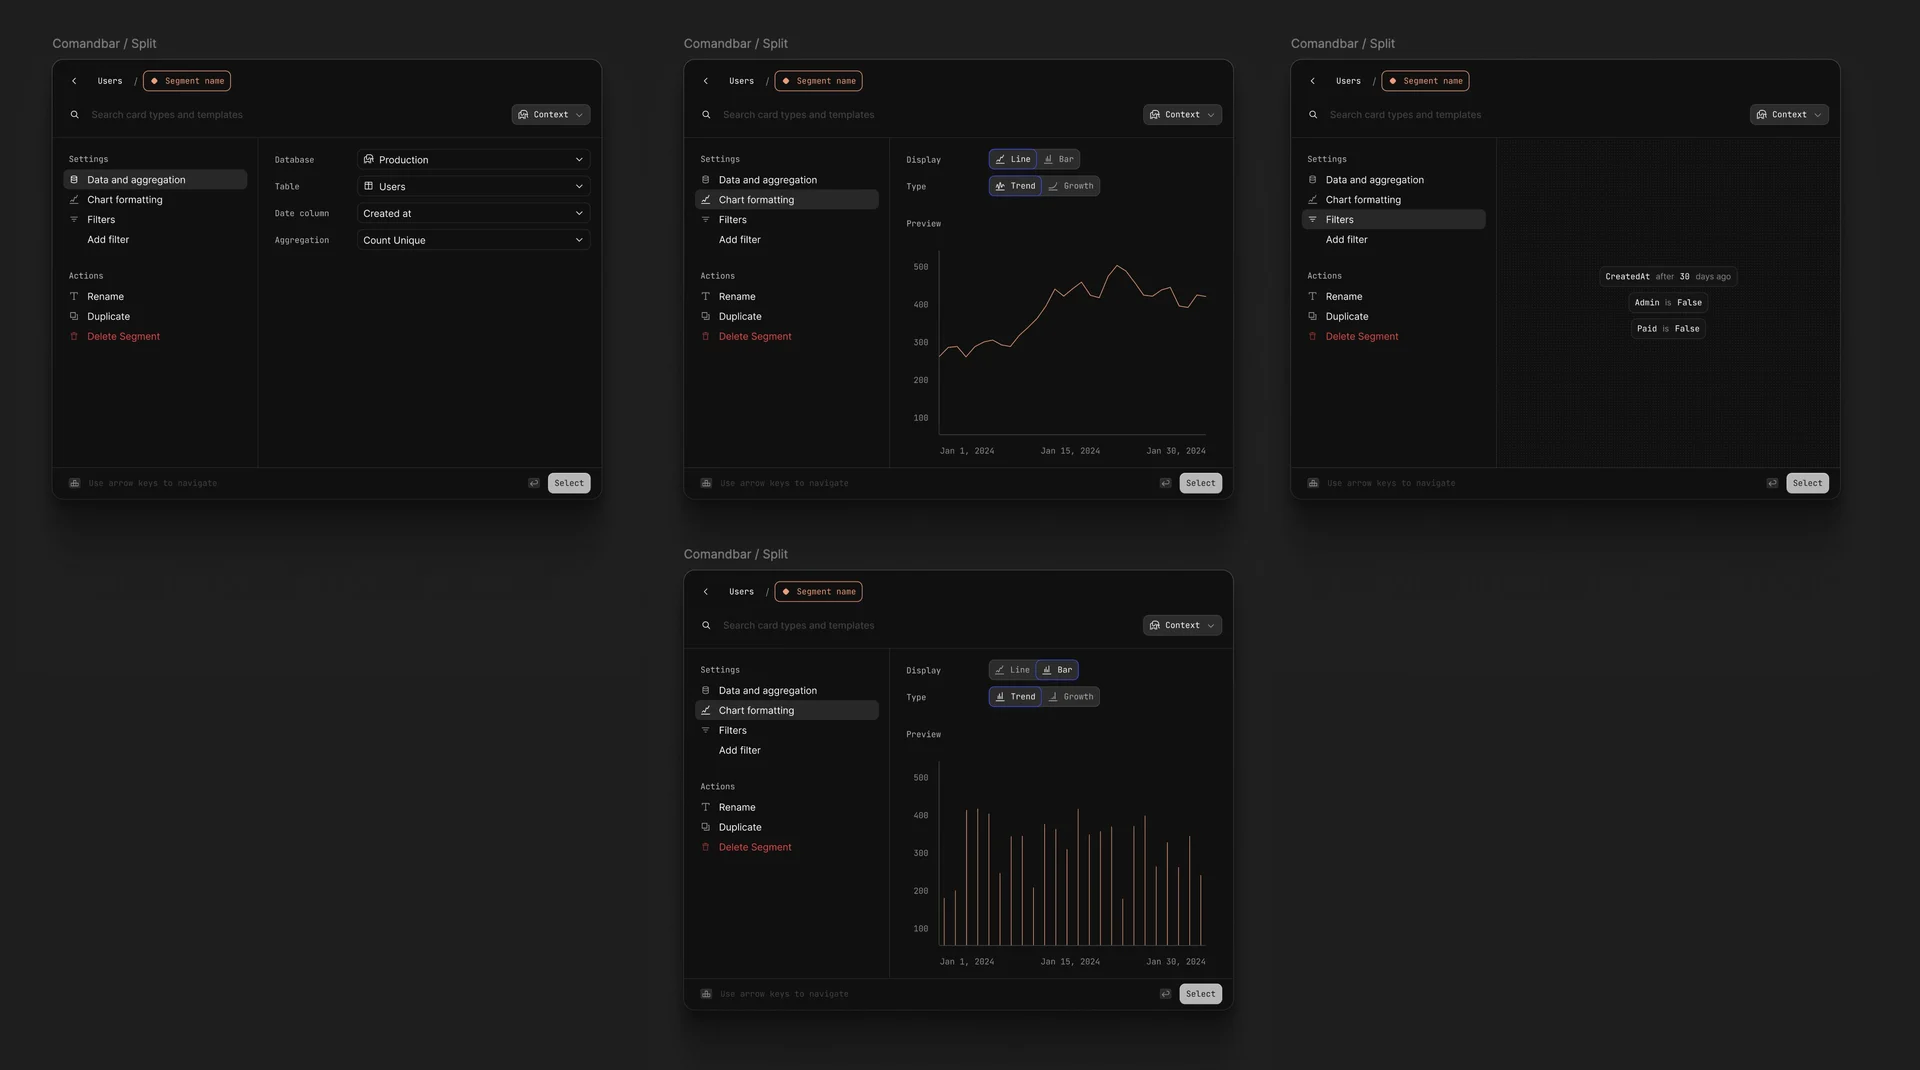
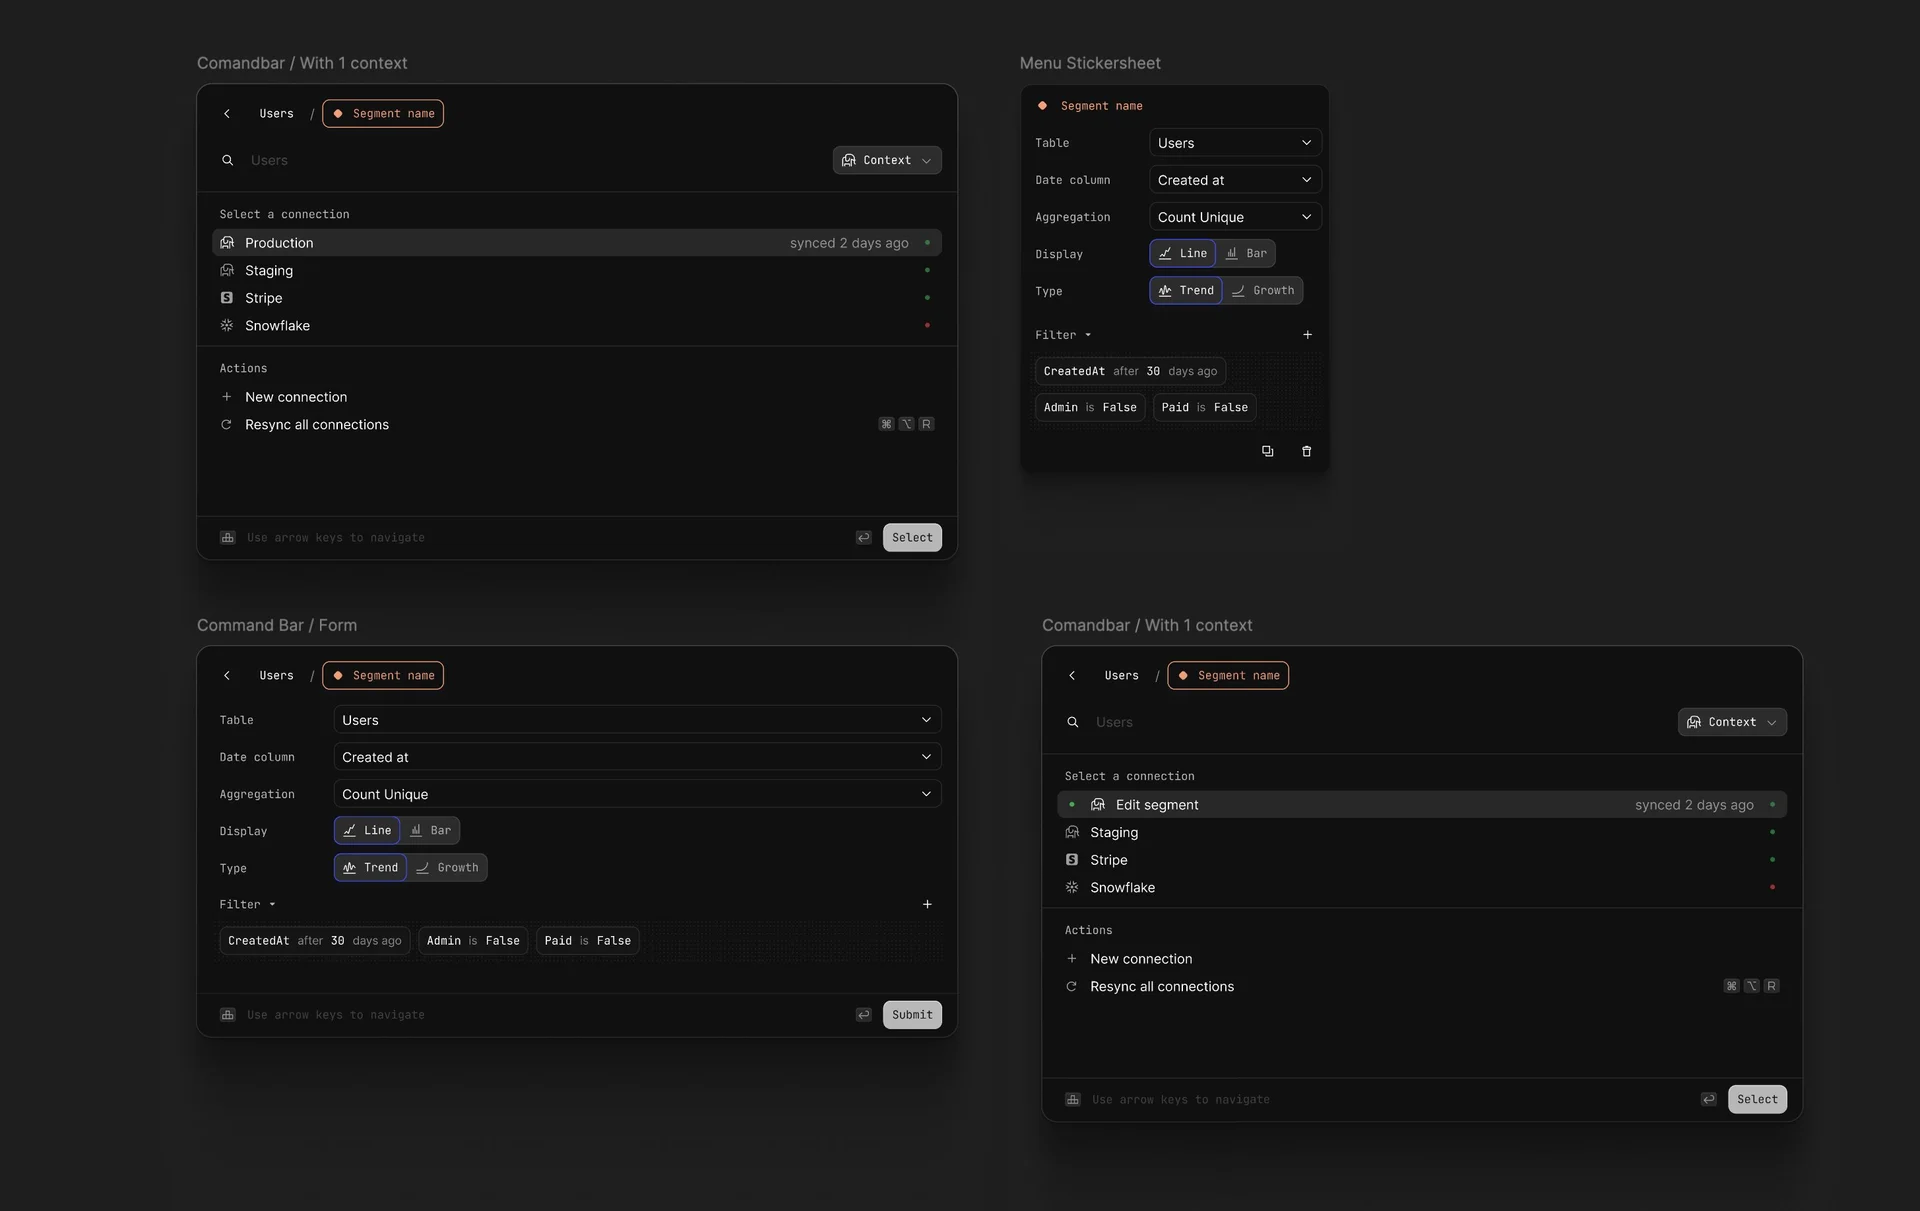
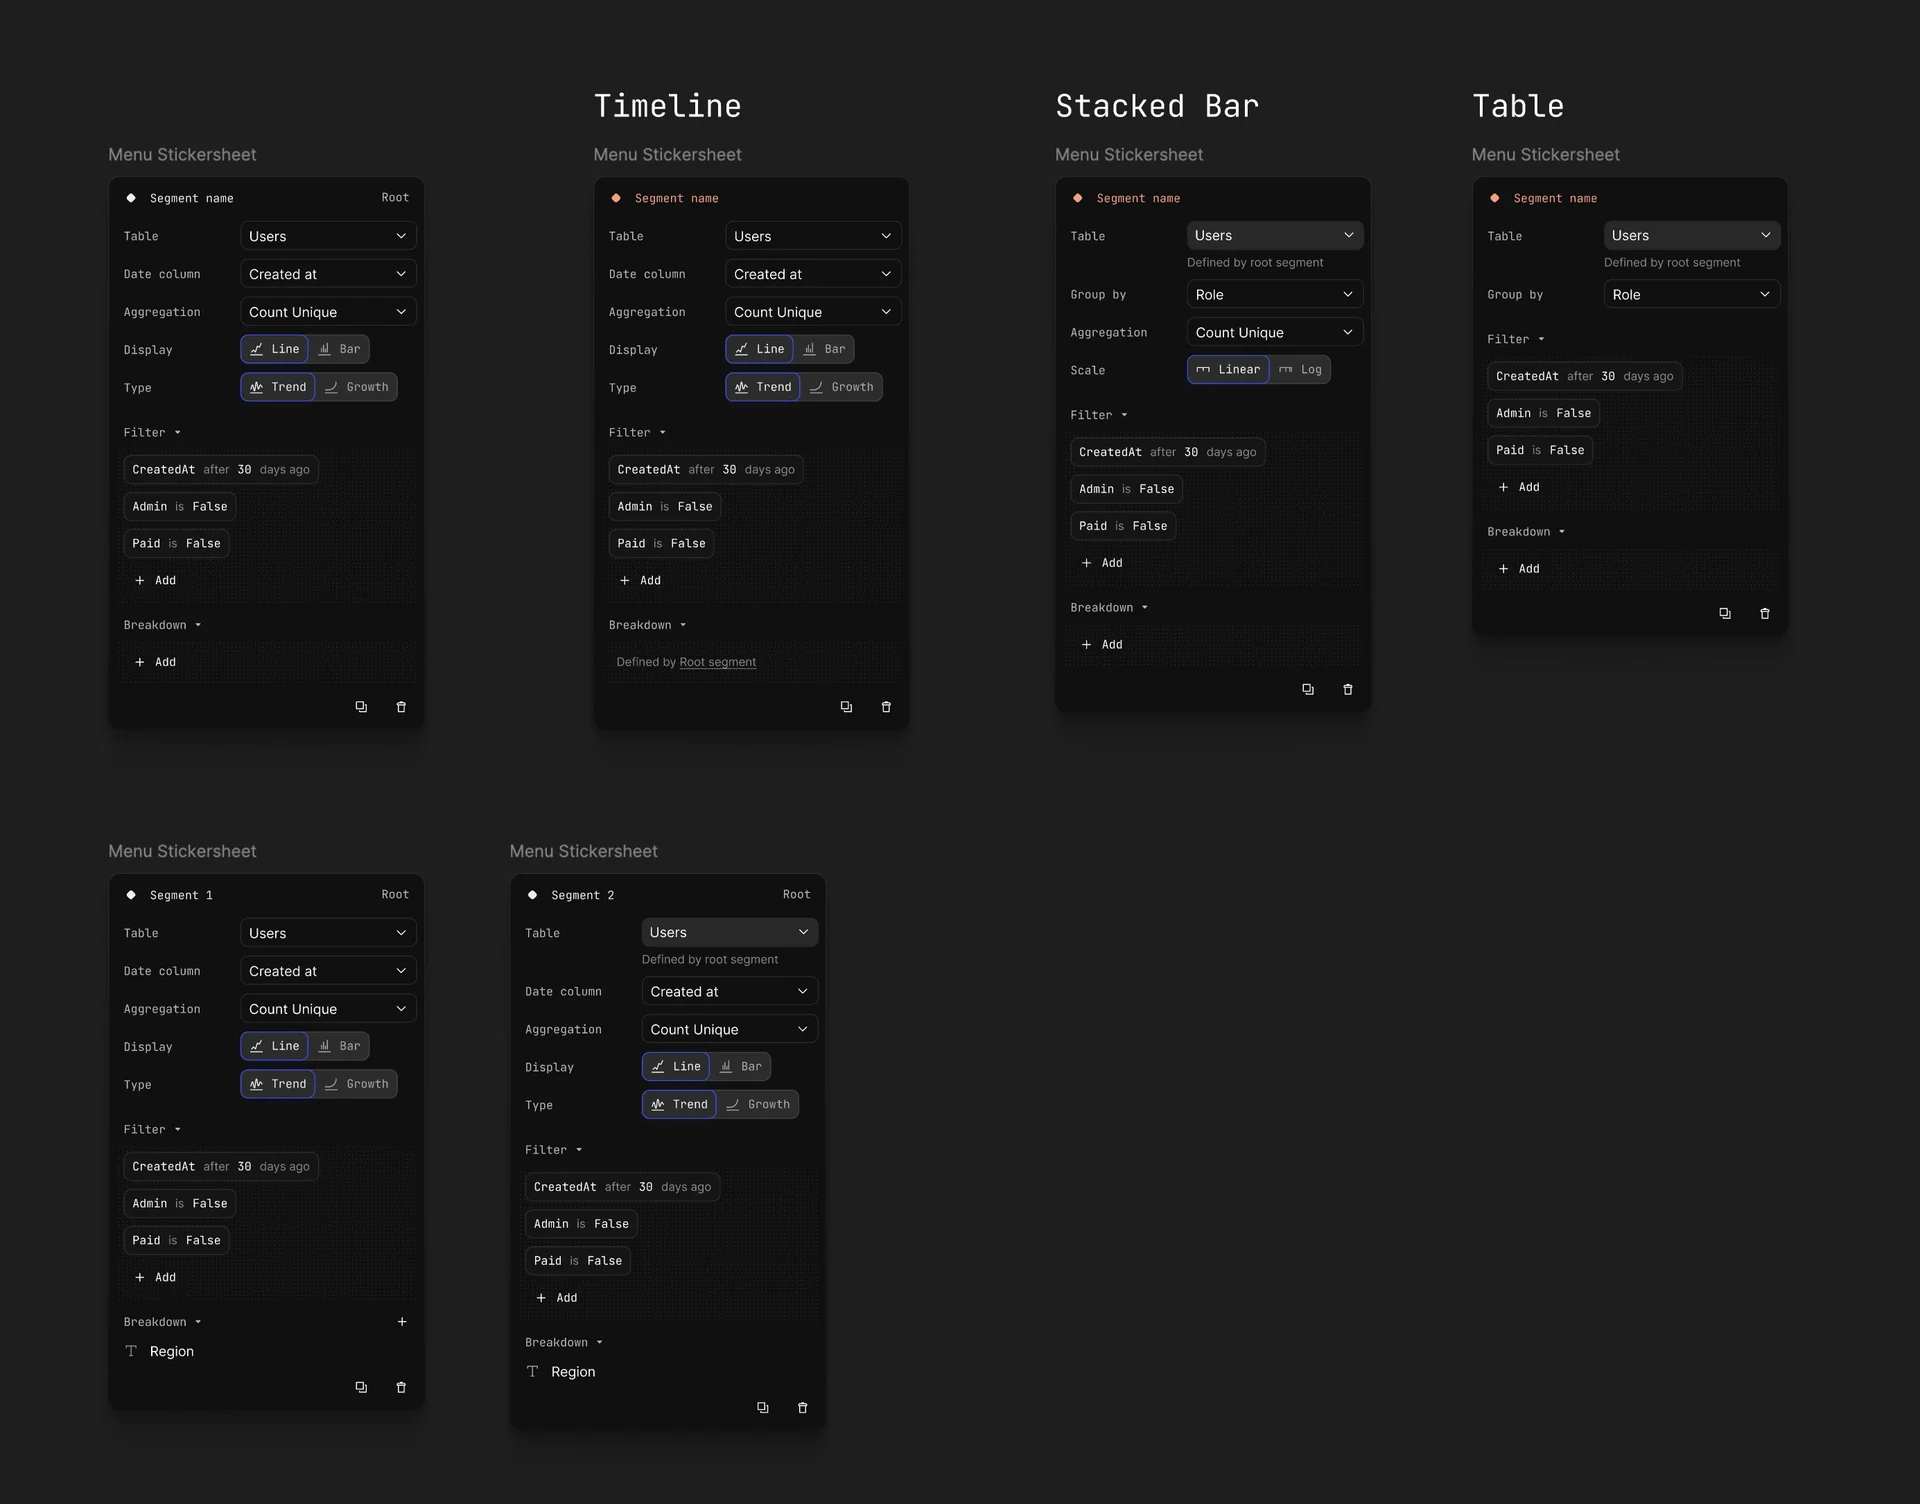
Here's from our early exploration around grouping data. We actually had a crazy robust system of breaking down data into different segments using filters, not SQL at all. Oh look, more filter designs.
These got fully implemented and they worked in the product. That little table underneath the charts and the main table, was it fully interactive so you could hover over it and see the date that corresponded with the value? It was pretty cool.
But maybe two or three months in, we realized that the AI was going to be good enough for us to abandon all of that.
Also, the flow was confusing. It was impossible to create prototypes for. People were struggling with it.
And we realized that SQL would be better for migration from people who had existing queries and BI tools and setup and all that kind of stuff.
So we deleted all of this segment work and went AI native.
The SQL editor and the return of the sidebar
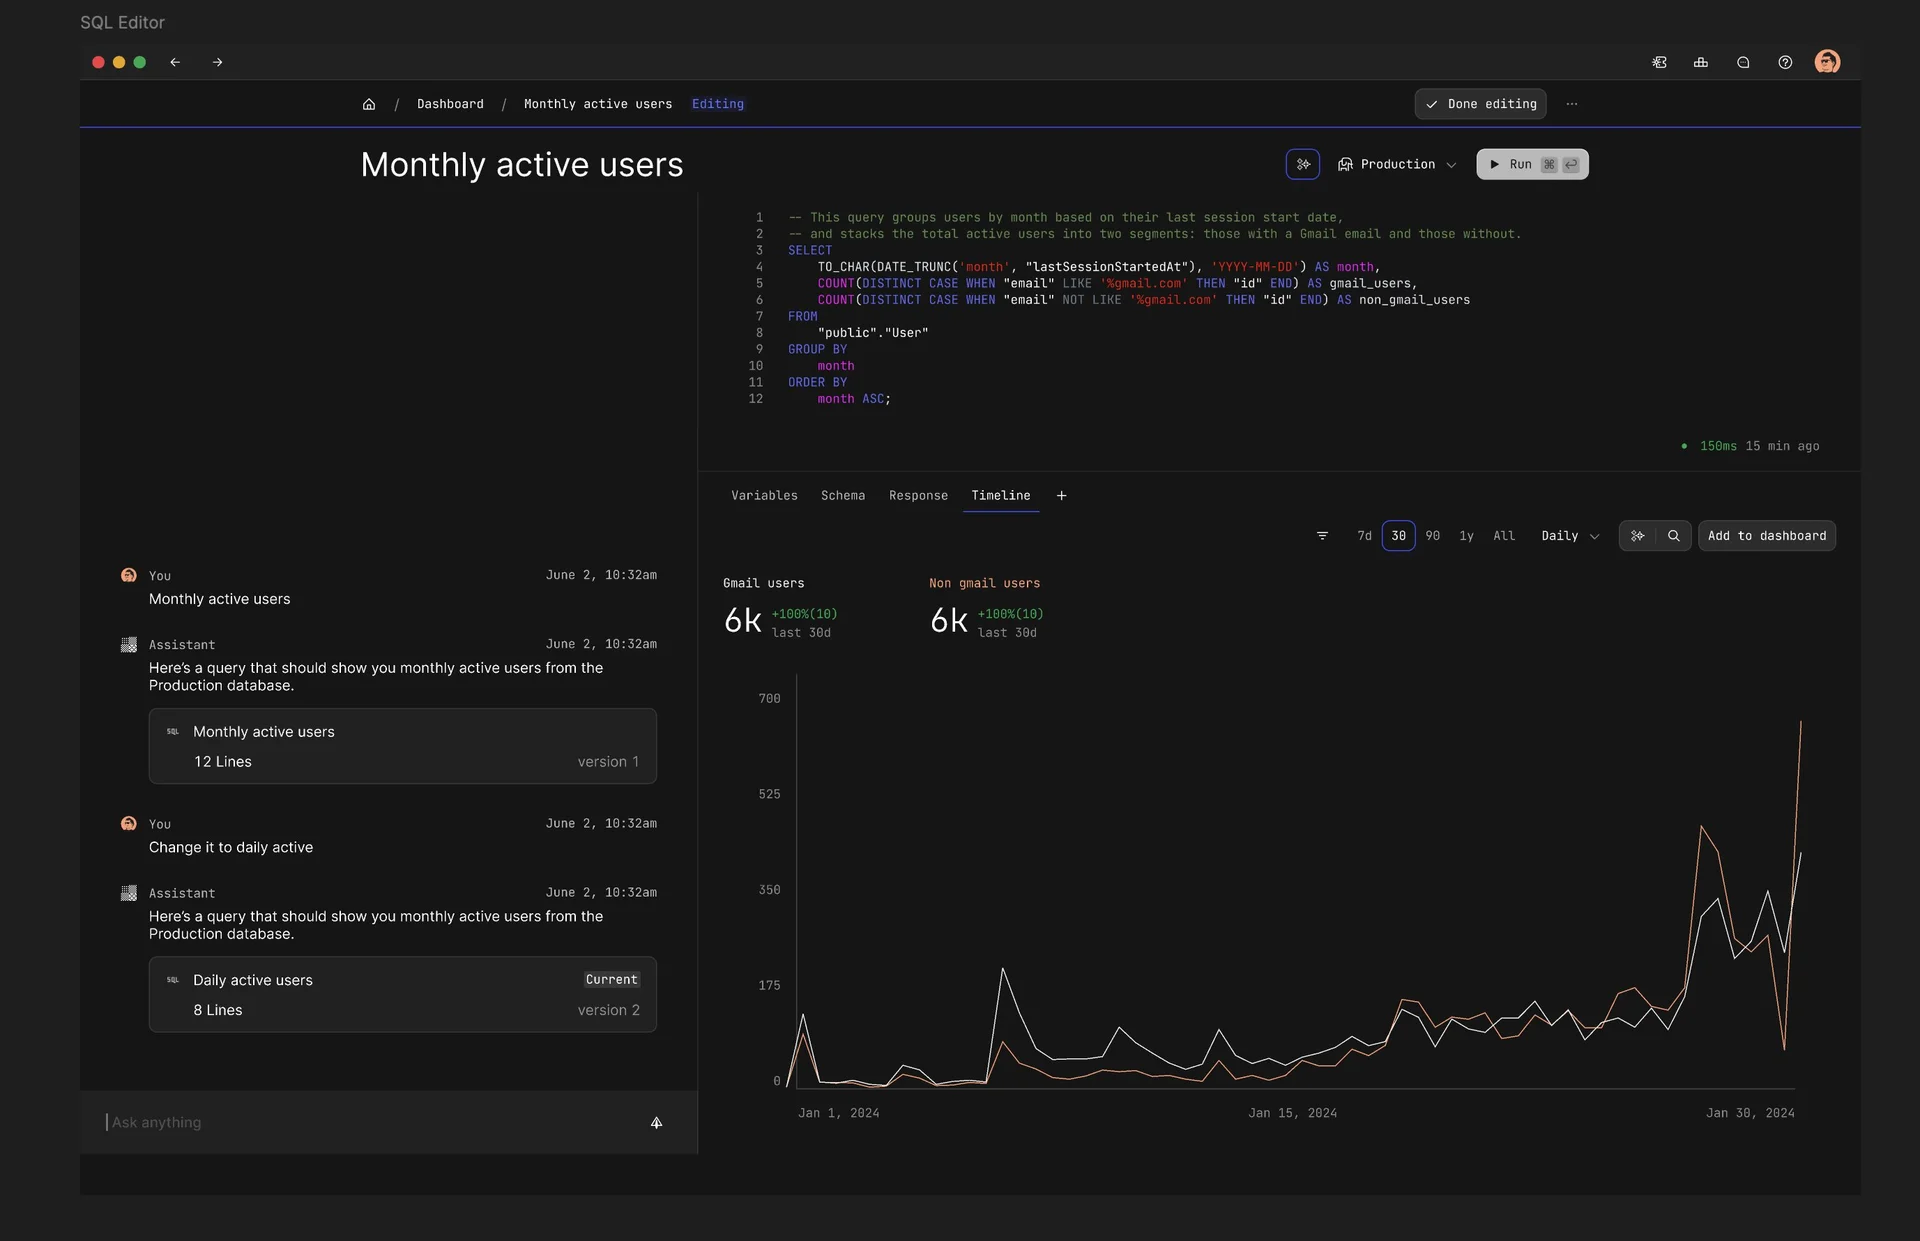
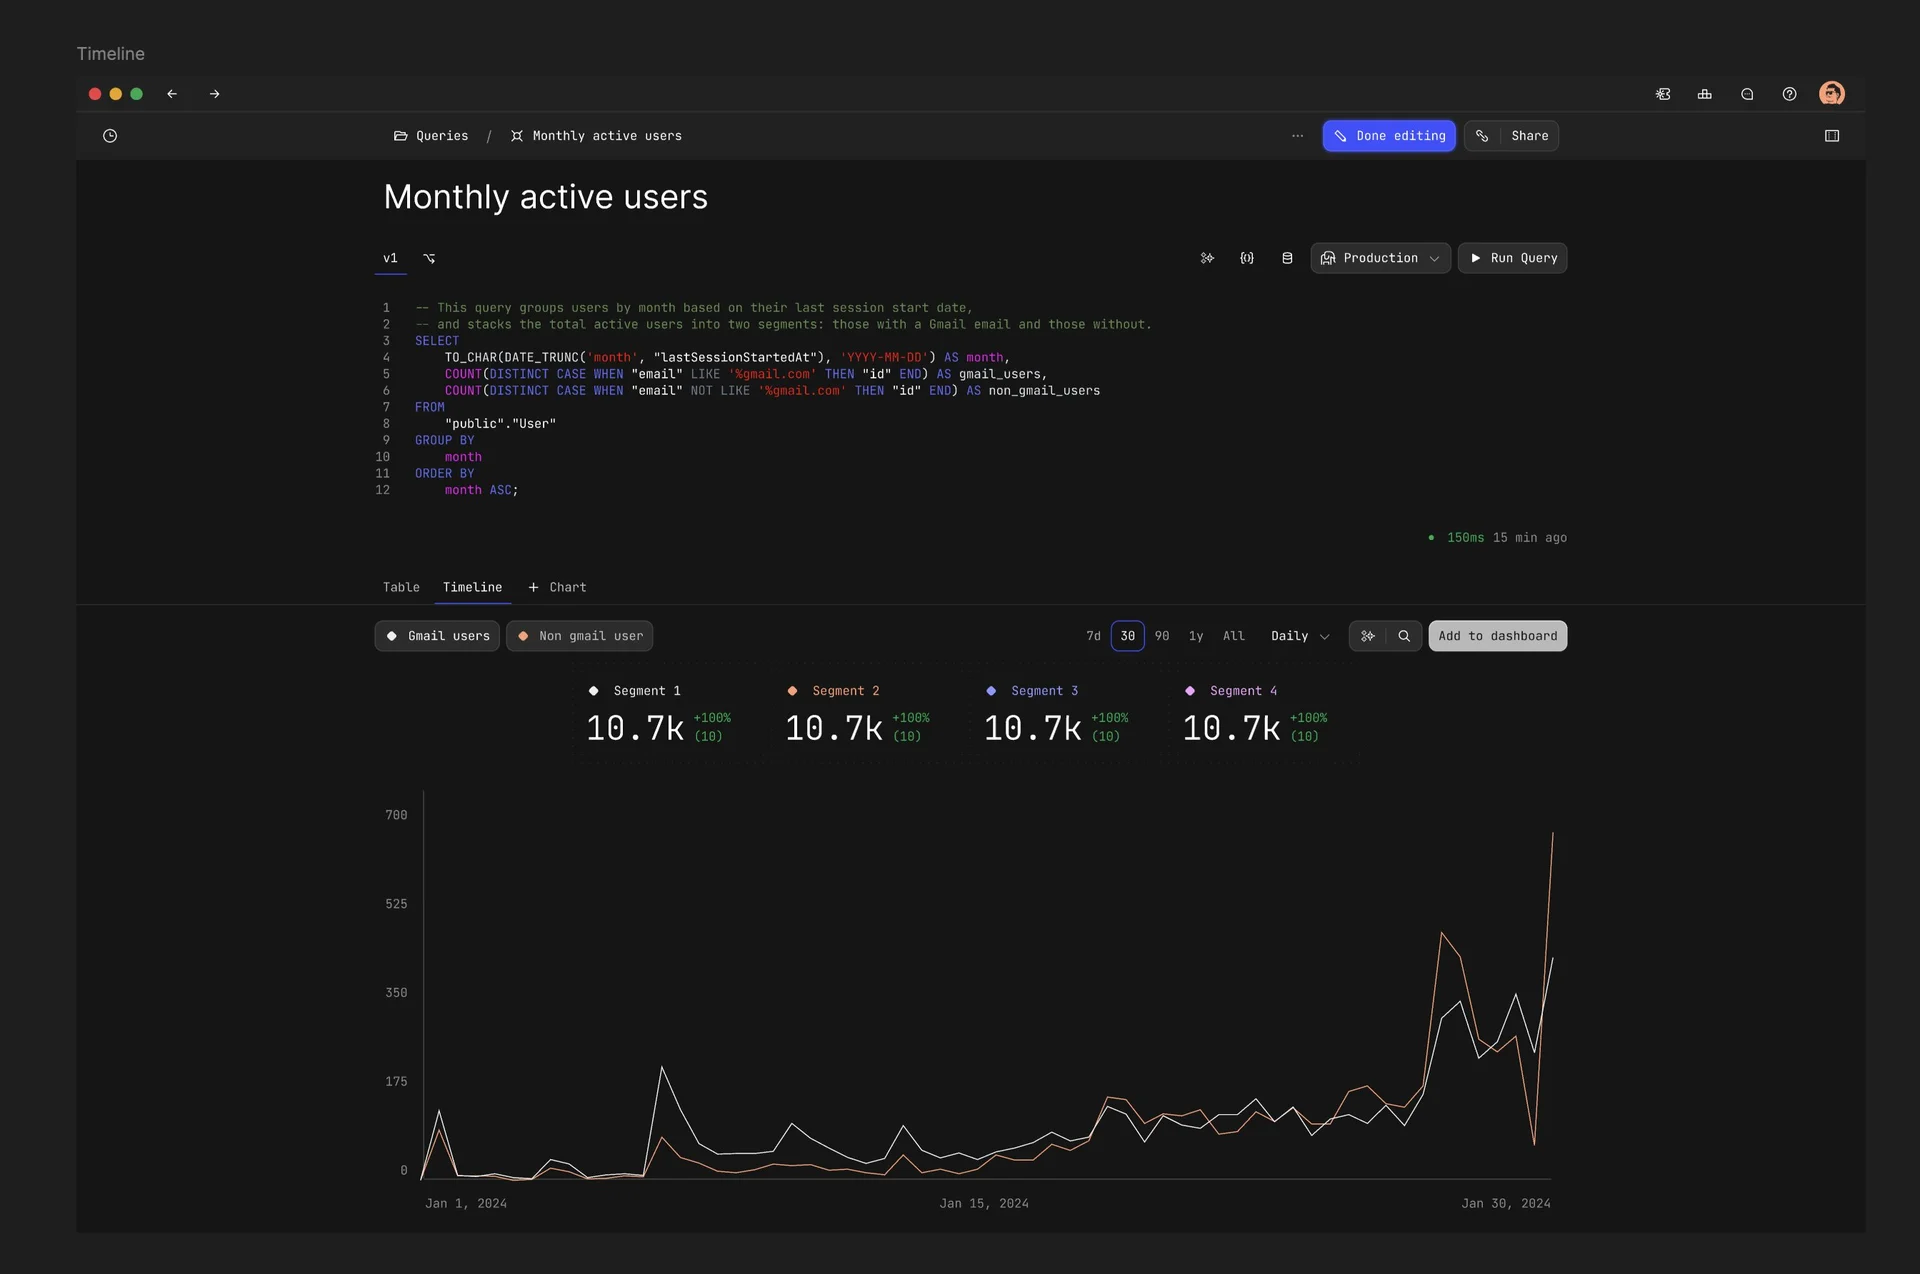
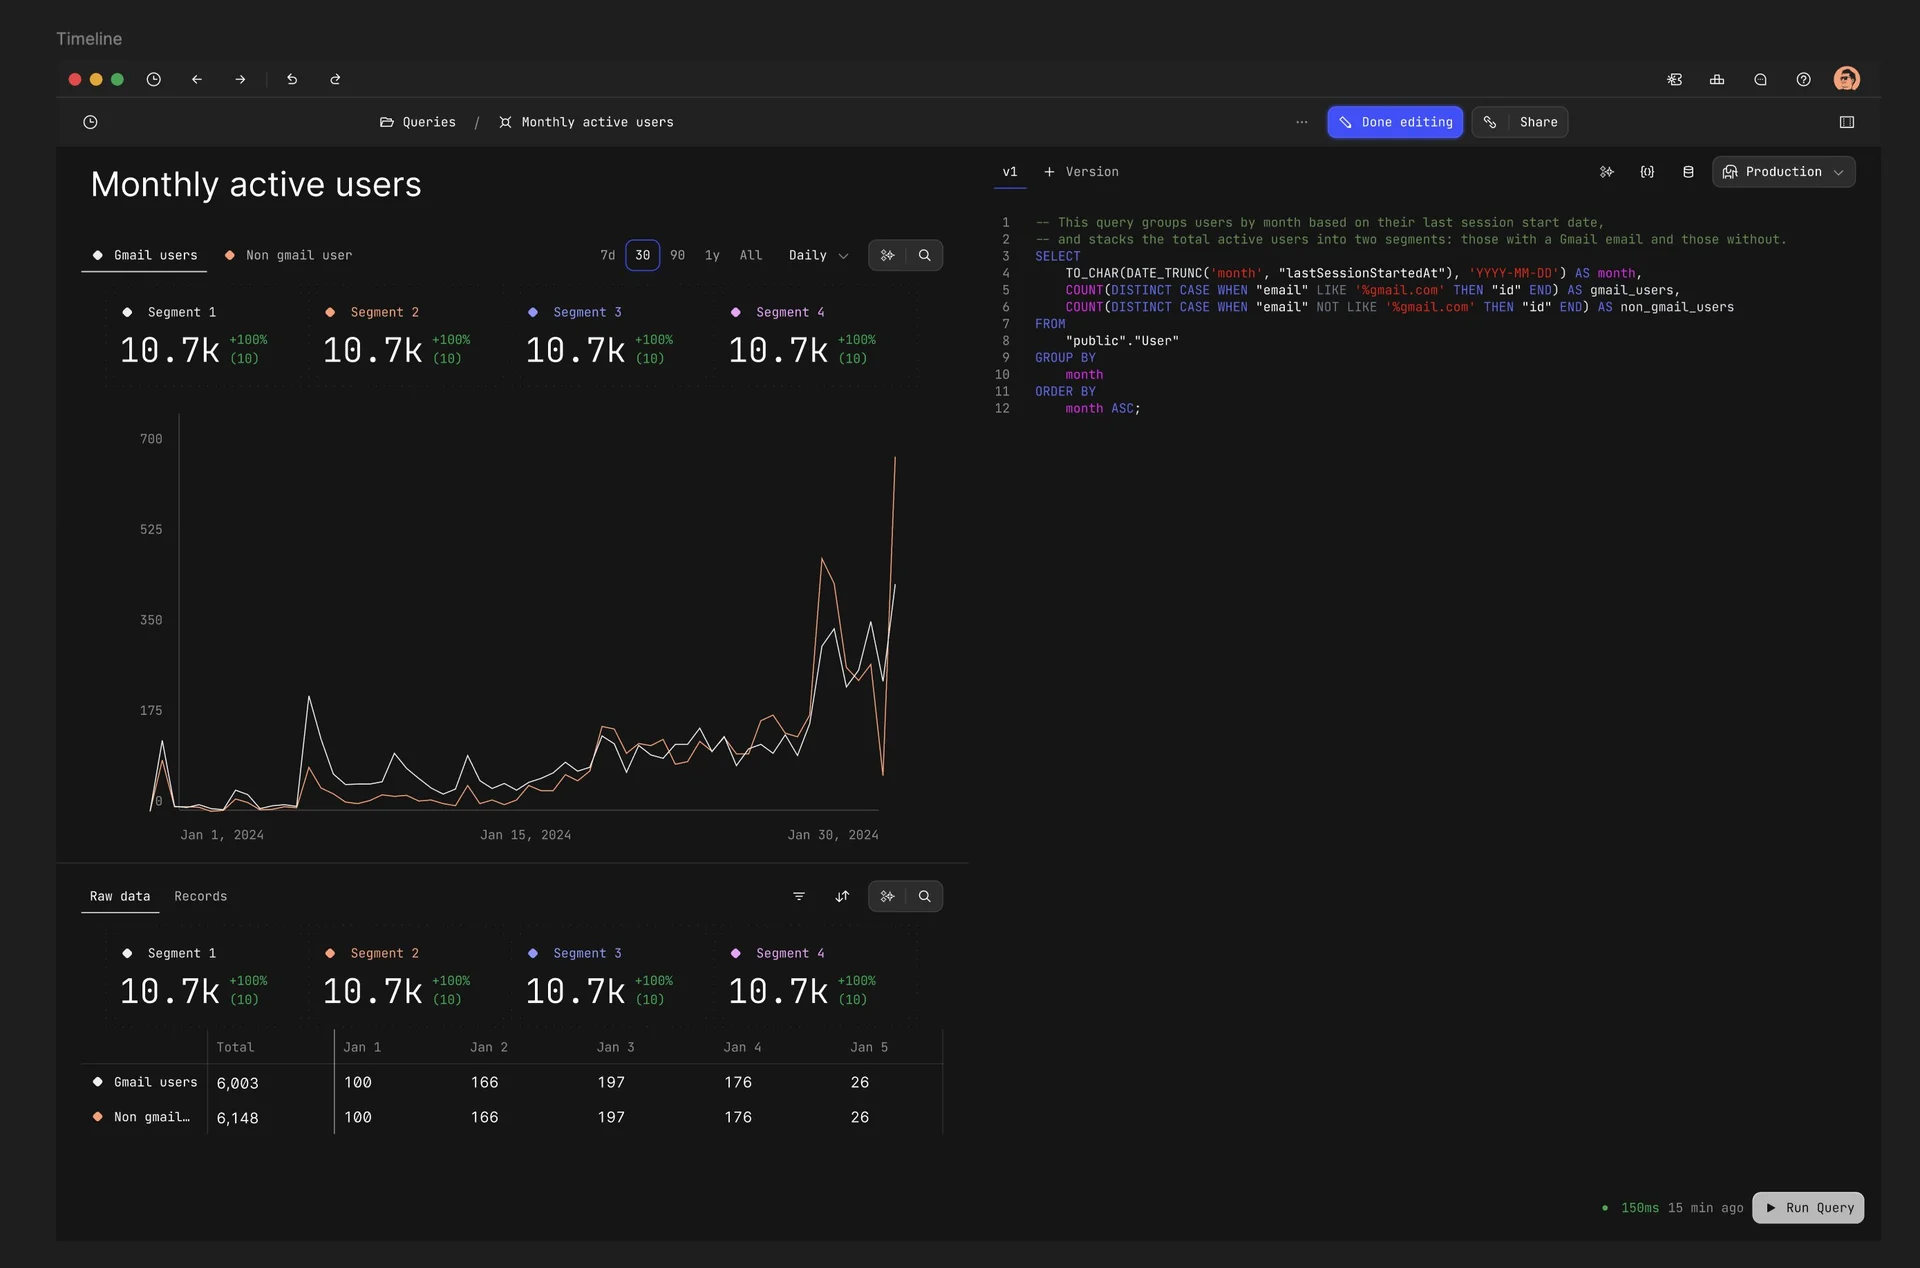
But man, the SQL editor has been a pain. I said earlier that actions were maybe the most complicated feature, they pale into comparison to this SQL editor.
I went through a bunch of rounds of layout yoga with this. Should I put it on the top, on the side, on the left, on the right? Should we do forks, edits, multiplayer? Which one's more important, the chart or the SQL?
How do we show the schema? How do we make you interact with the schema? Is the chart interactive? And on and on.
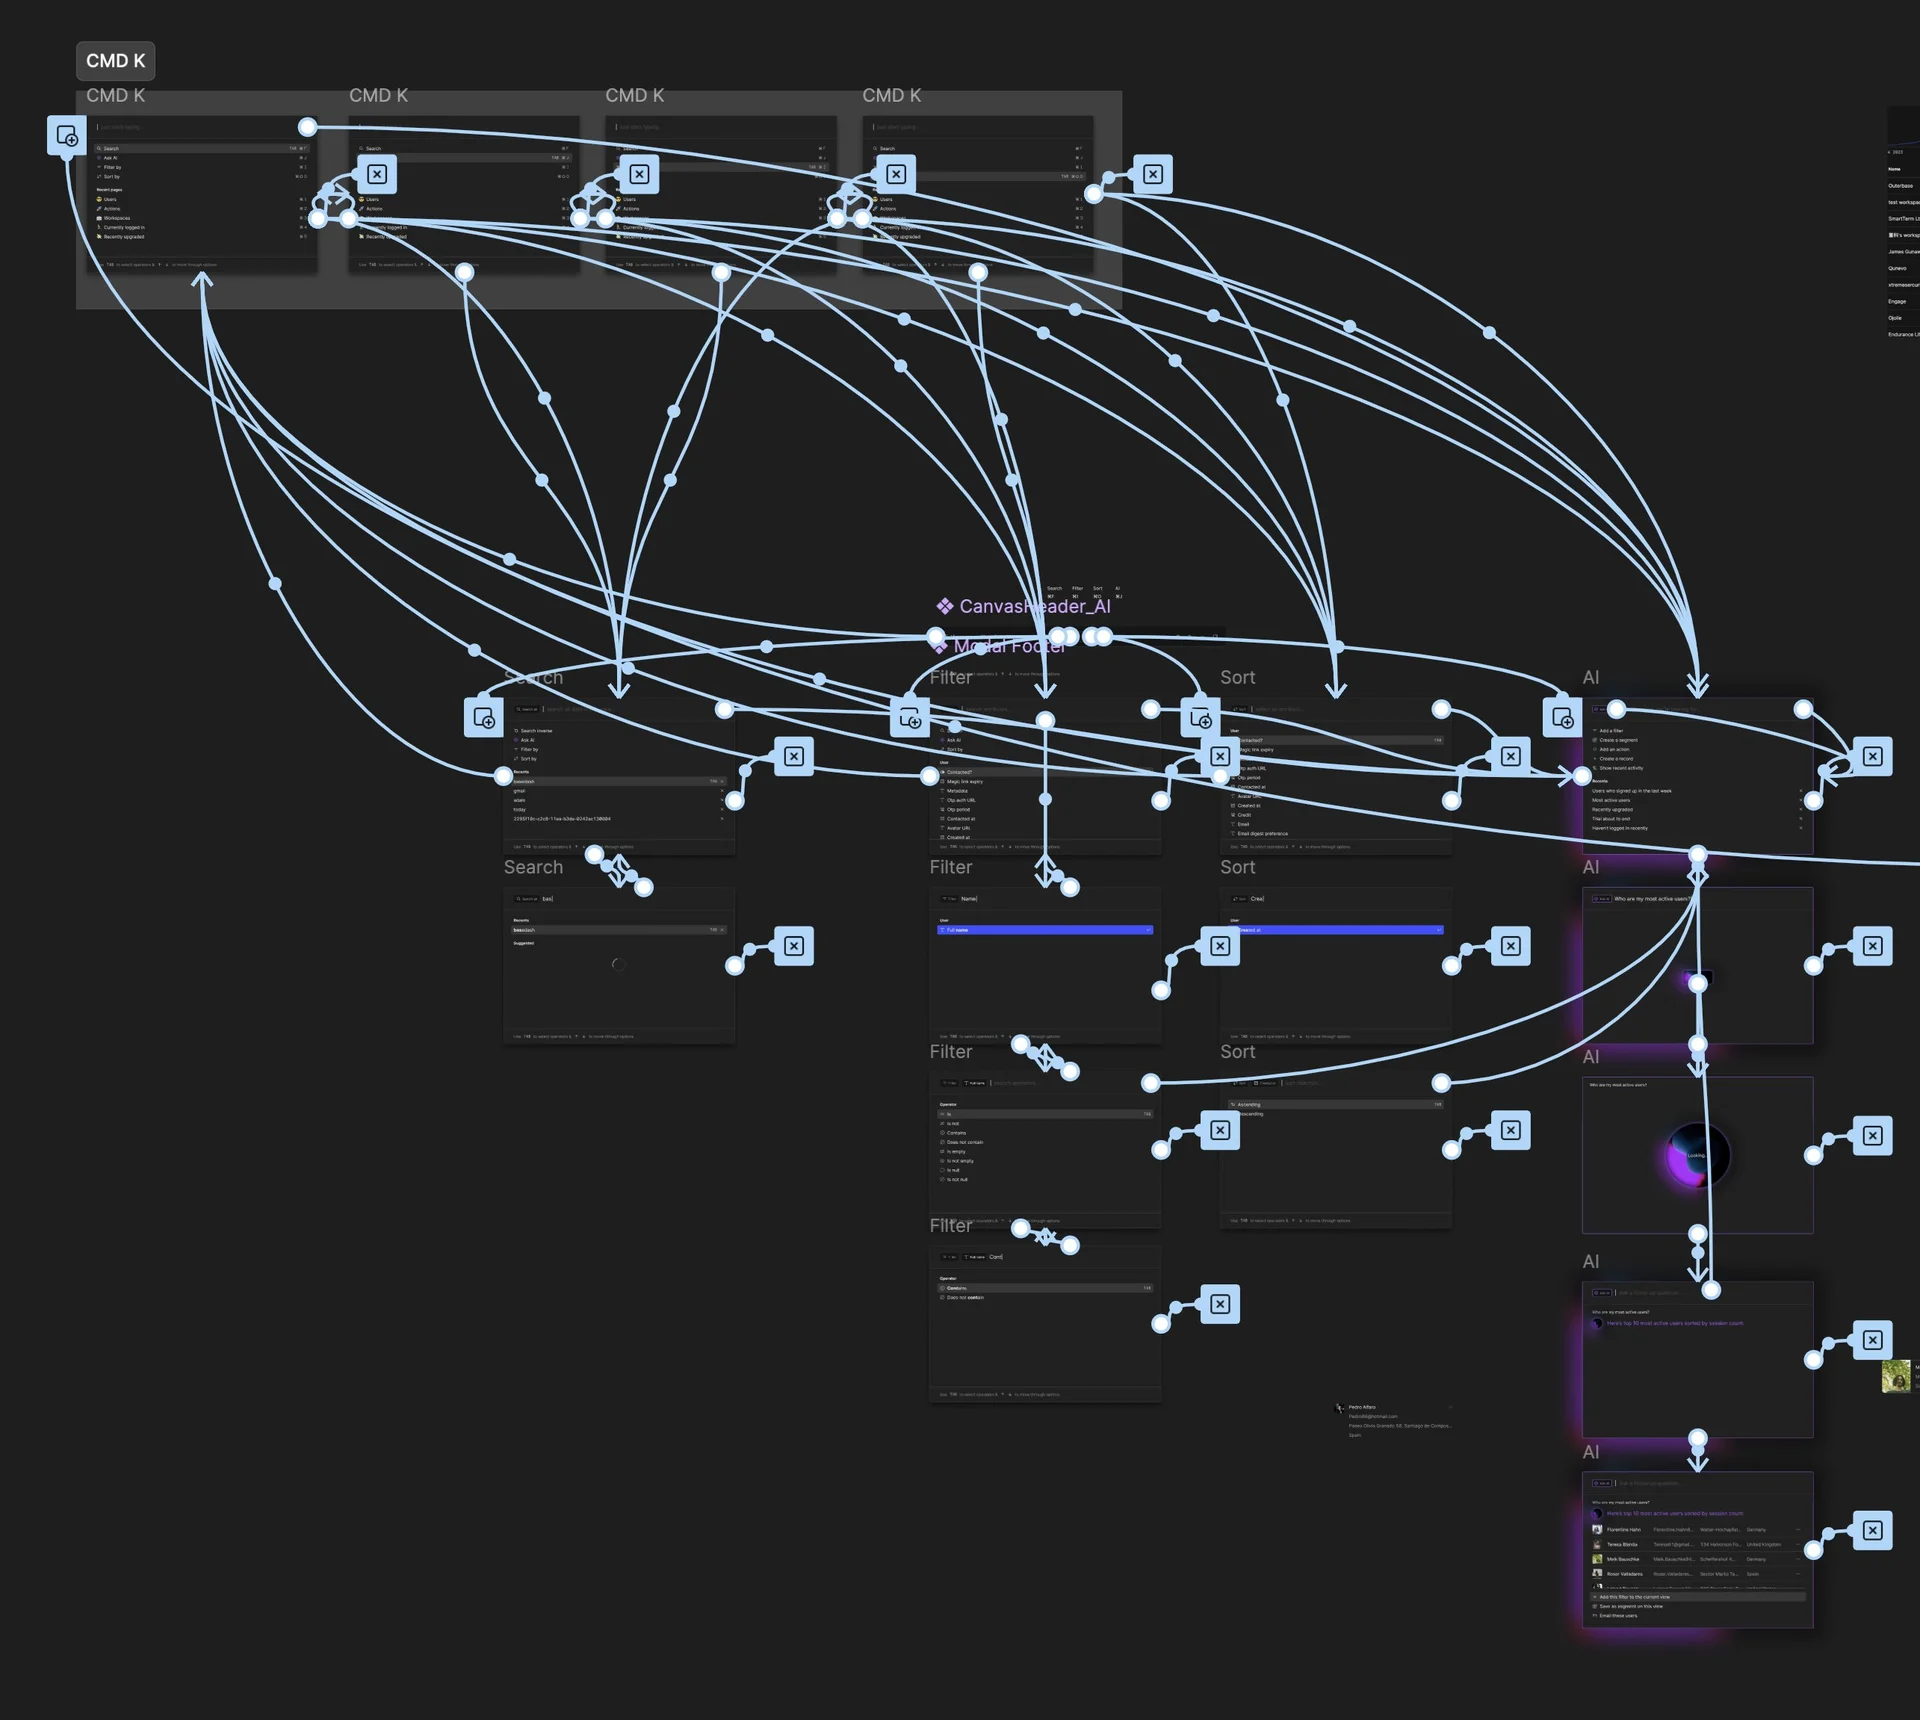
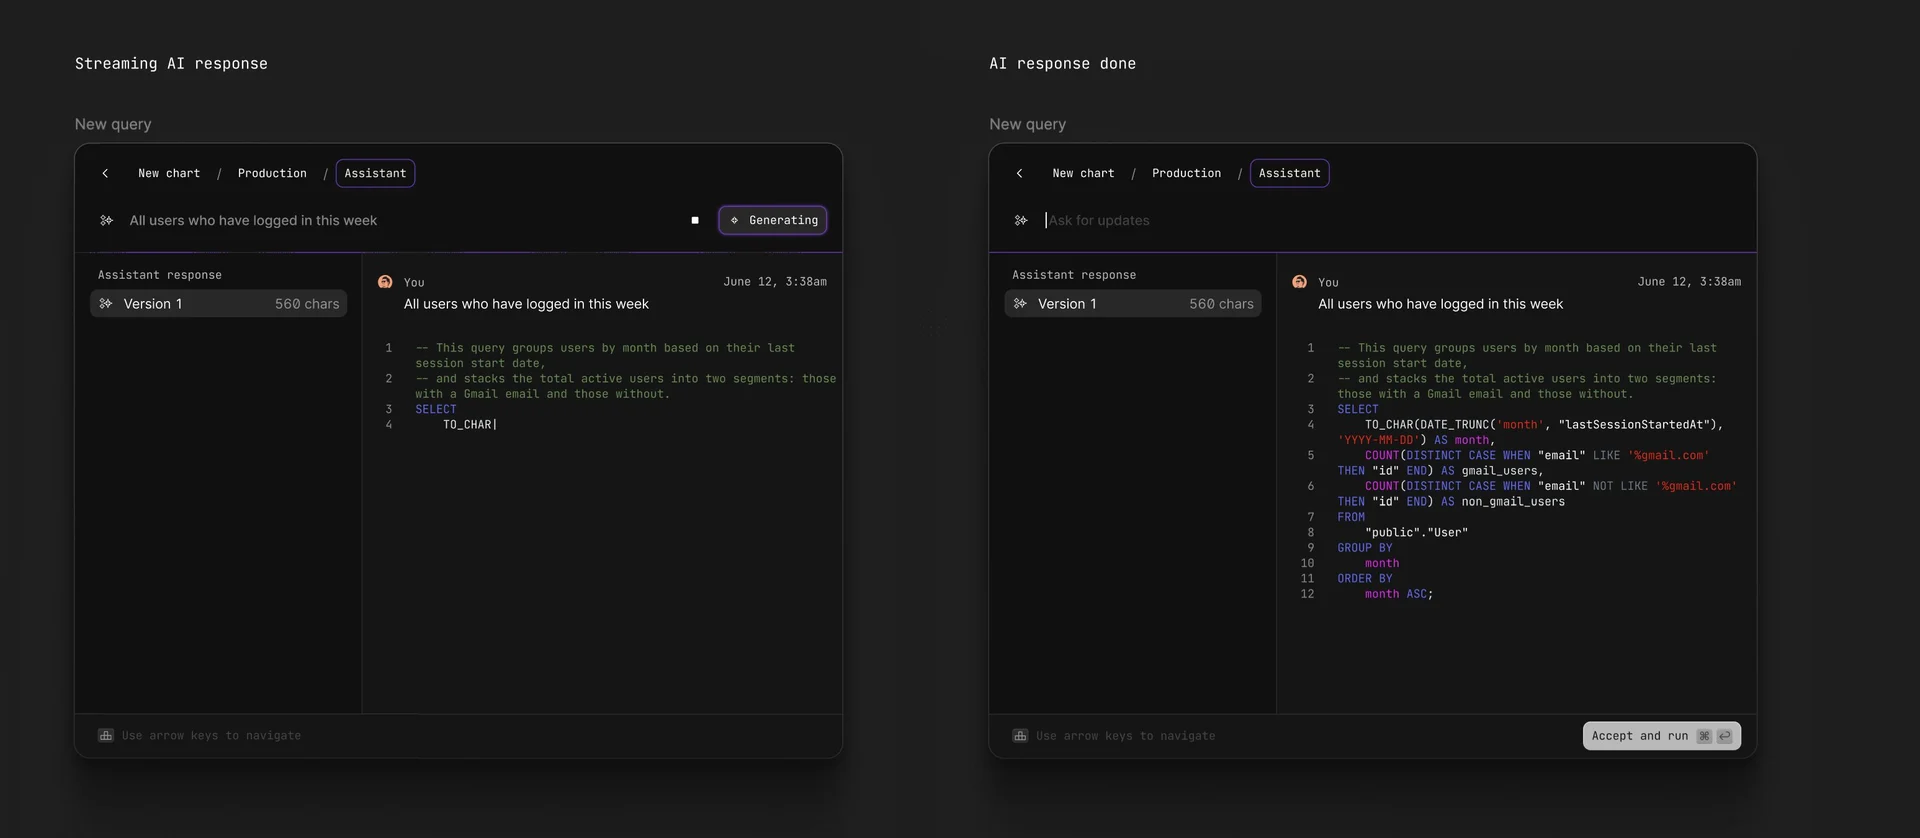
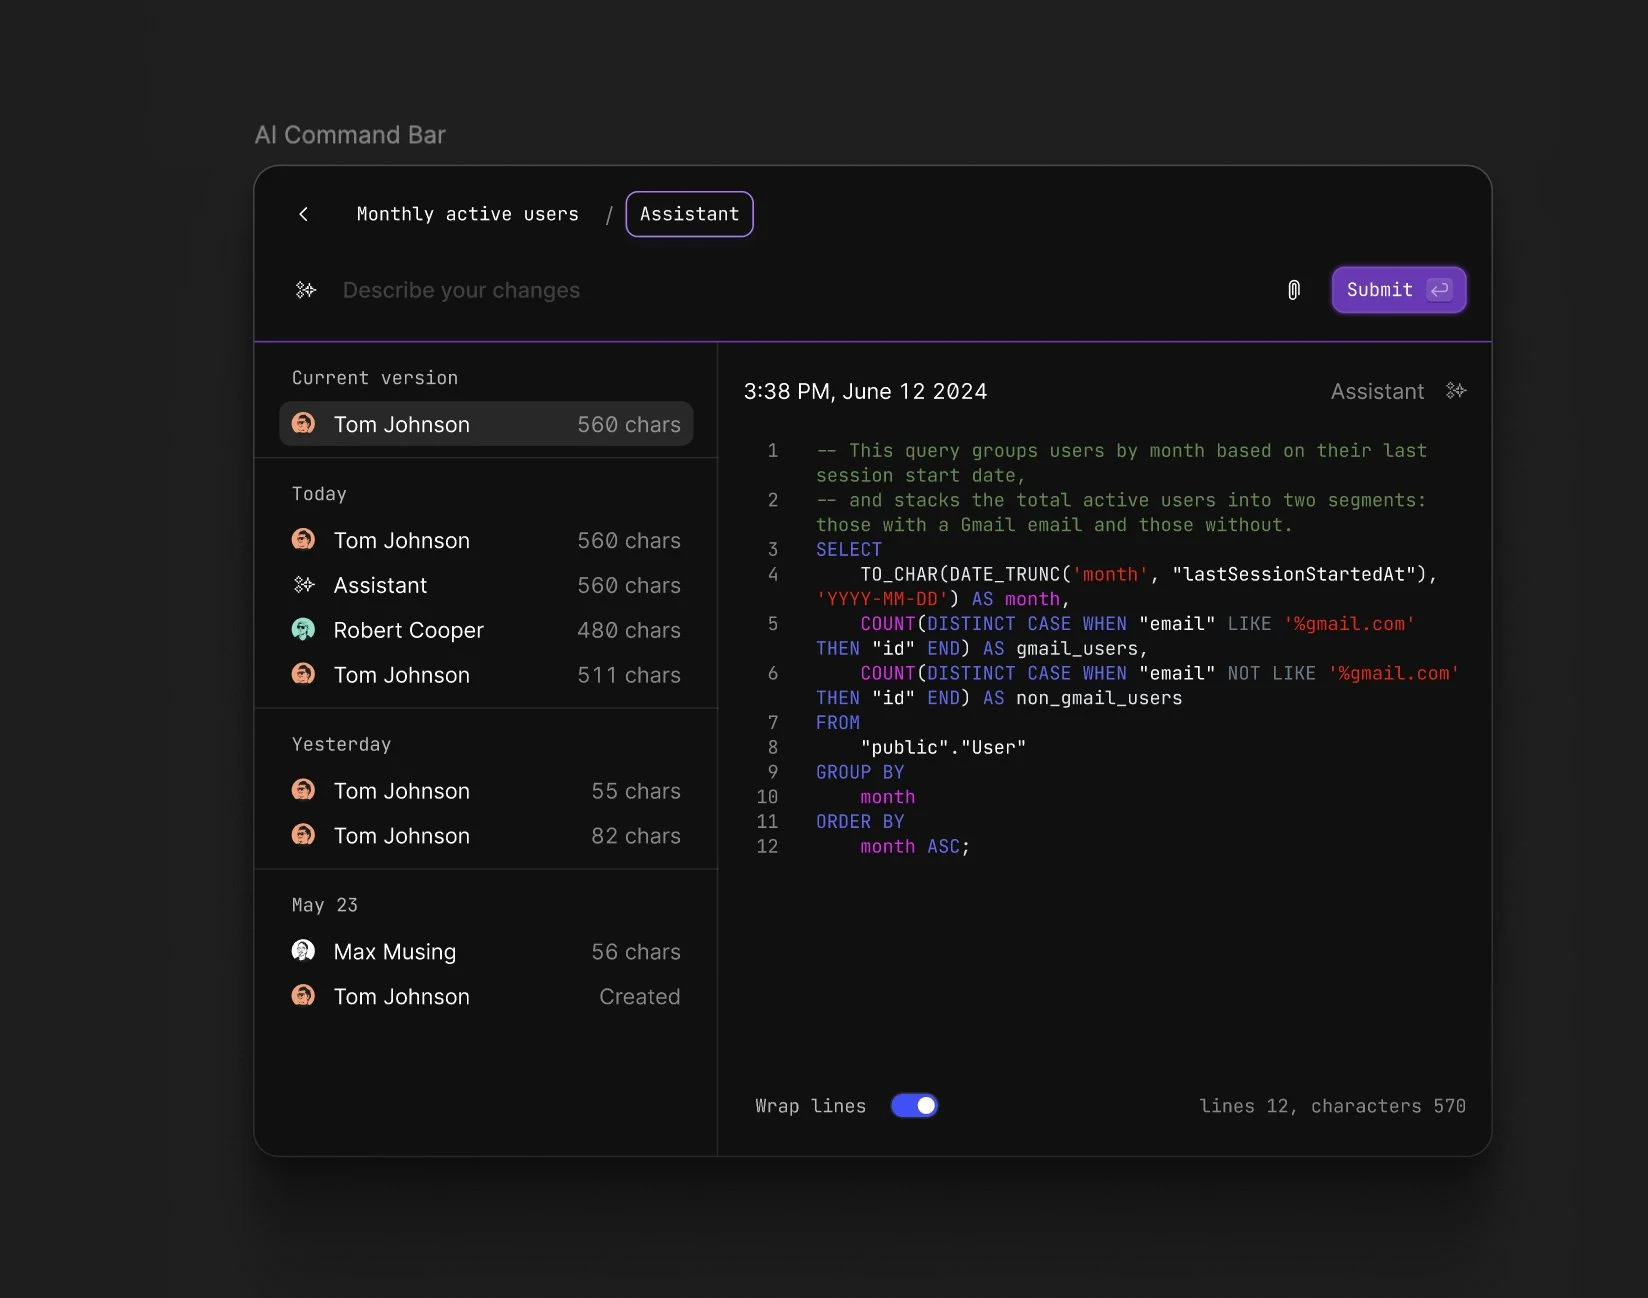
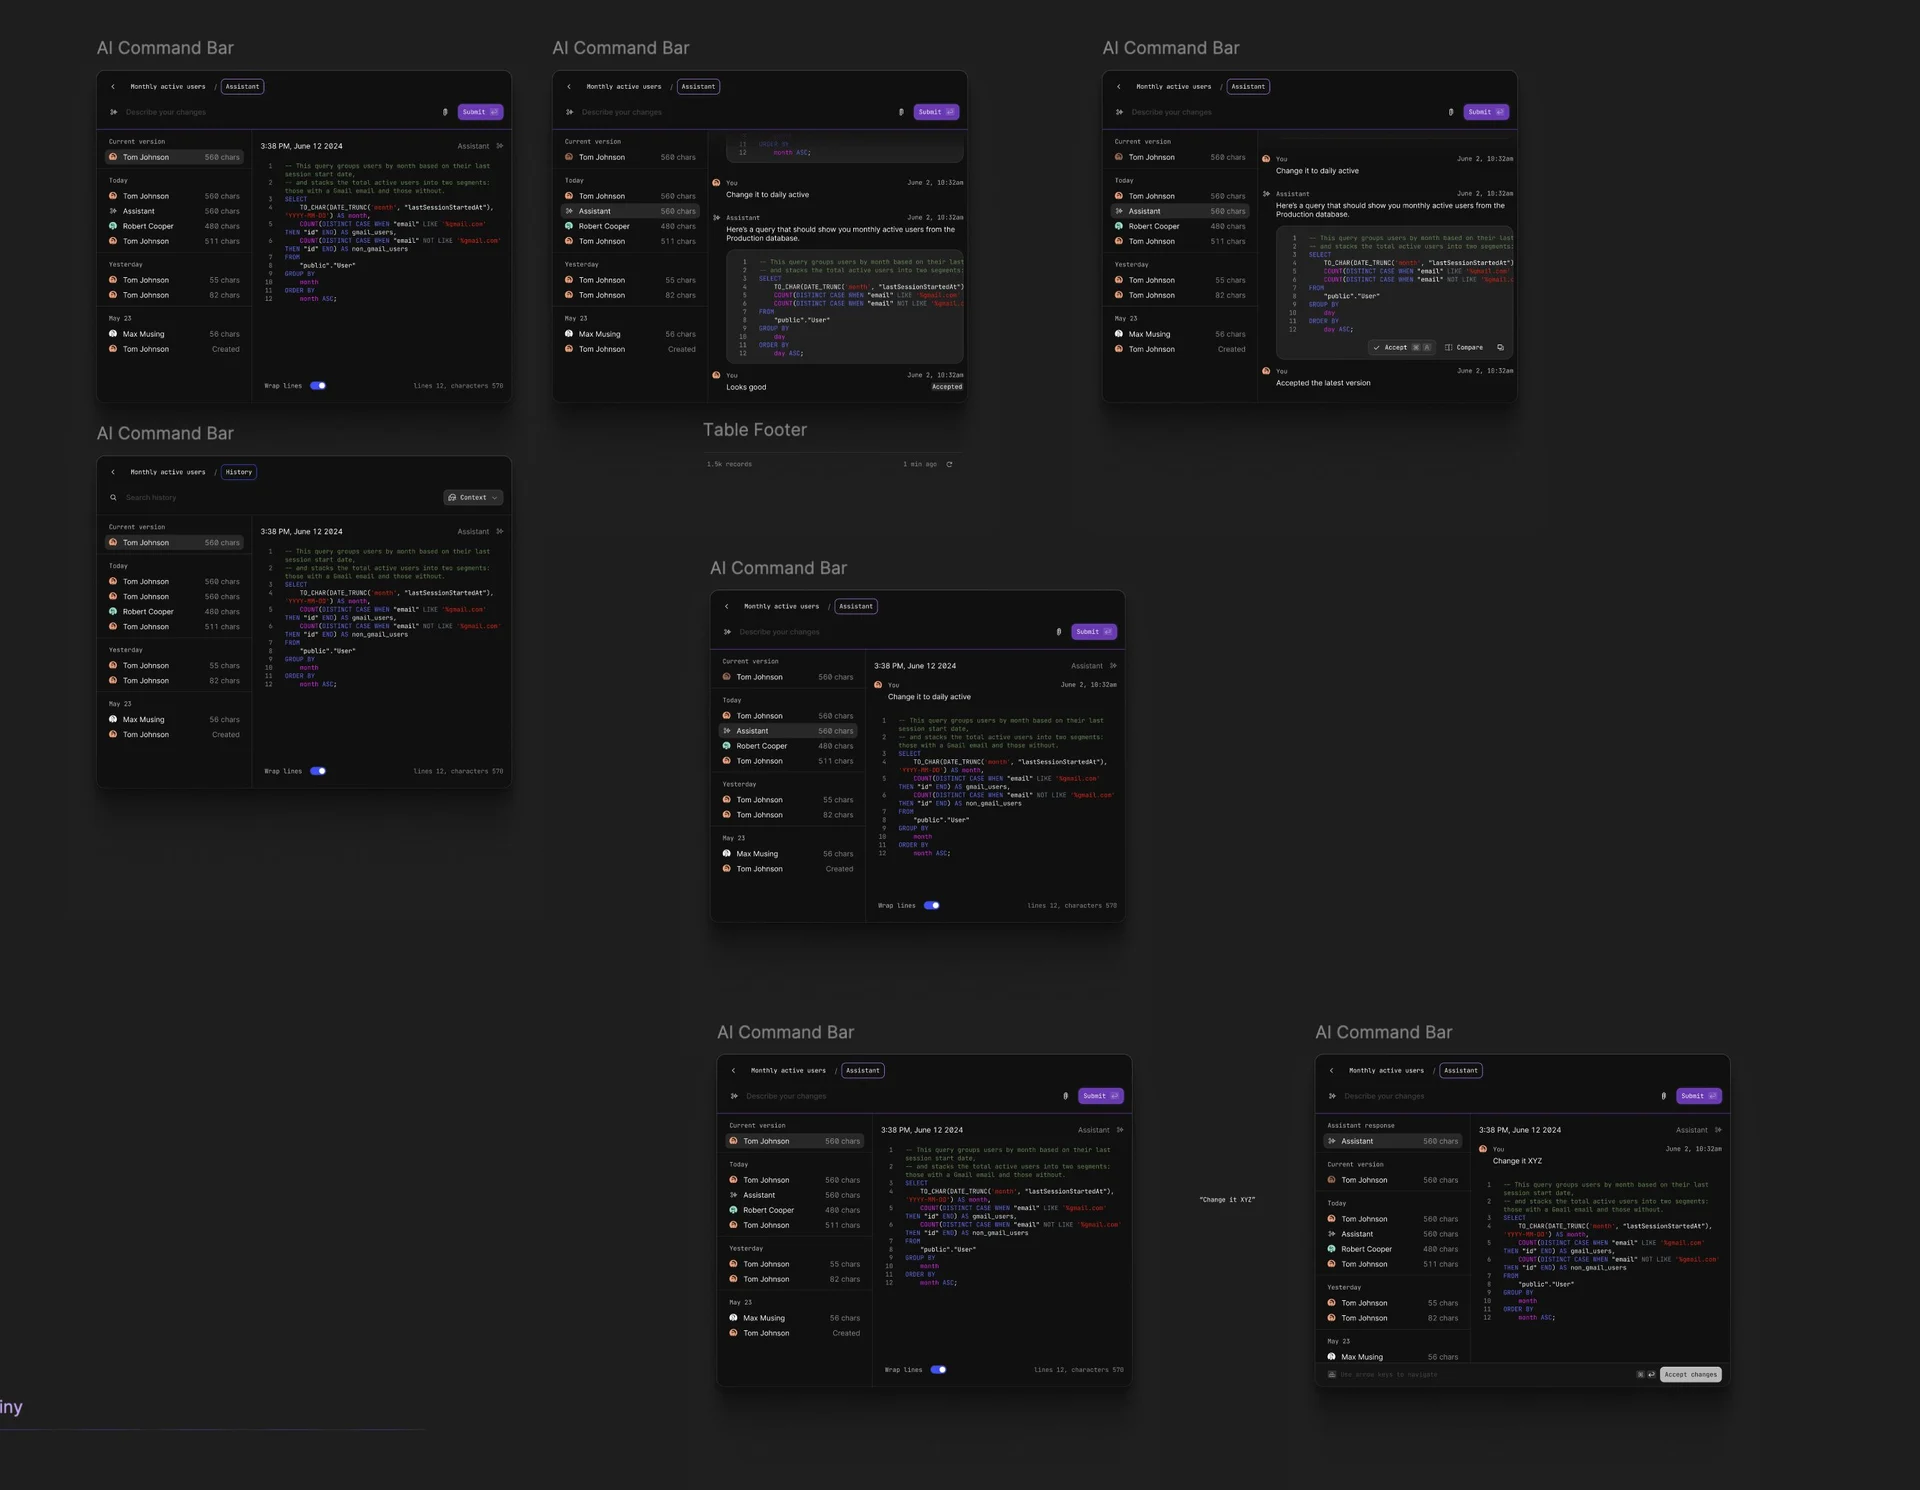
I also REALLY tried to make it work inside of the command bar.
Rationale there was that the command bar would be persistent everywhere so you could cause the AI to be added at any point. Very much pulling on inspiration from @raycast on this one, how the Raycast search bar is present throughout the entire operating system.
I viewed AI as this modality on top of data, as opposed to something that was mixed in with them. So it was like overseeing and could orchestrate underneath itself, very much like a modal.
I think this is how AI is going to be implemented (not in command bar or modal) when it's added effectively to things like macOS or the iPhone. Something that is able to perceive the underlying contents and change them. More like a mouse or a keyboard where you're inputting into it, where the AI becomes an input, as opposed to a floating bubble or something inside of the content.
In my mind, AI makes the most sense when it is above, not within the page content. Anyway, this was an exploration to try to make it work with the command bar. It was too fragile, it didn't work. It didn't have enough representation for what we needed it, so we ended up abandoning this direction.
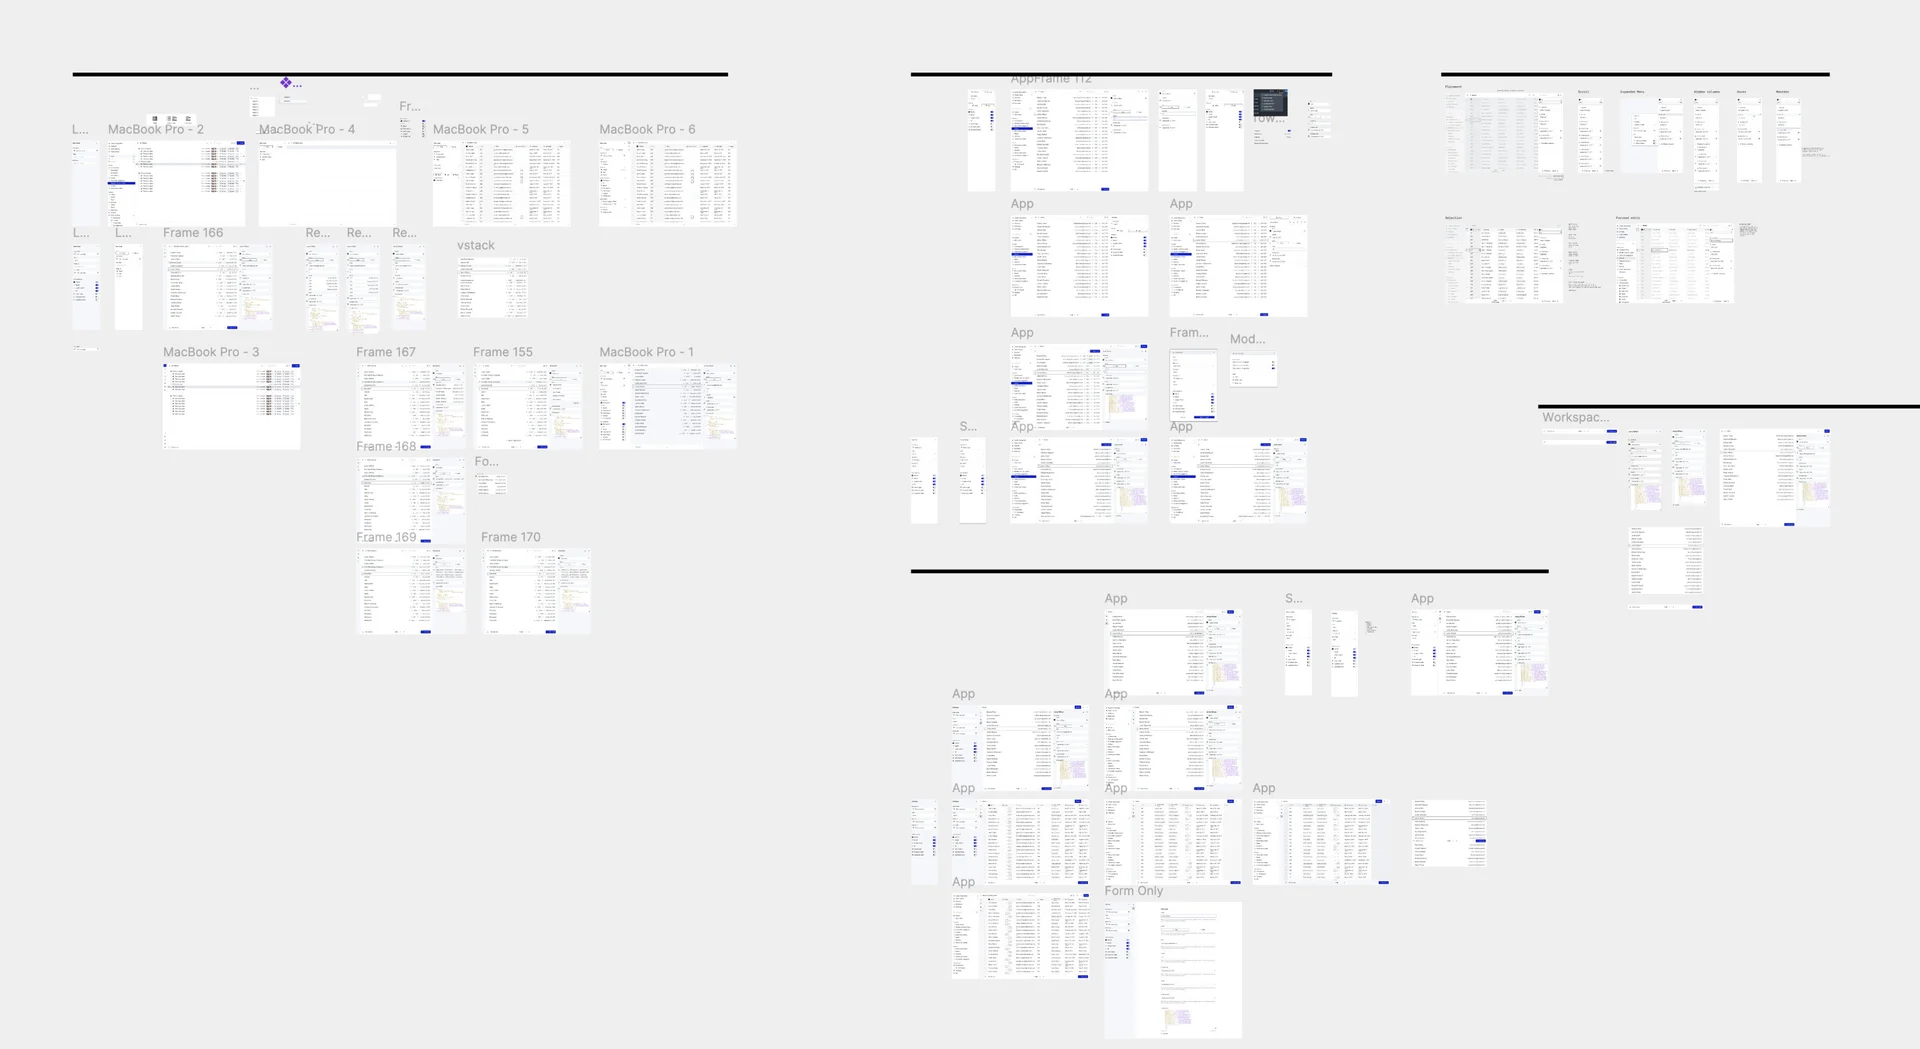
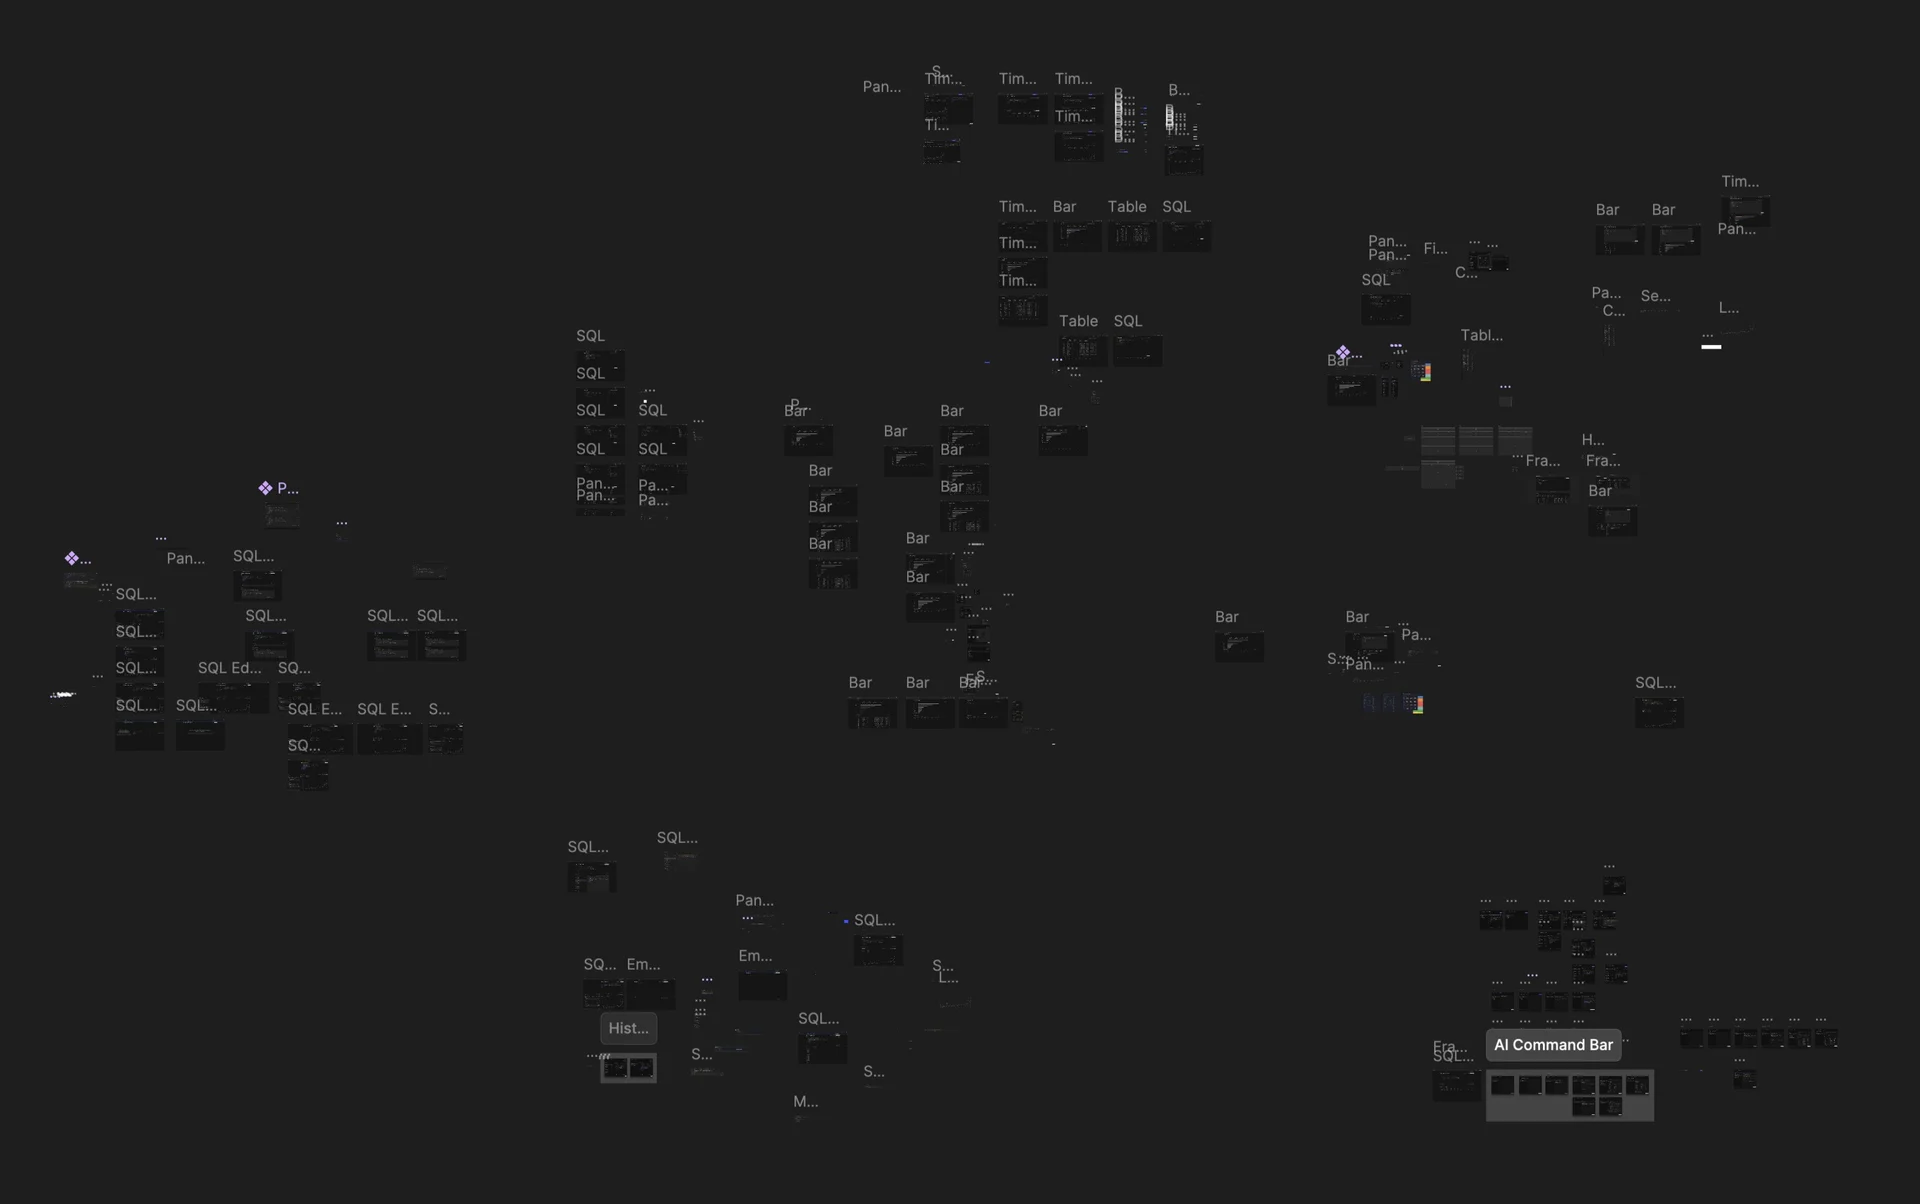
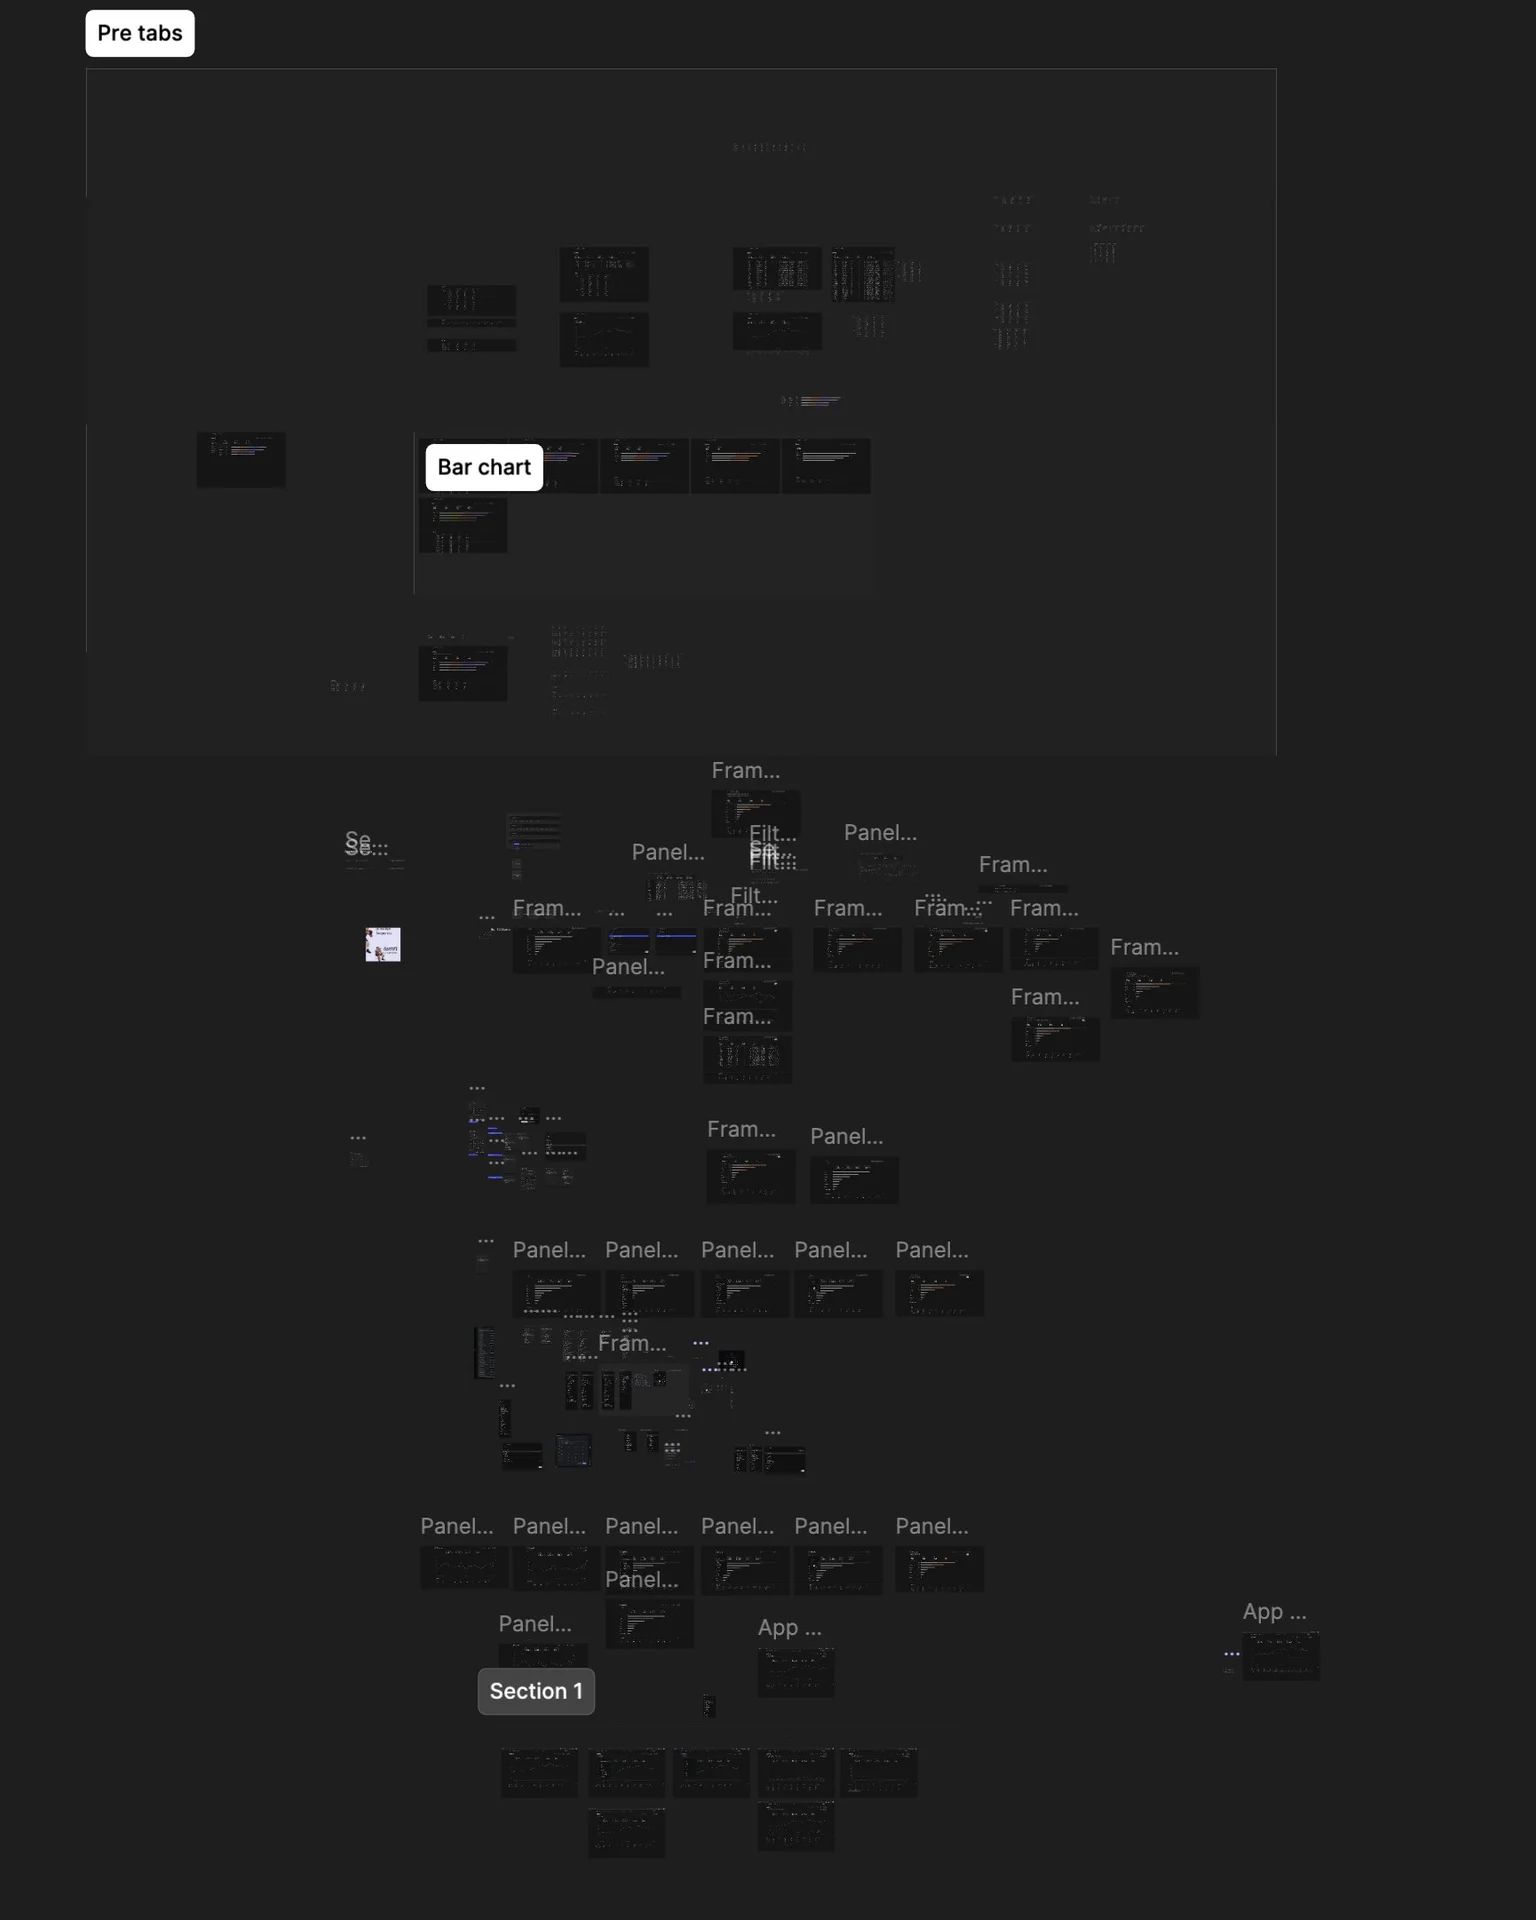
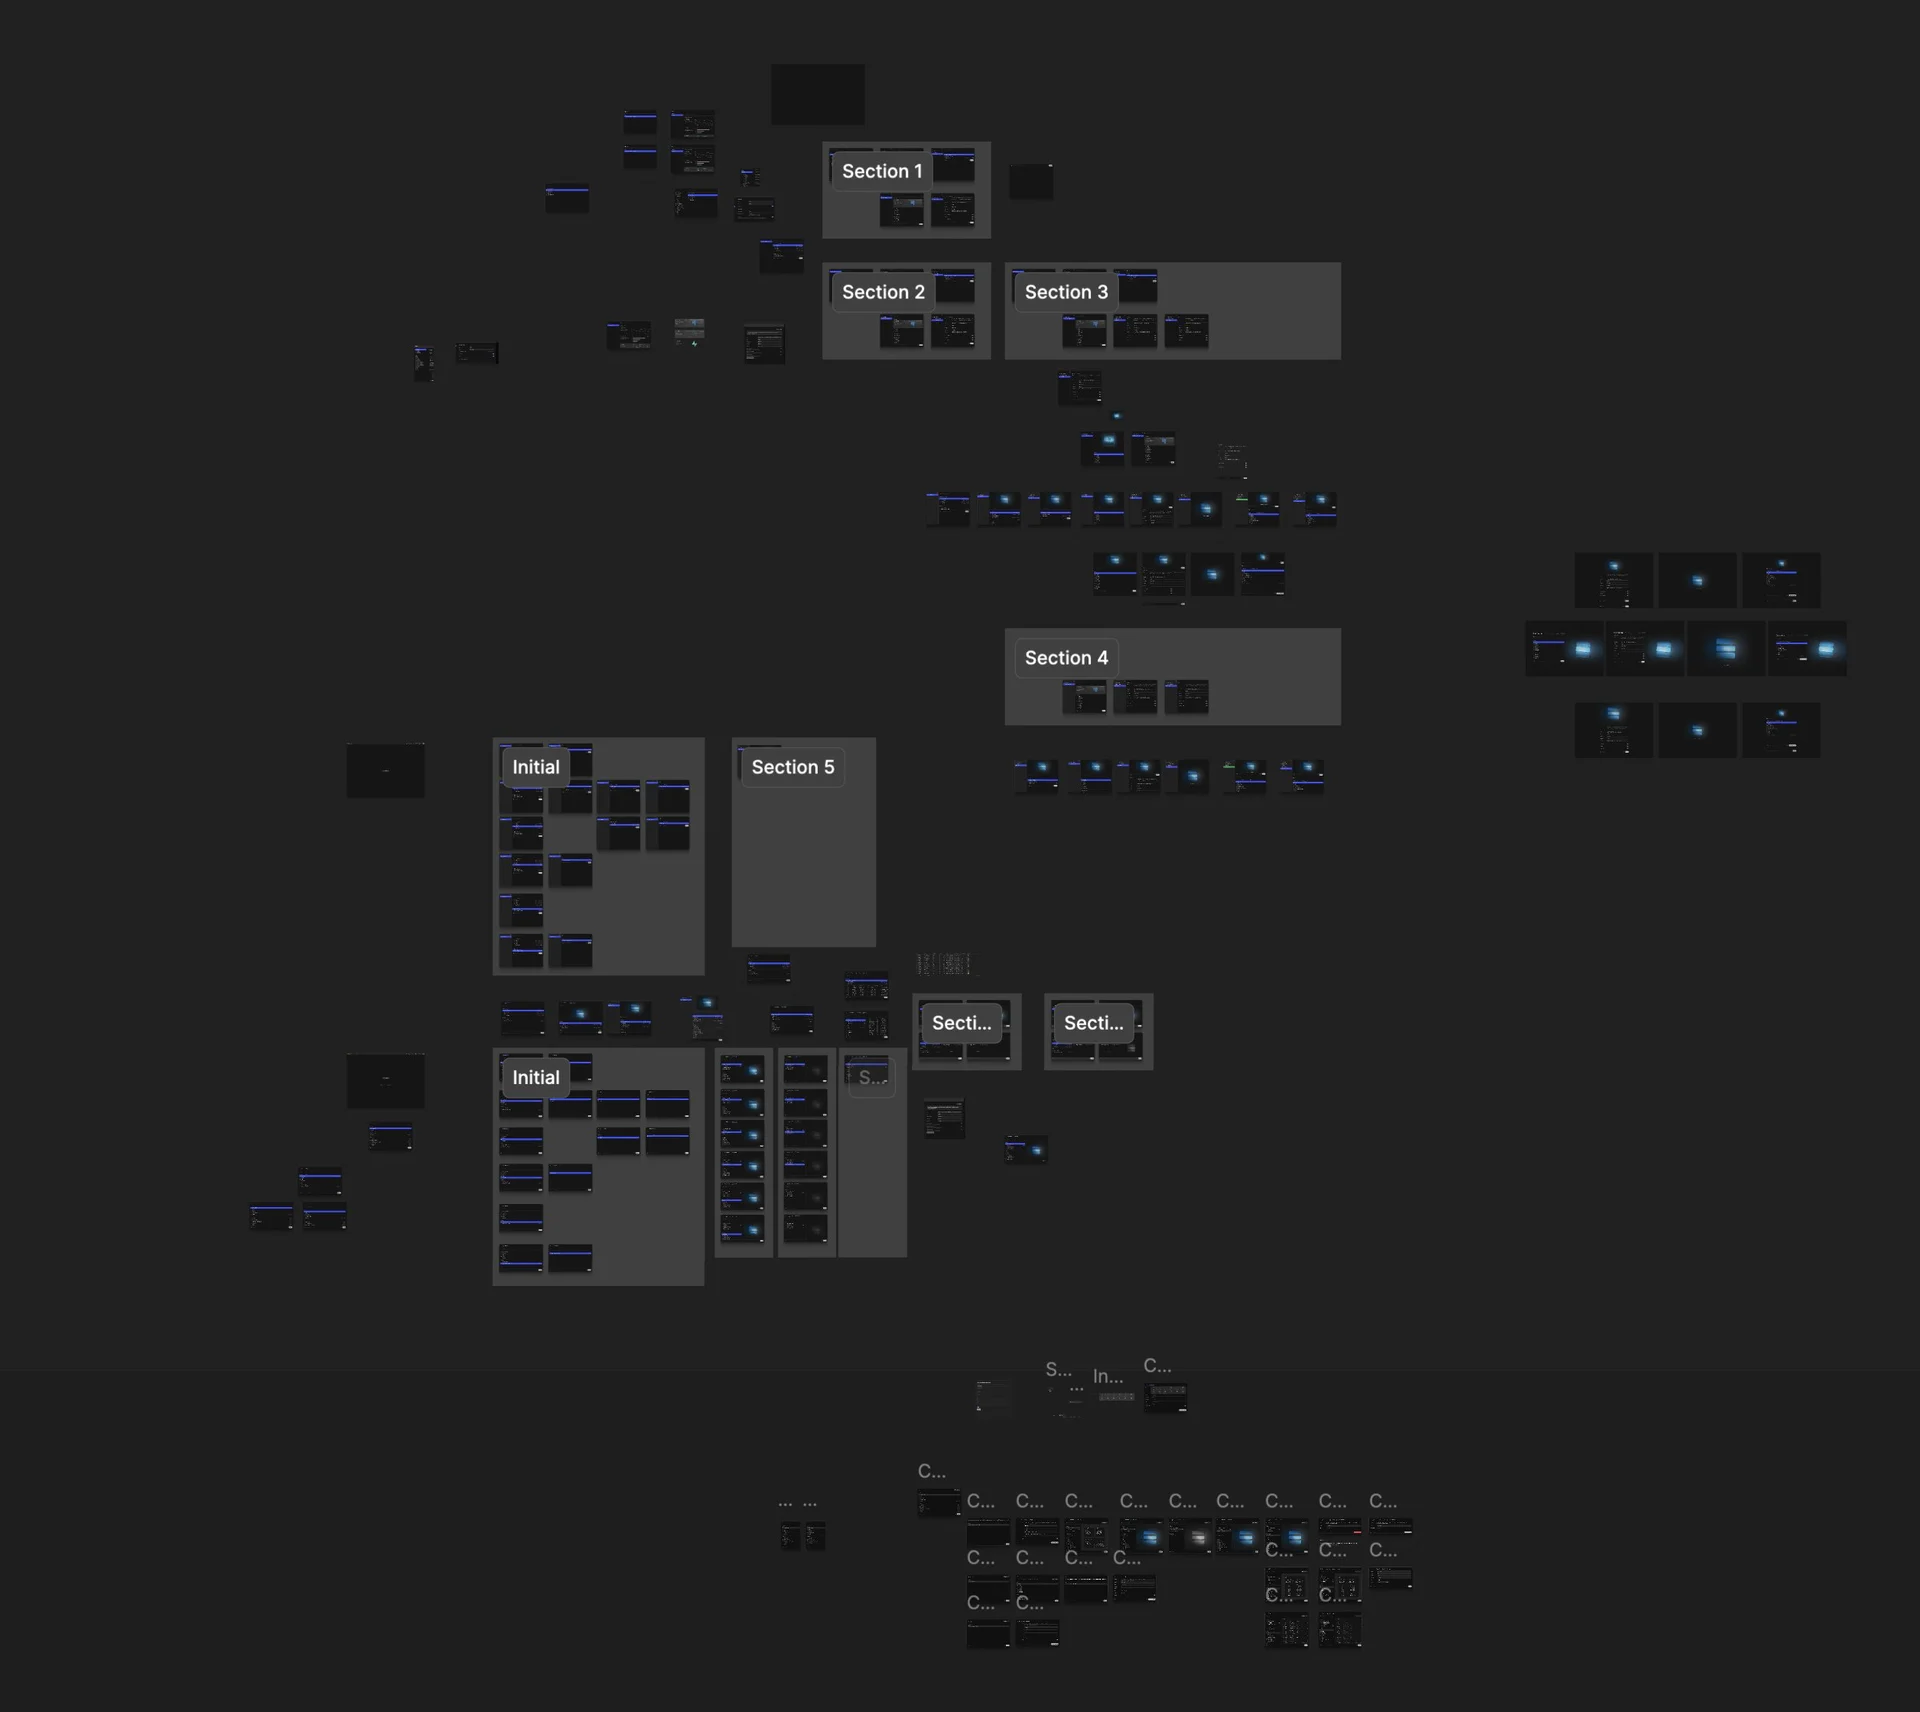
The interesting thing about looking at these design files is there's a Cambrian explosion of new exploration that I was doing here versus when it was the admin one.
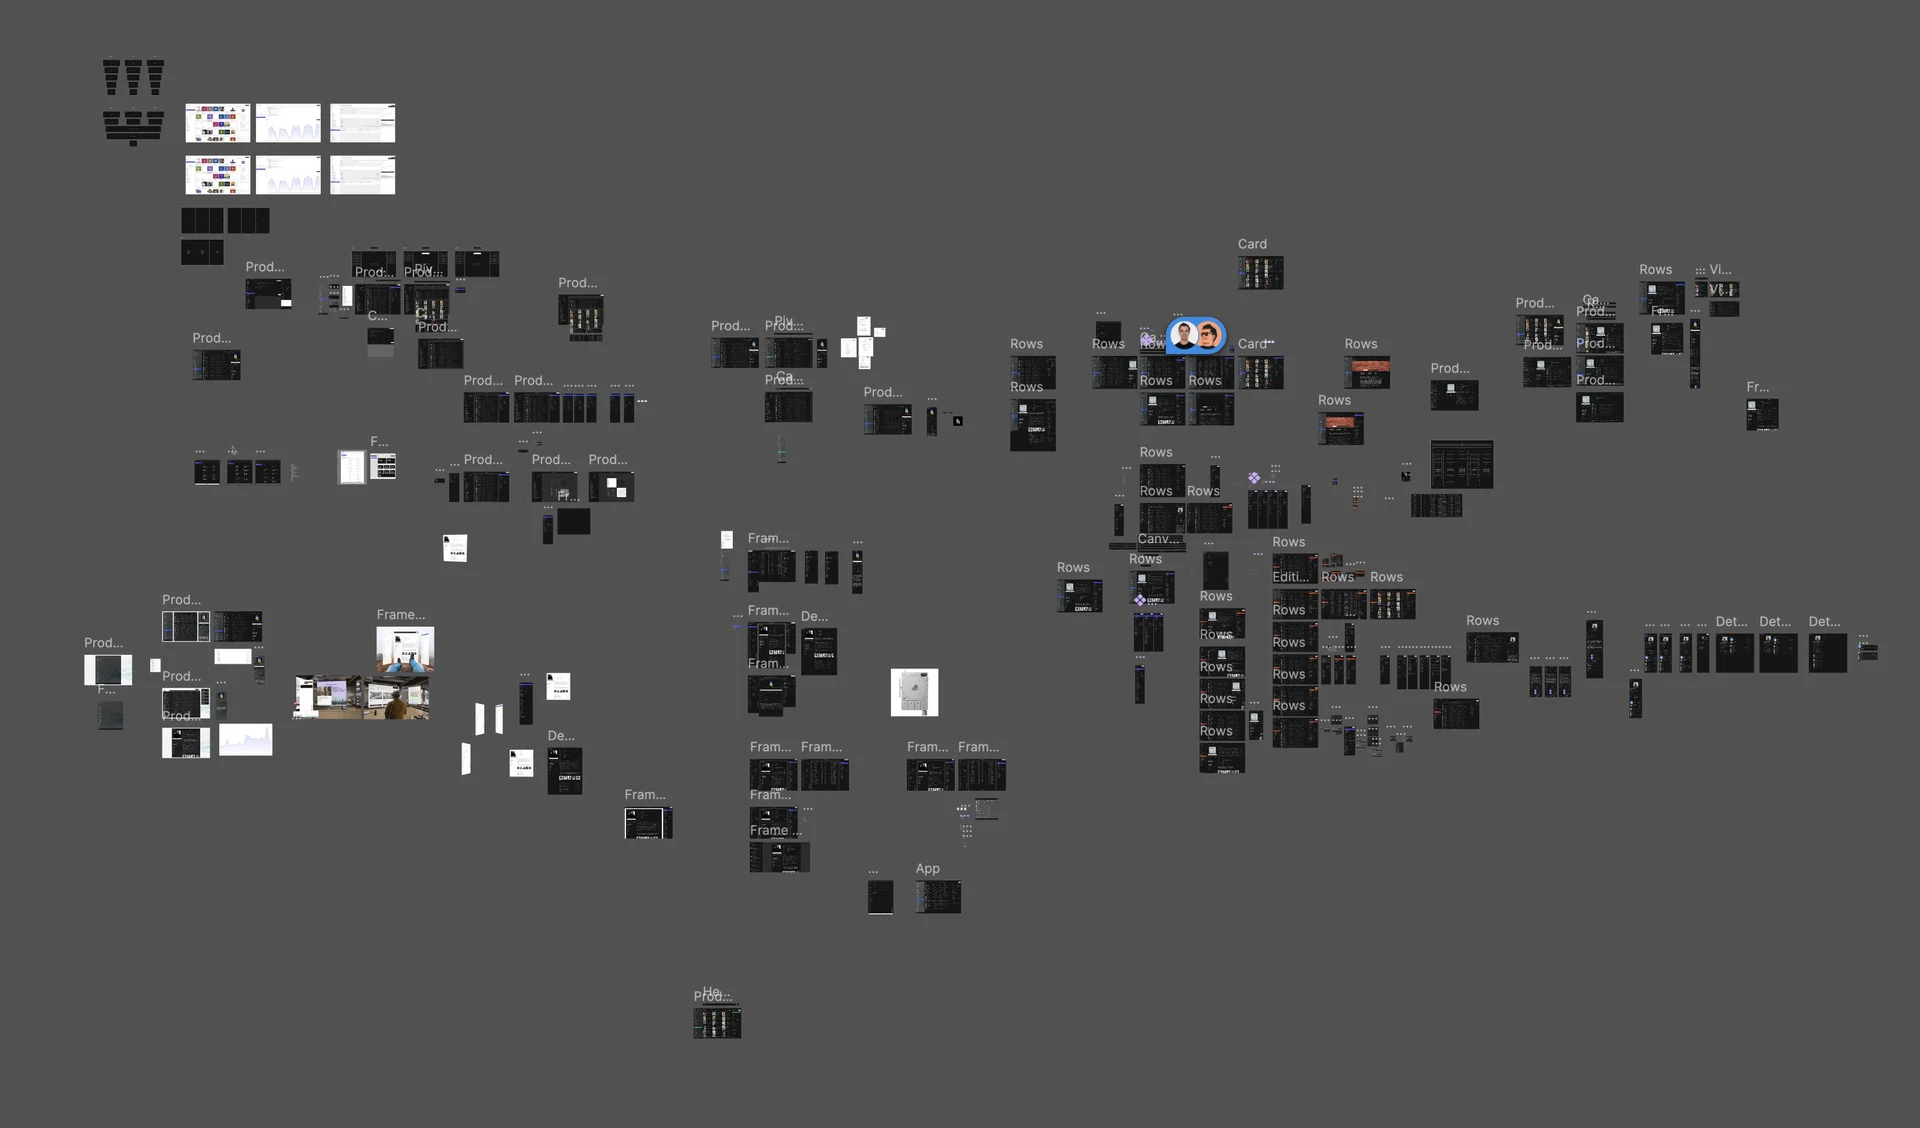
My canvases are wild. I had no idea what I was doing. Or what direction we were going in. Everything was new.
Kinda cool to see that-- and most of it was in about 6 months of work.
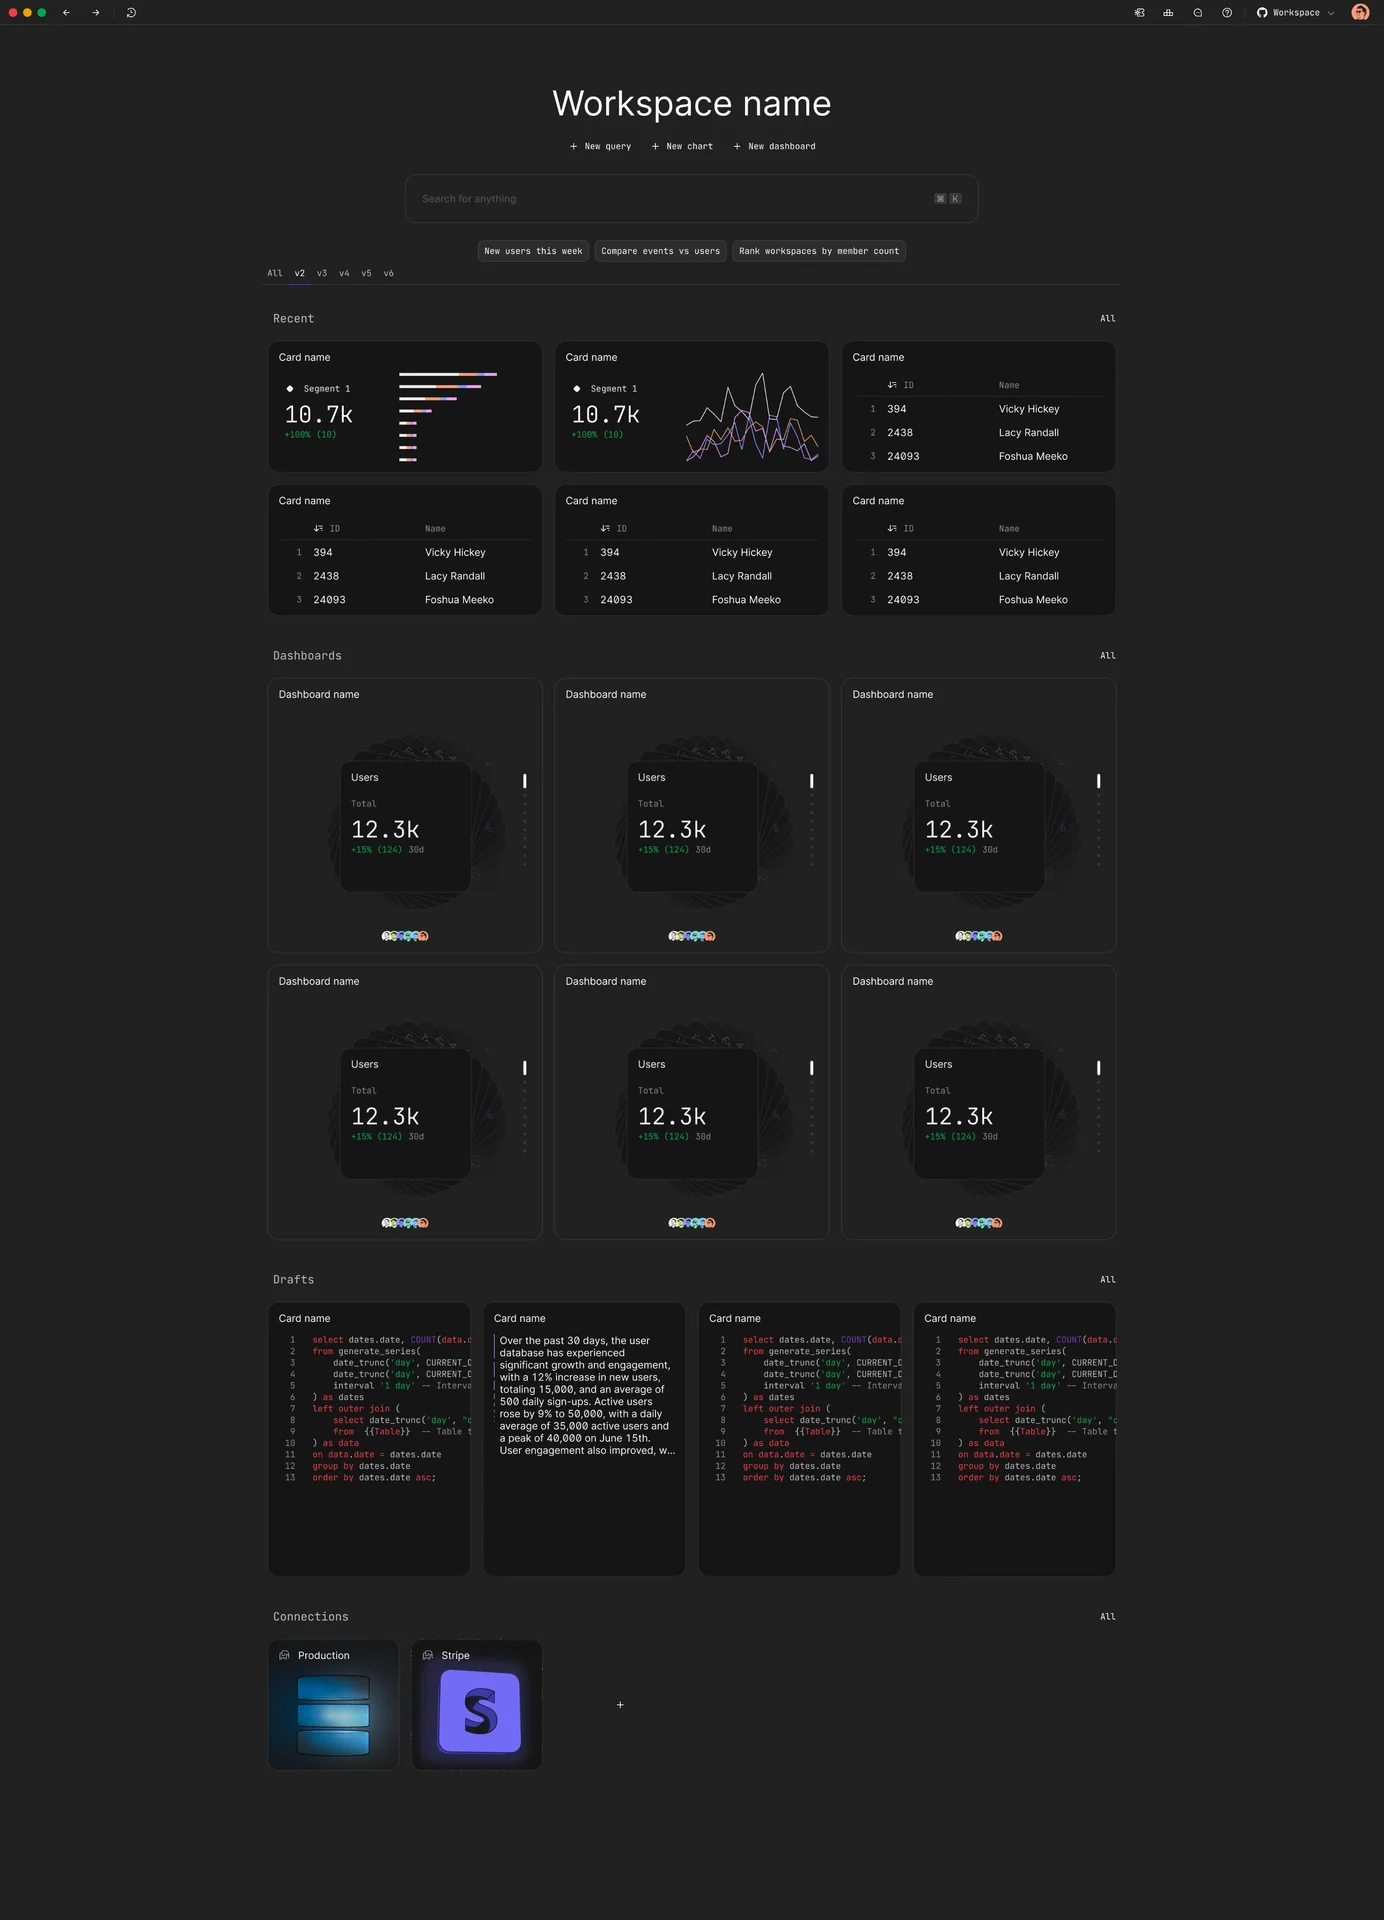
Interesting homepage concept. I was really trying to avoid using a sidebar.
There's a few reasons for that. One, I just didn't want to copy linear. I wanted to follow their example, but I didn't want to literally follow their example... if that makes sense?
But feedback was pretty clear and dramatic once we added the sidebar back. Things like this were interesting, but it also caused way too much hard navigation in and out of pages for things to feel fast.
Launch invitations and full chart pages
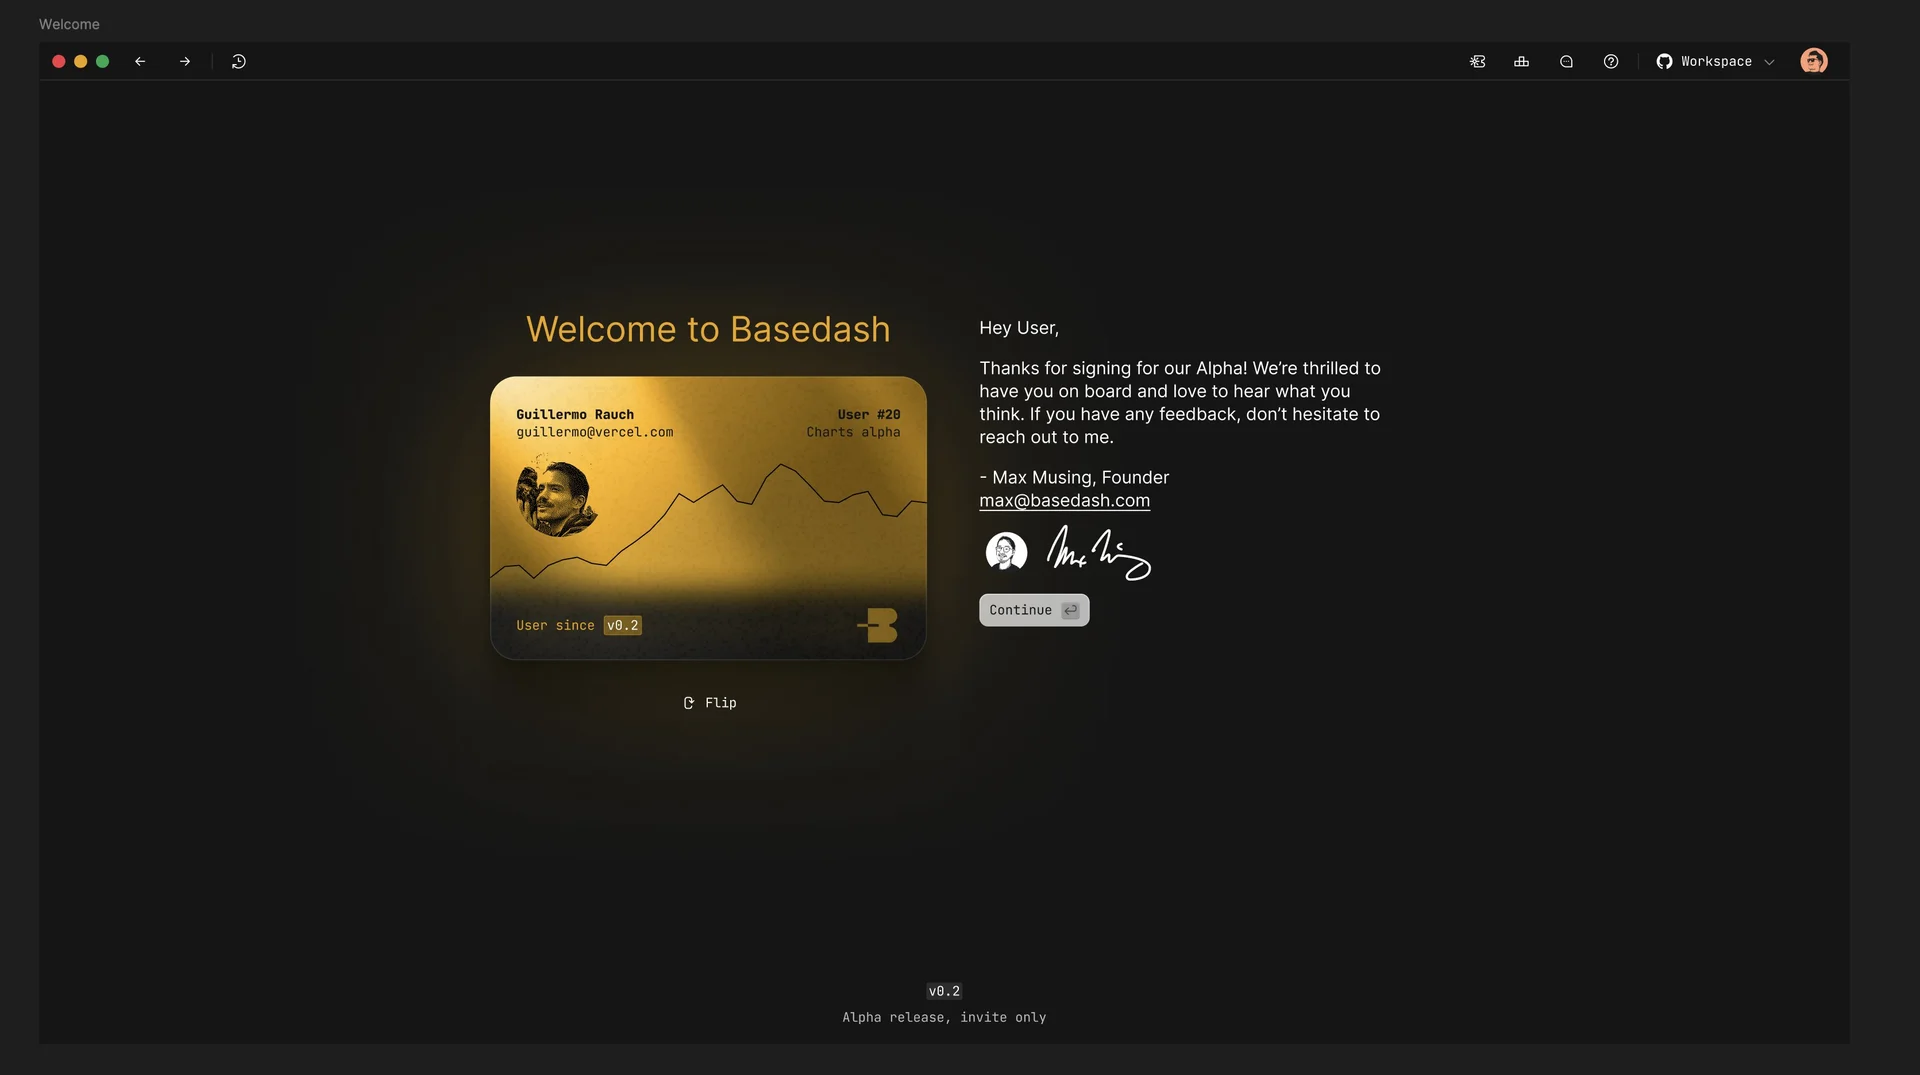
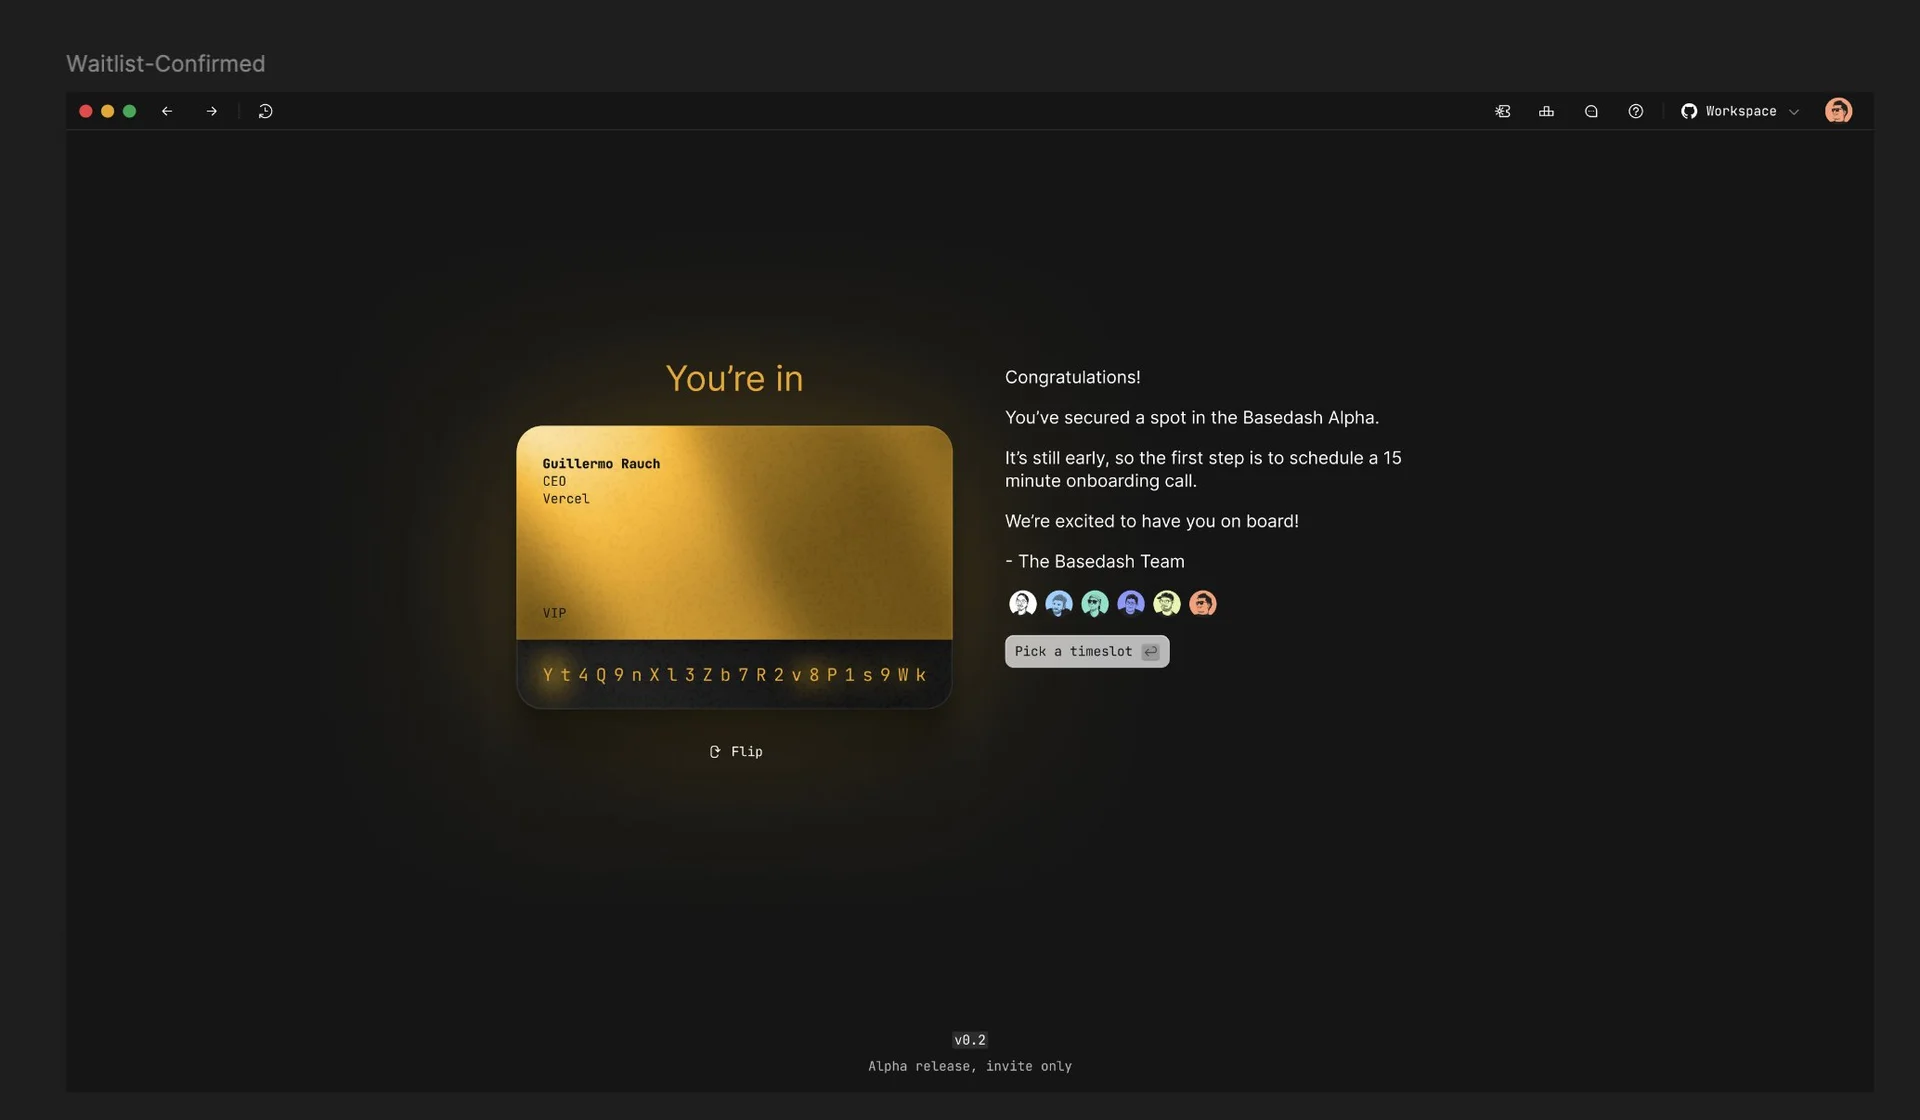
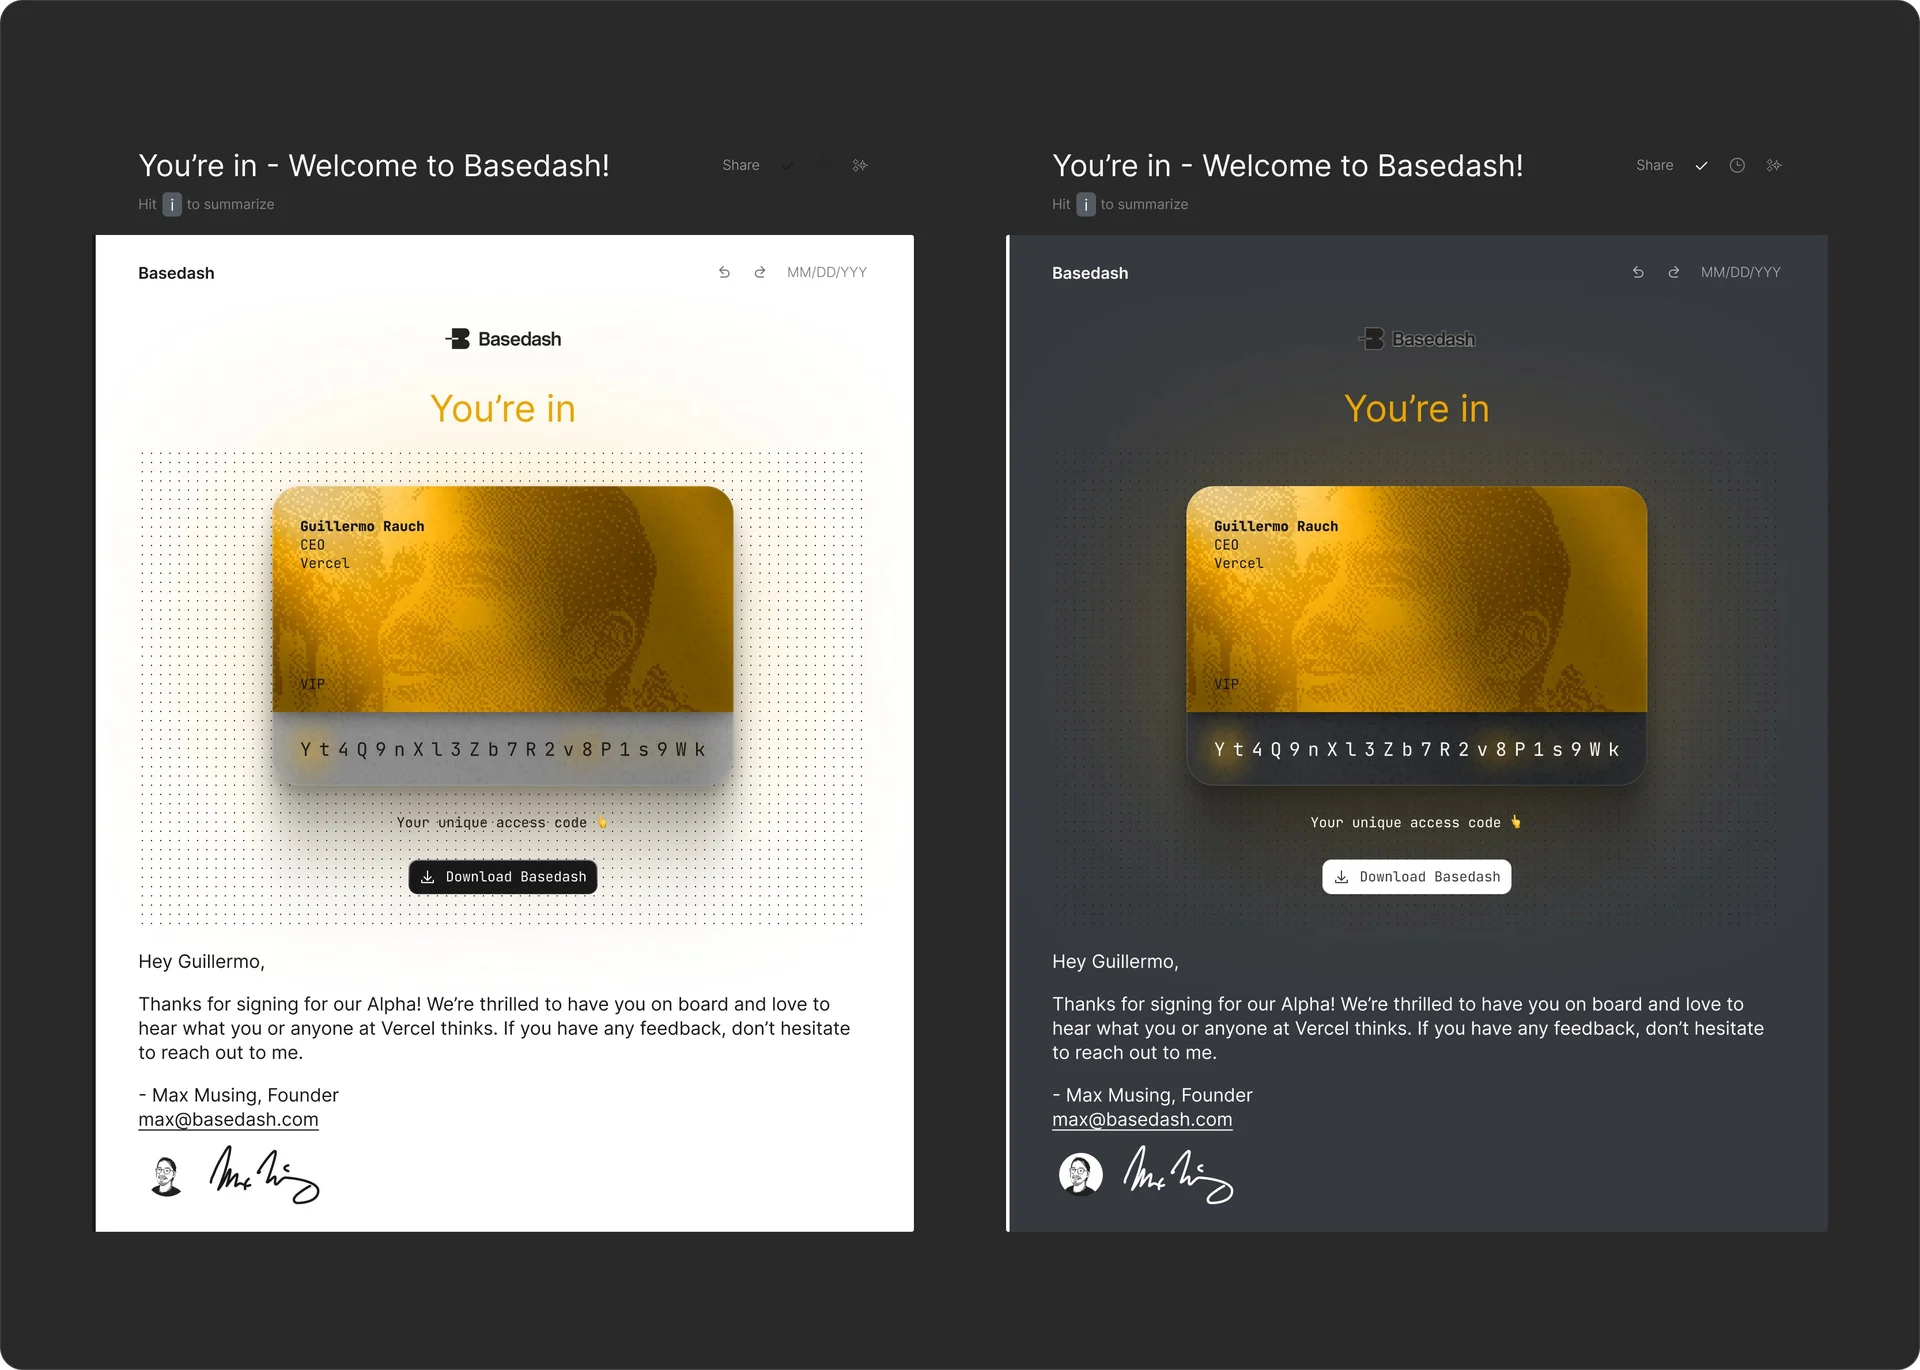
We had a launch strategy that was around exclusivity, these were some ideas around that. I was really going to lean into the gold aesthetic.
These are actually pretty good. @rauchg was one of our "ideal users" so I used his likeness for these invites.
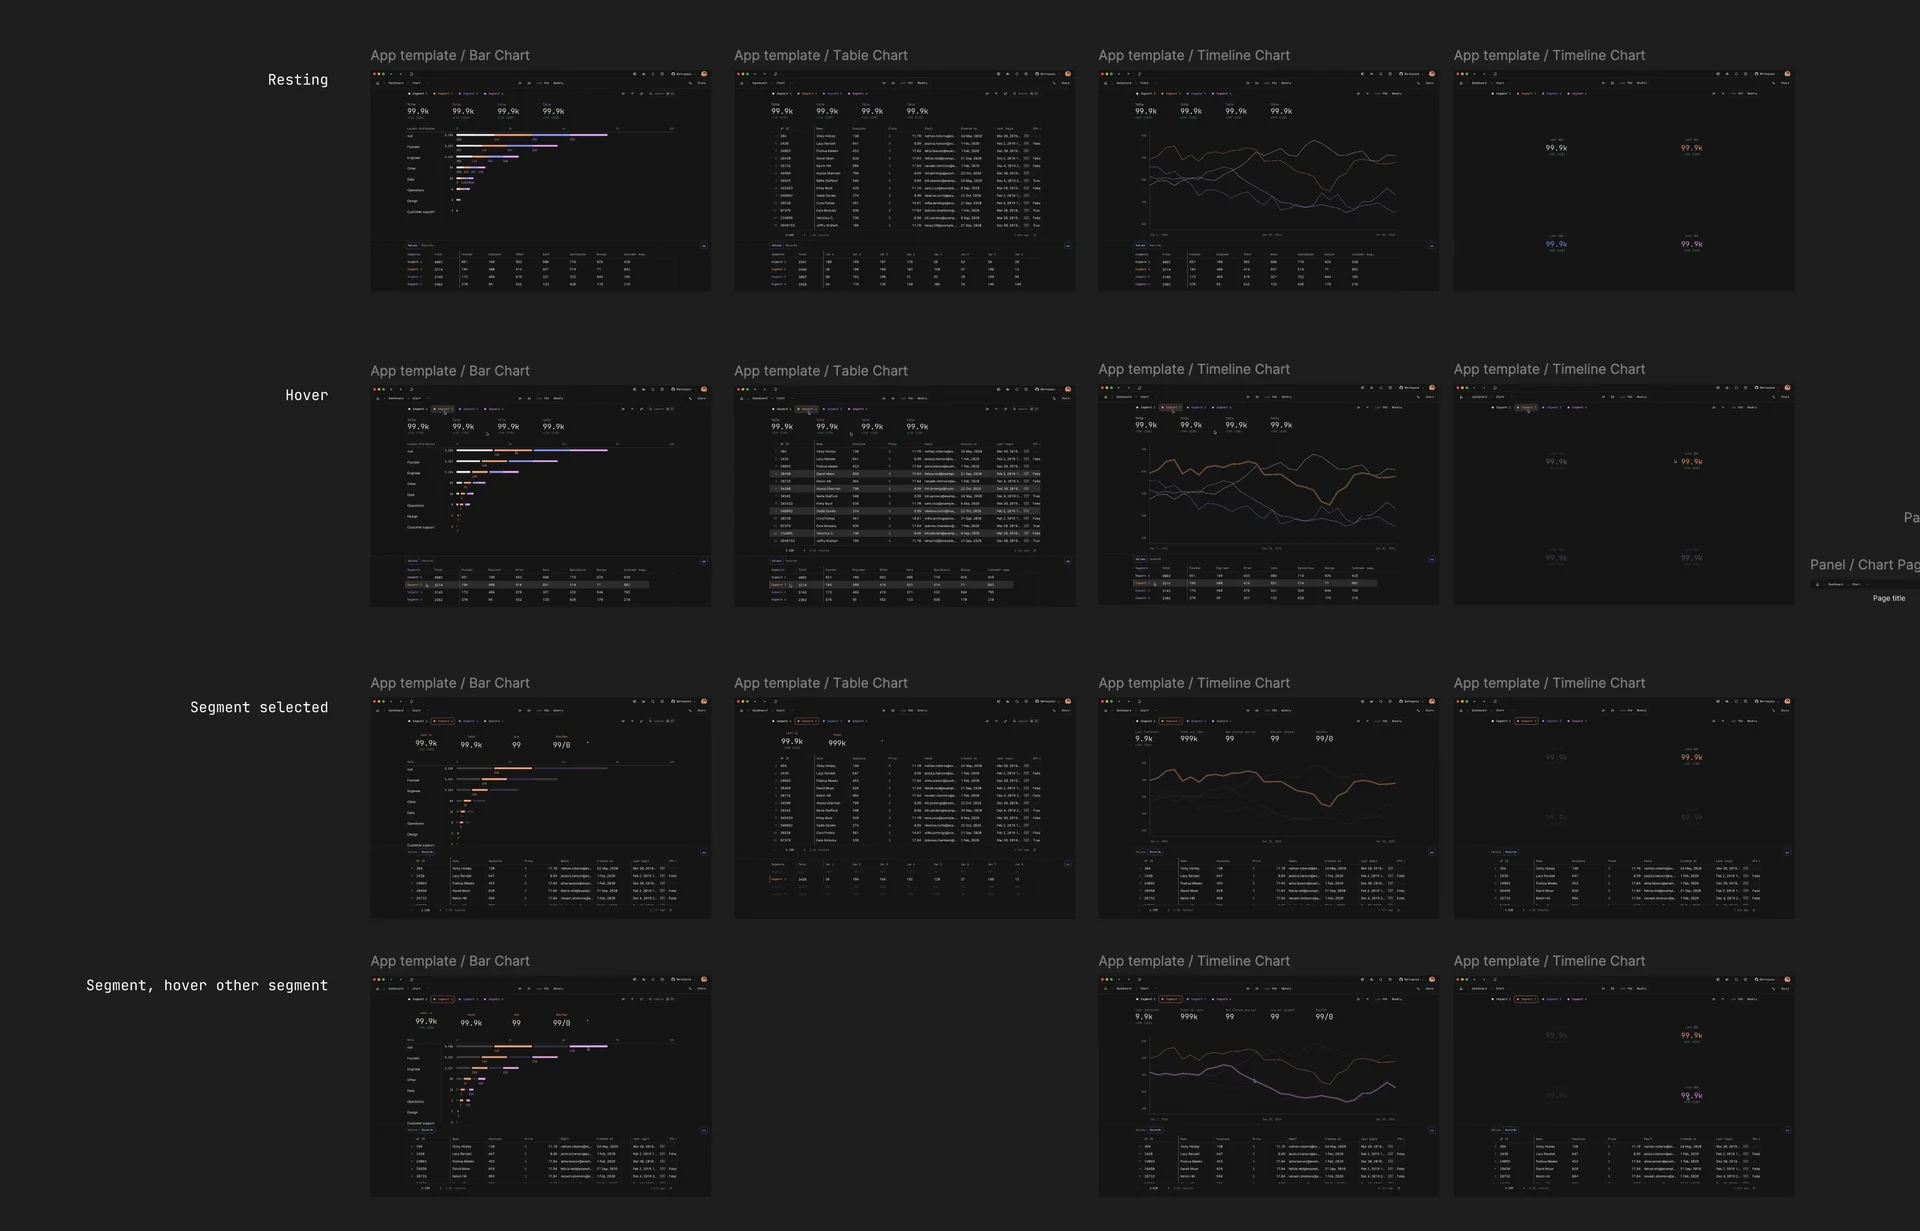
Lots of full chart page explorations. Turns out that we have a lot of these in Basedash, but rarely anyone uses or asks for features around them.
Charts on a dashboard are almost always sufficient.
Marketing, identity, and the rebrand playground
Let's look at some other things that I worked on, marketing-specific stuff.
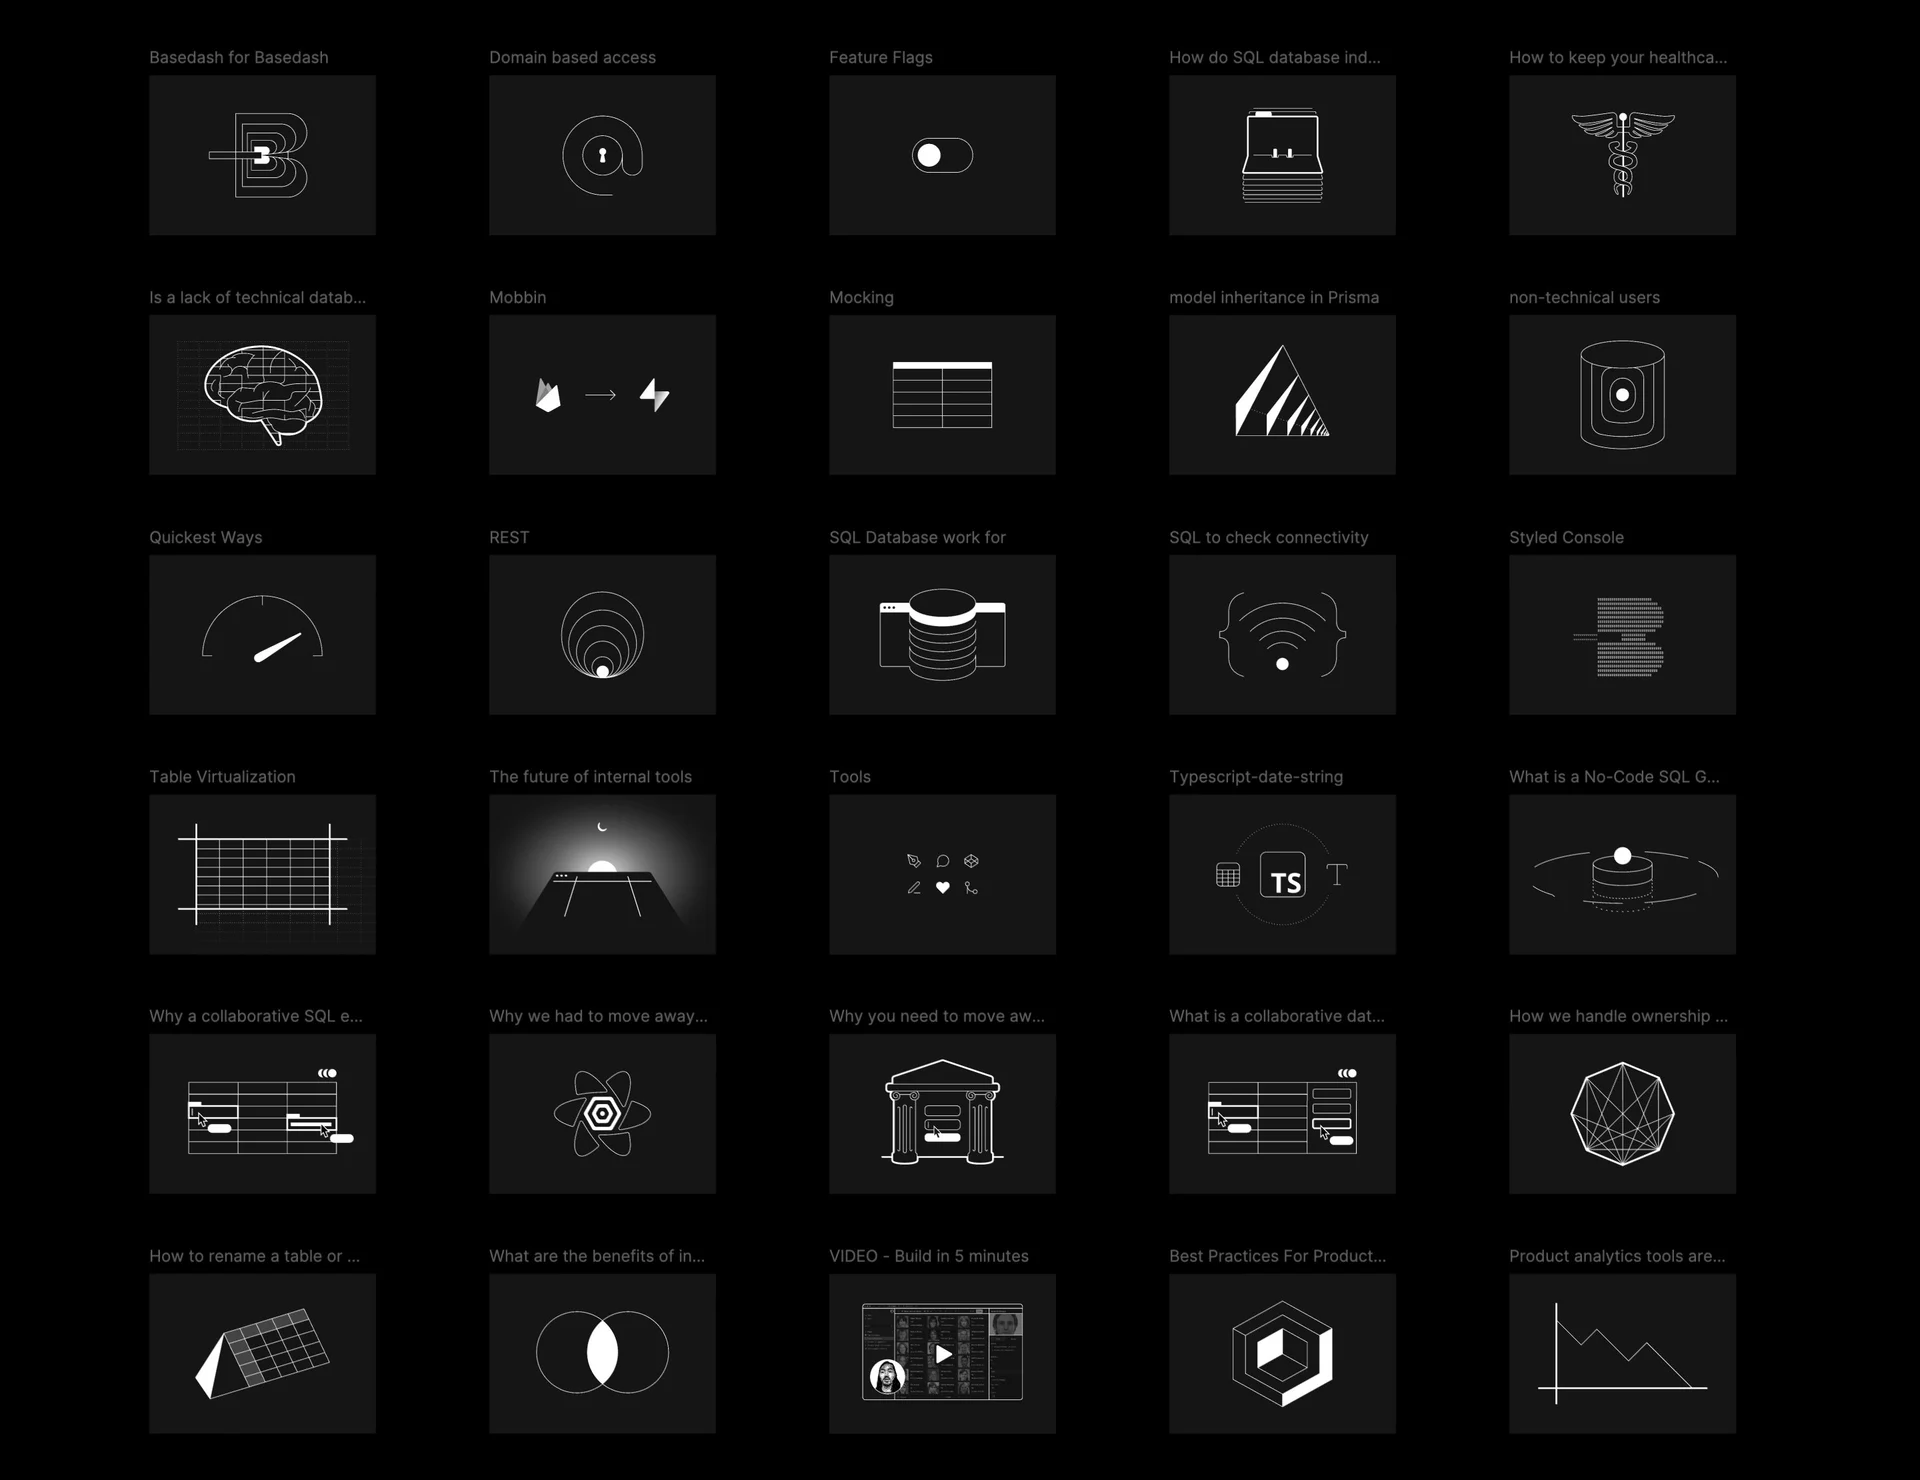
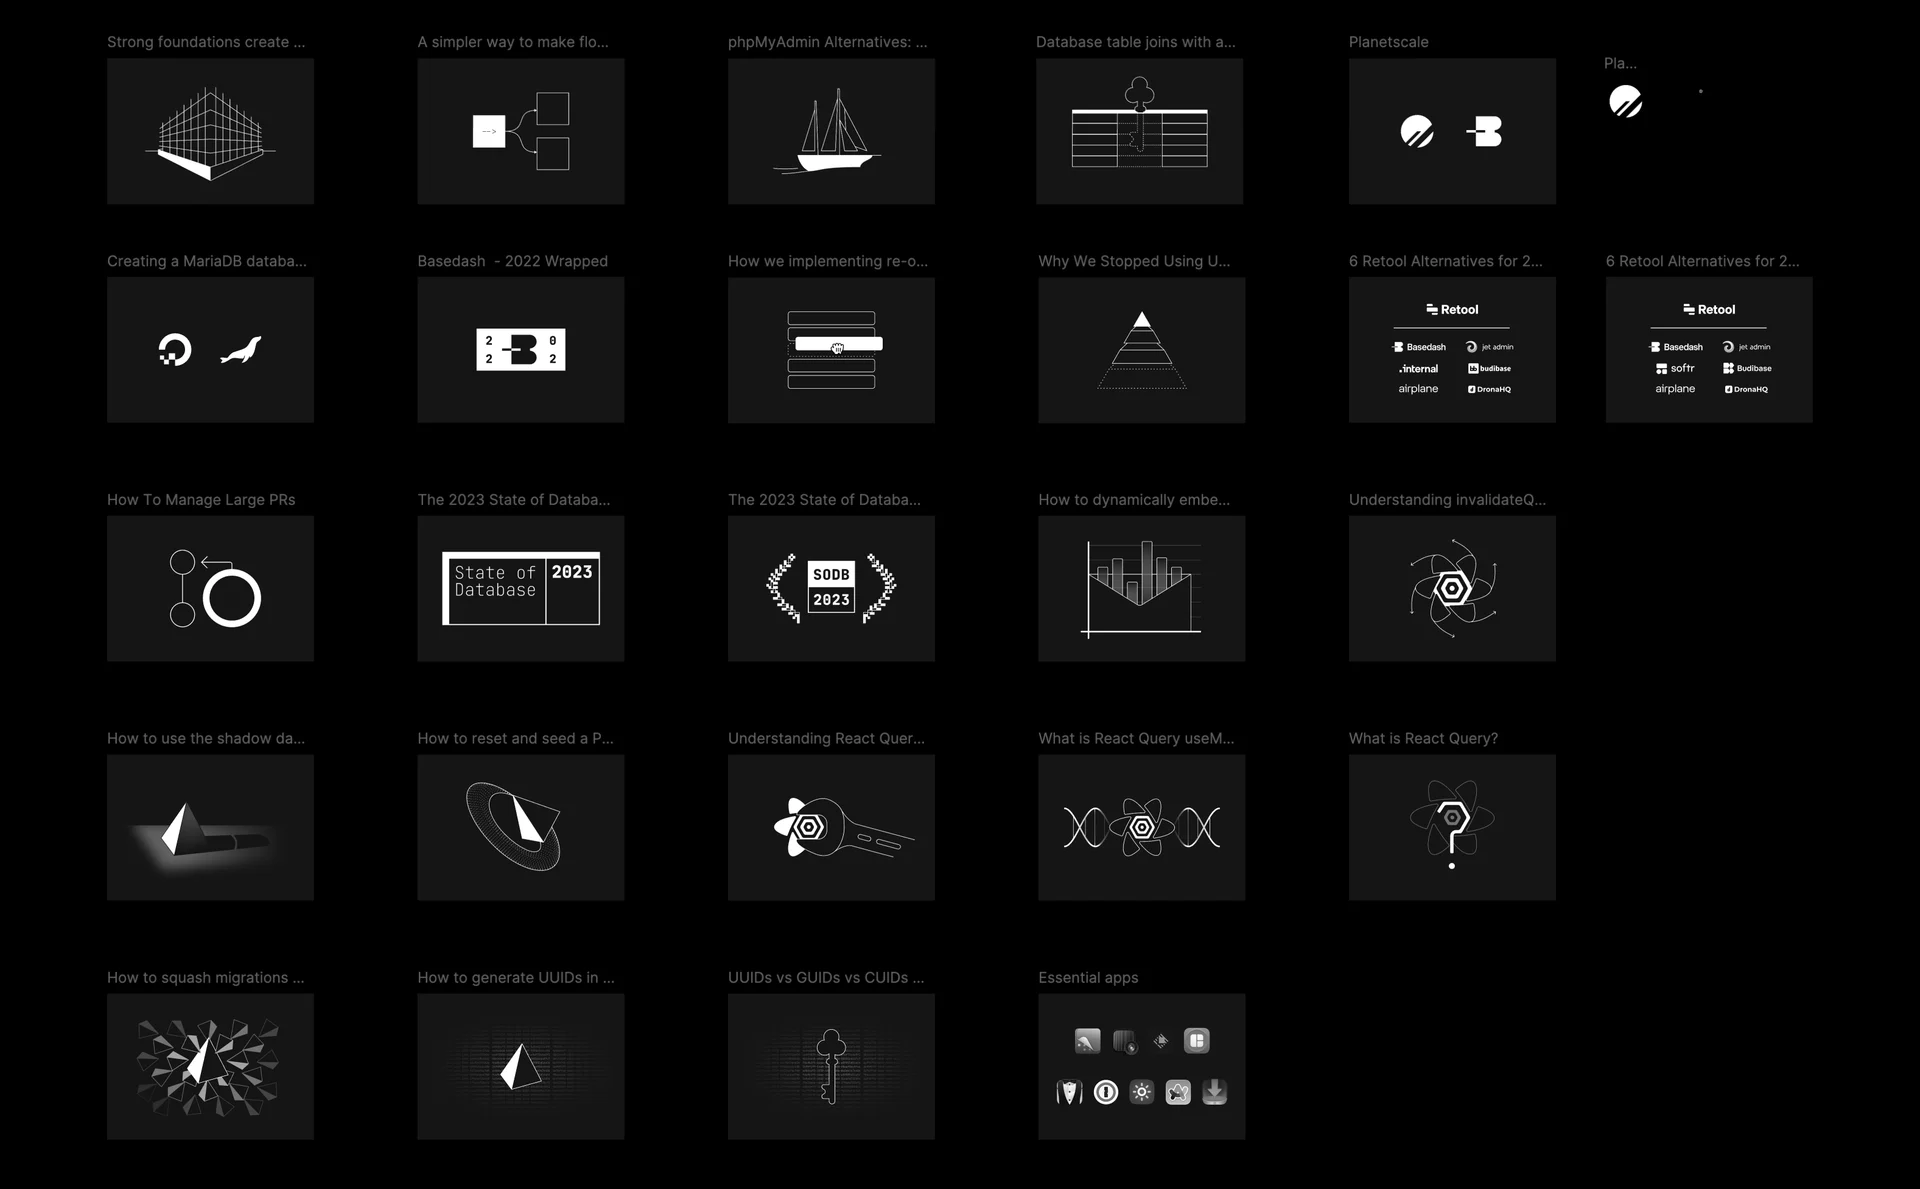
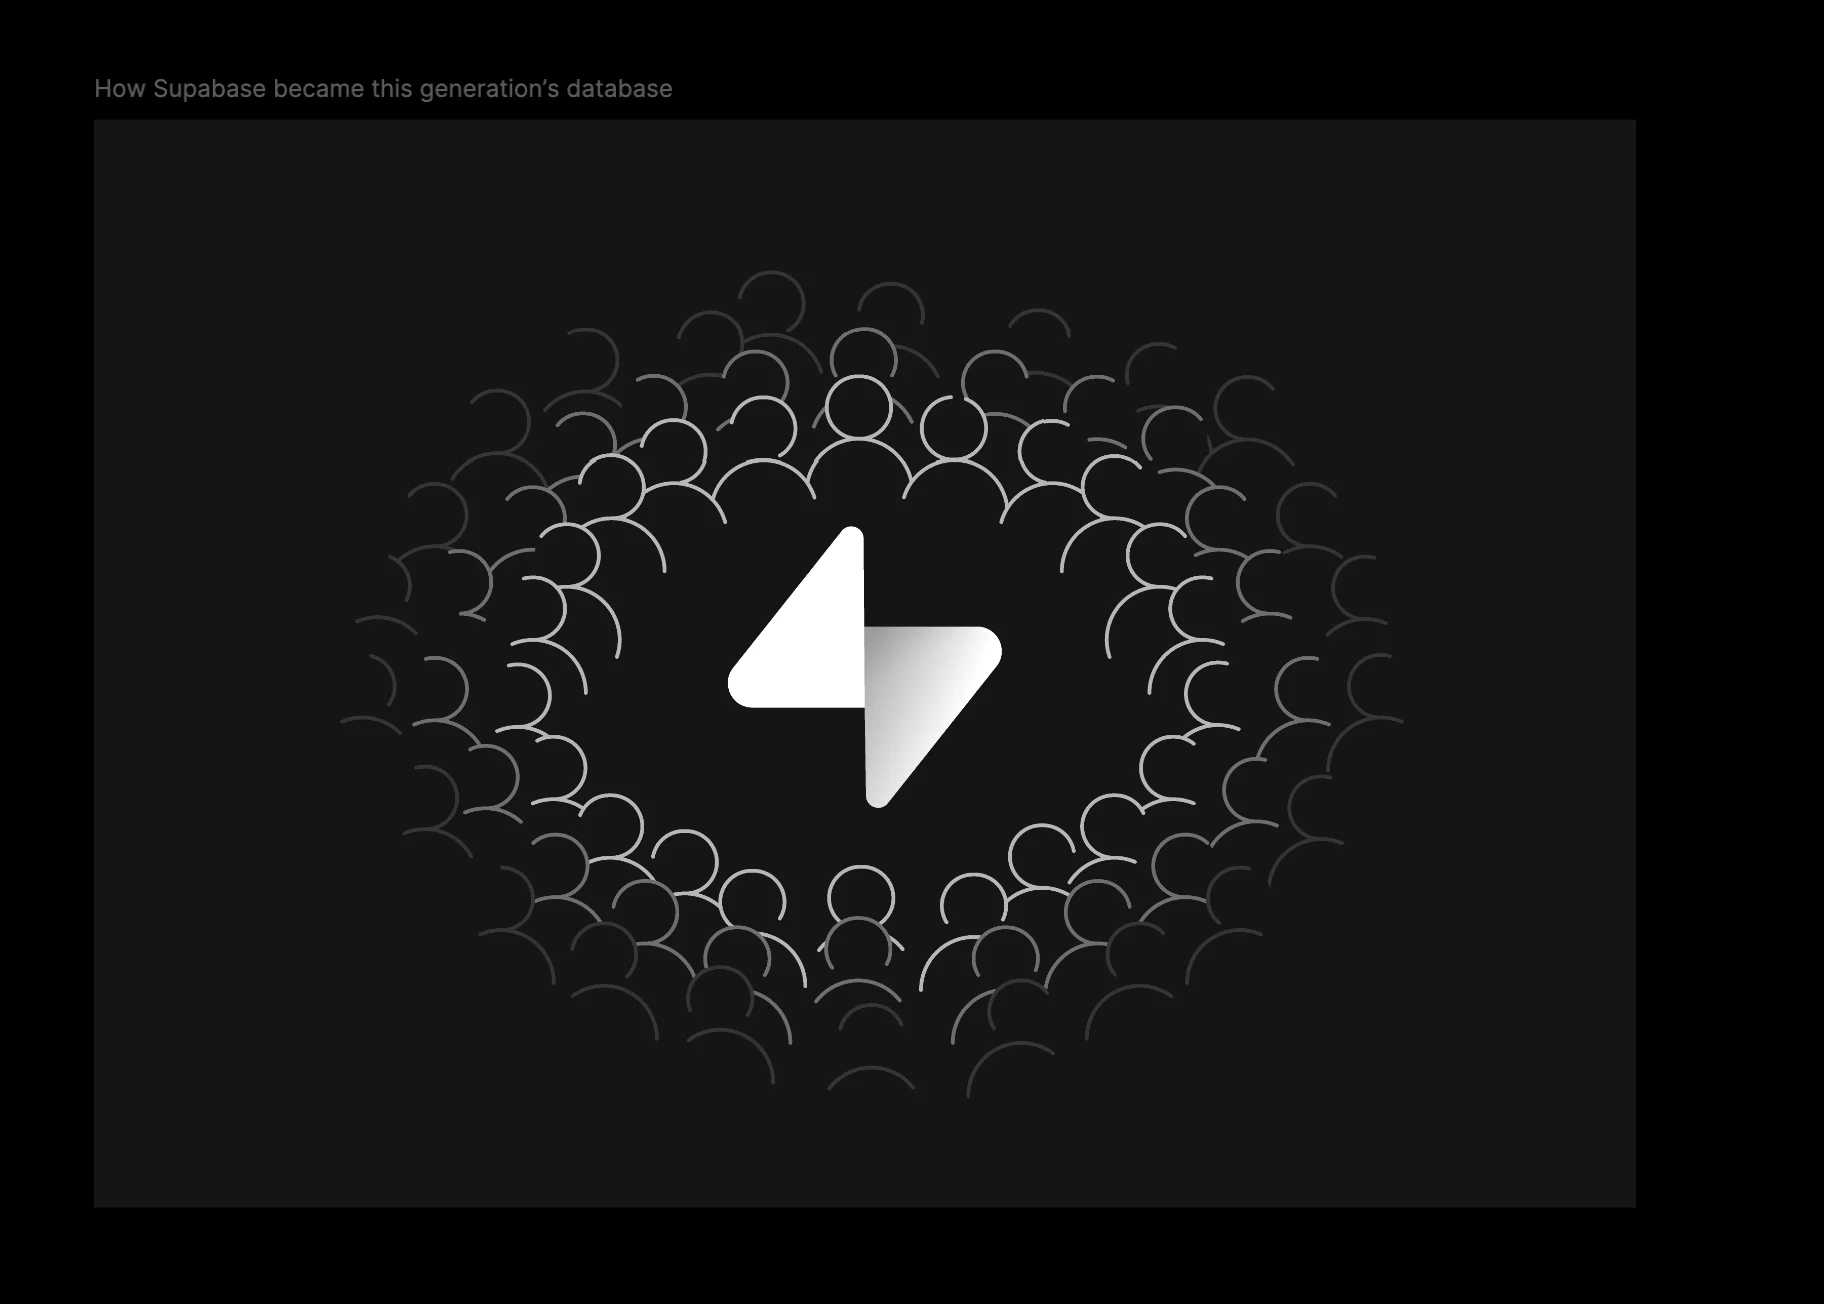
Here's a bunch of the assets I made for the blog posts on our website. I had a very clear aesthetic with line direction, simple colors, high contrast.
Always like the way this @supabase one came out.
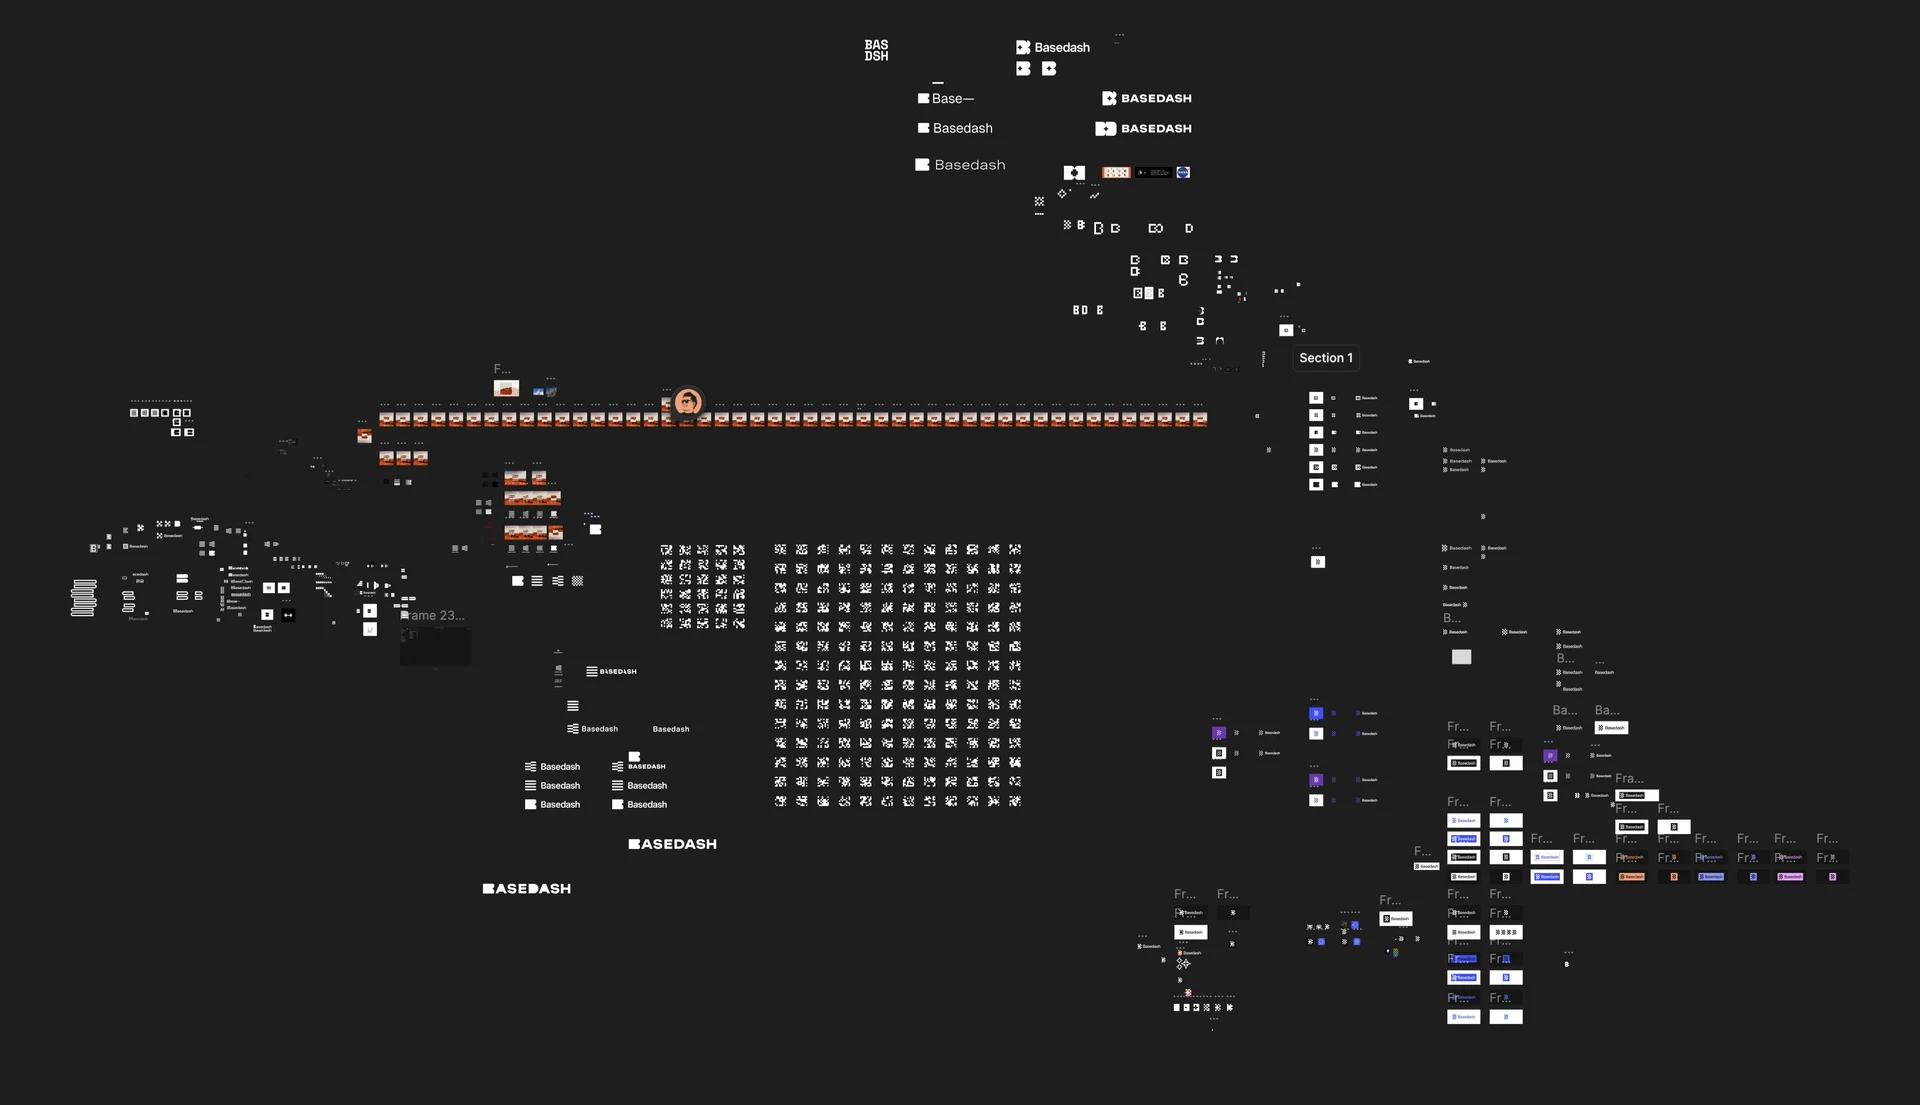
Oh, I just found my rebrand playground. This was shortly after we changed our logo, and I was just trying to see and get a sense for how it could work.
I've never shared these before. Some kind of cool stuff in here.
More explorations of the new identity.
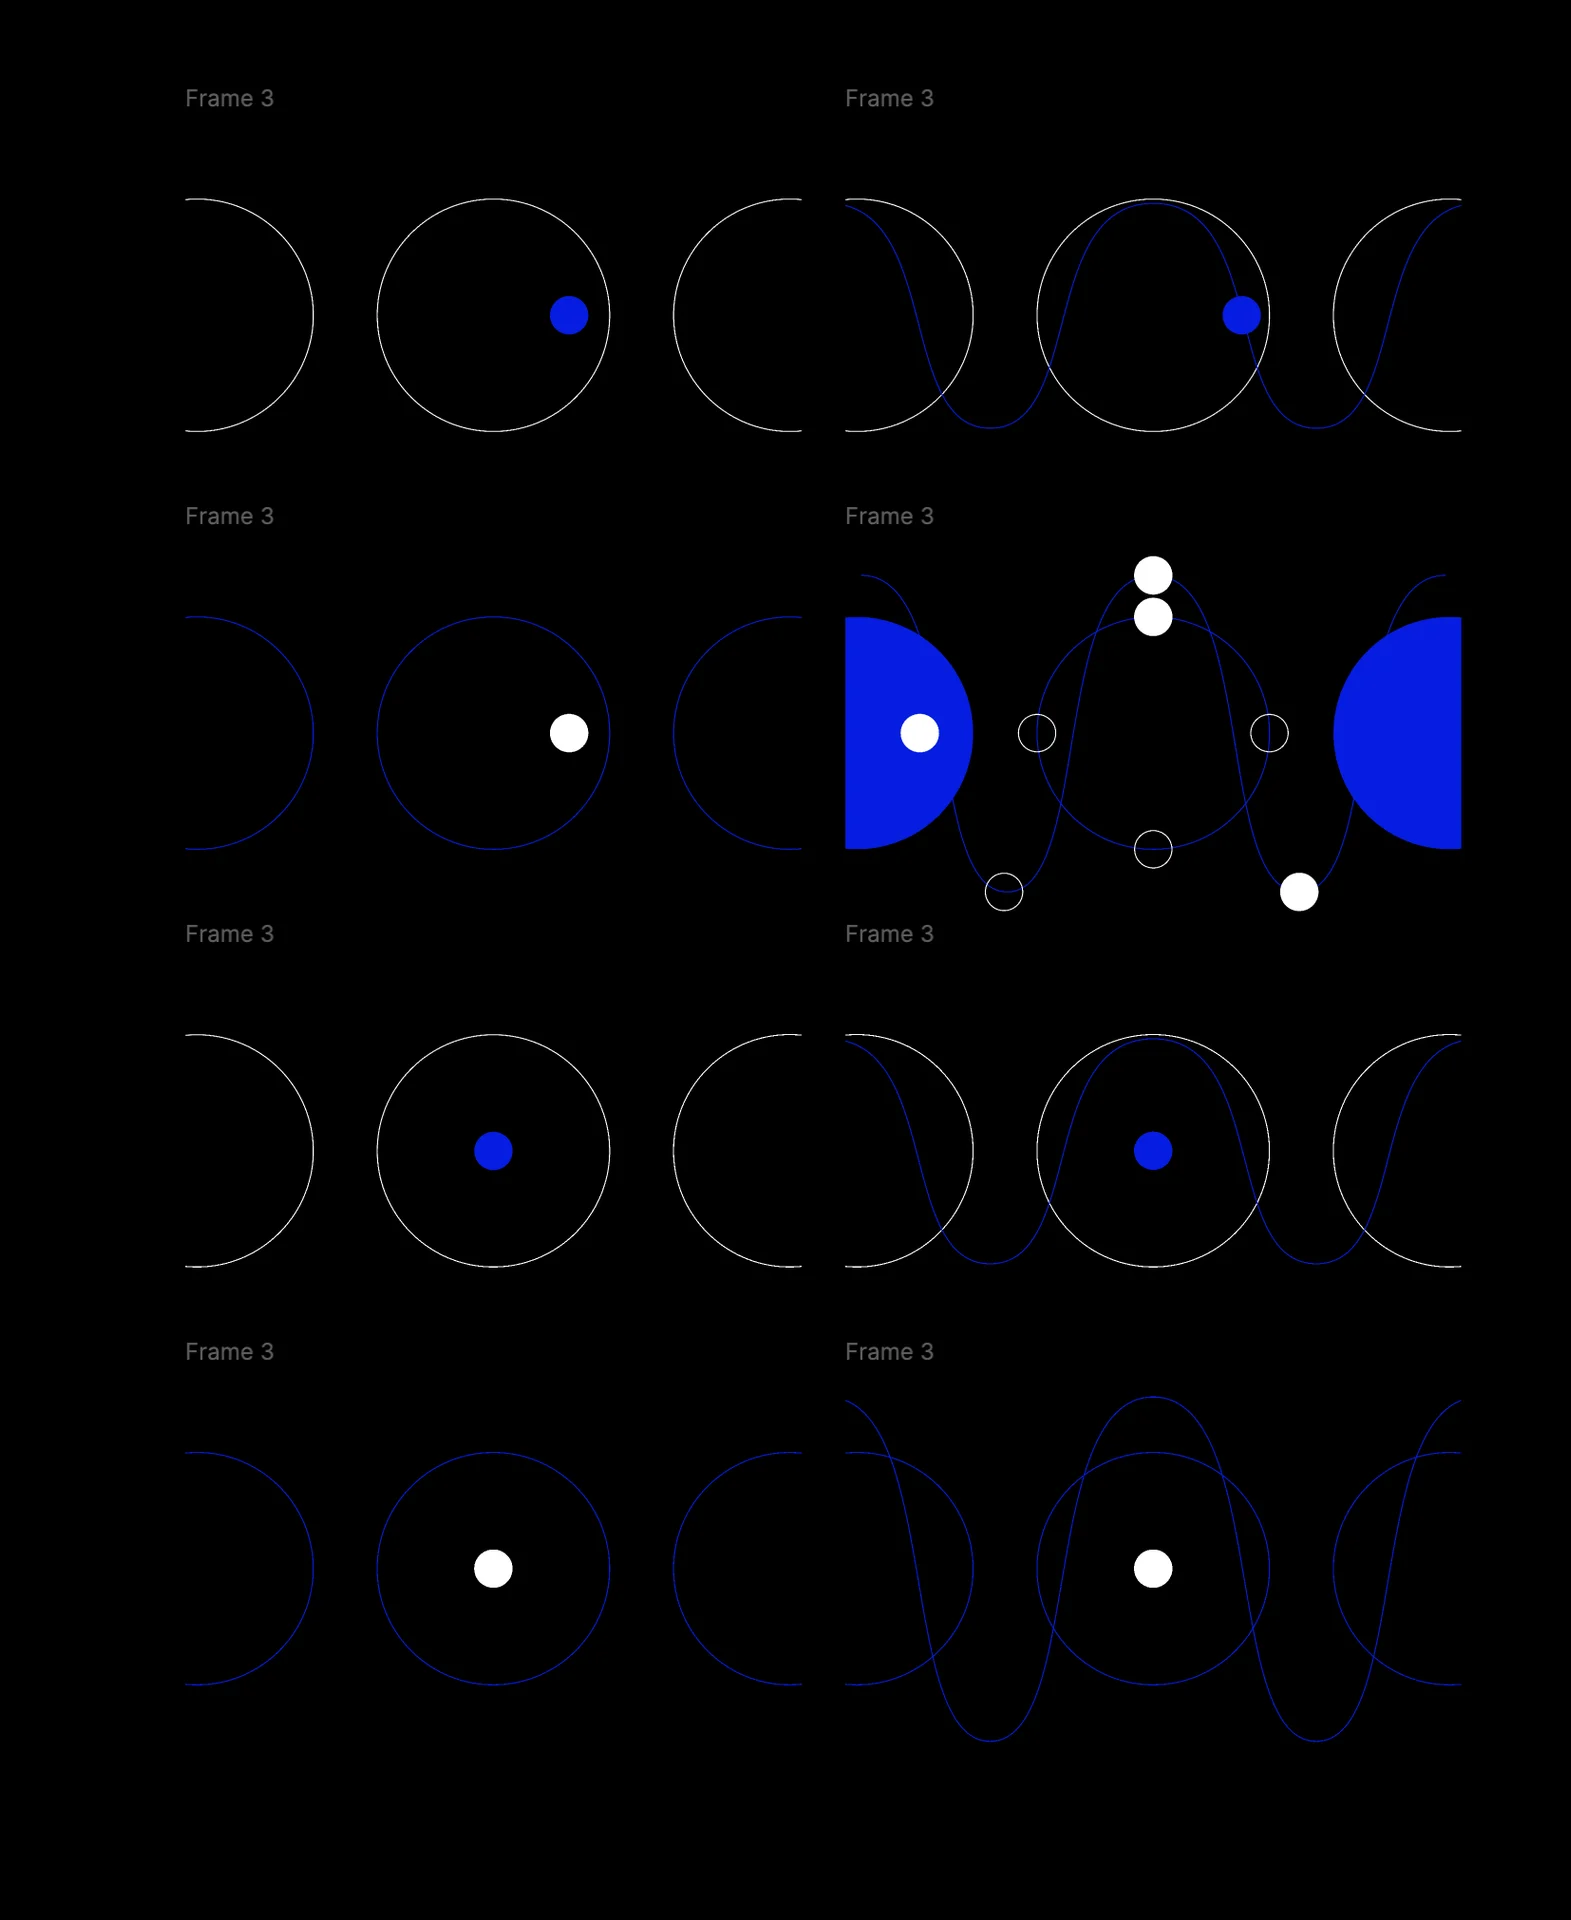
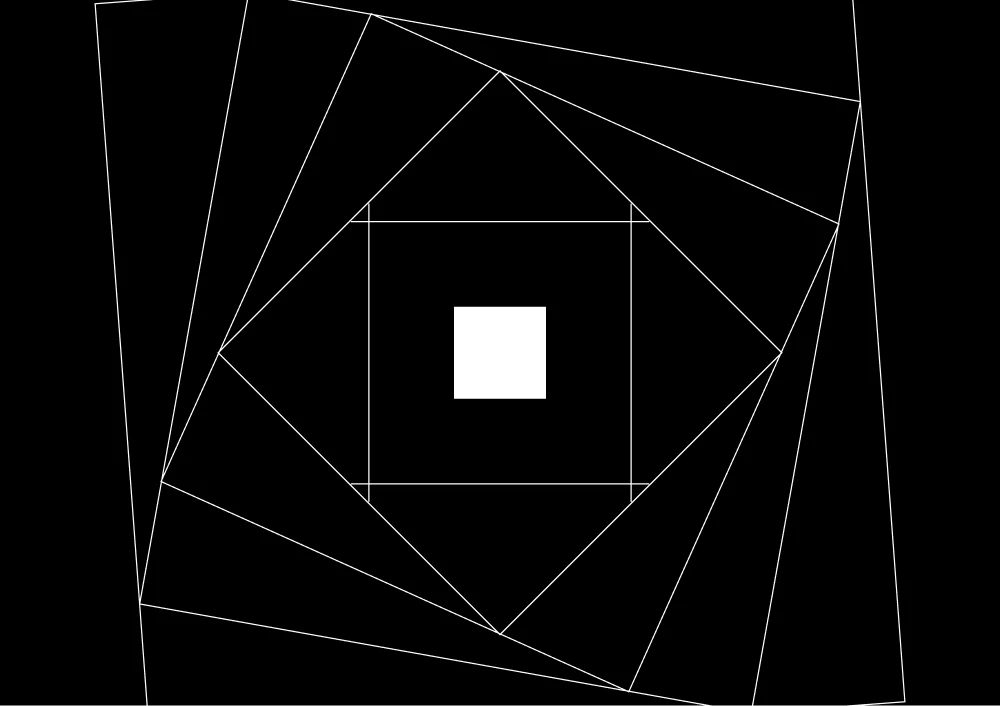
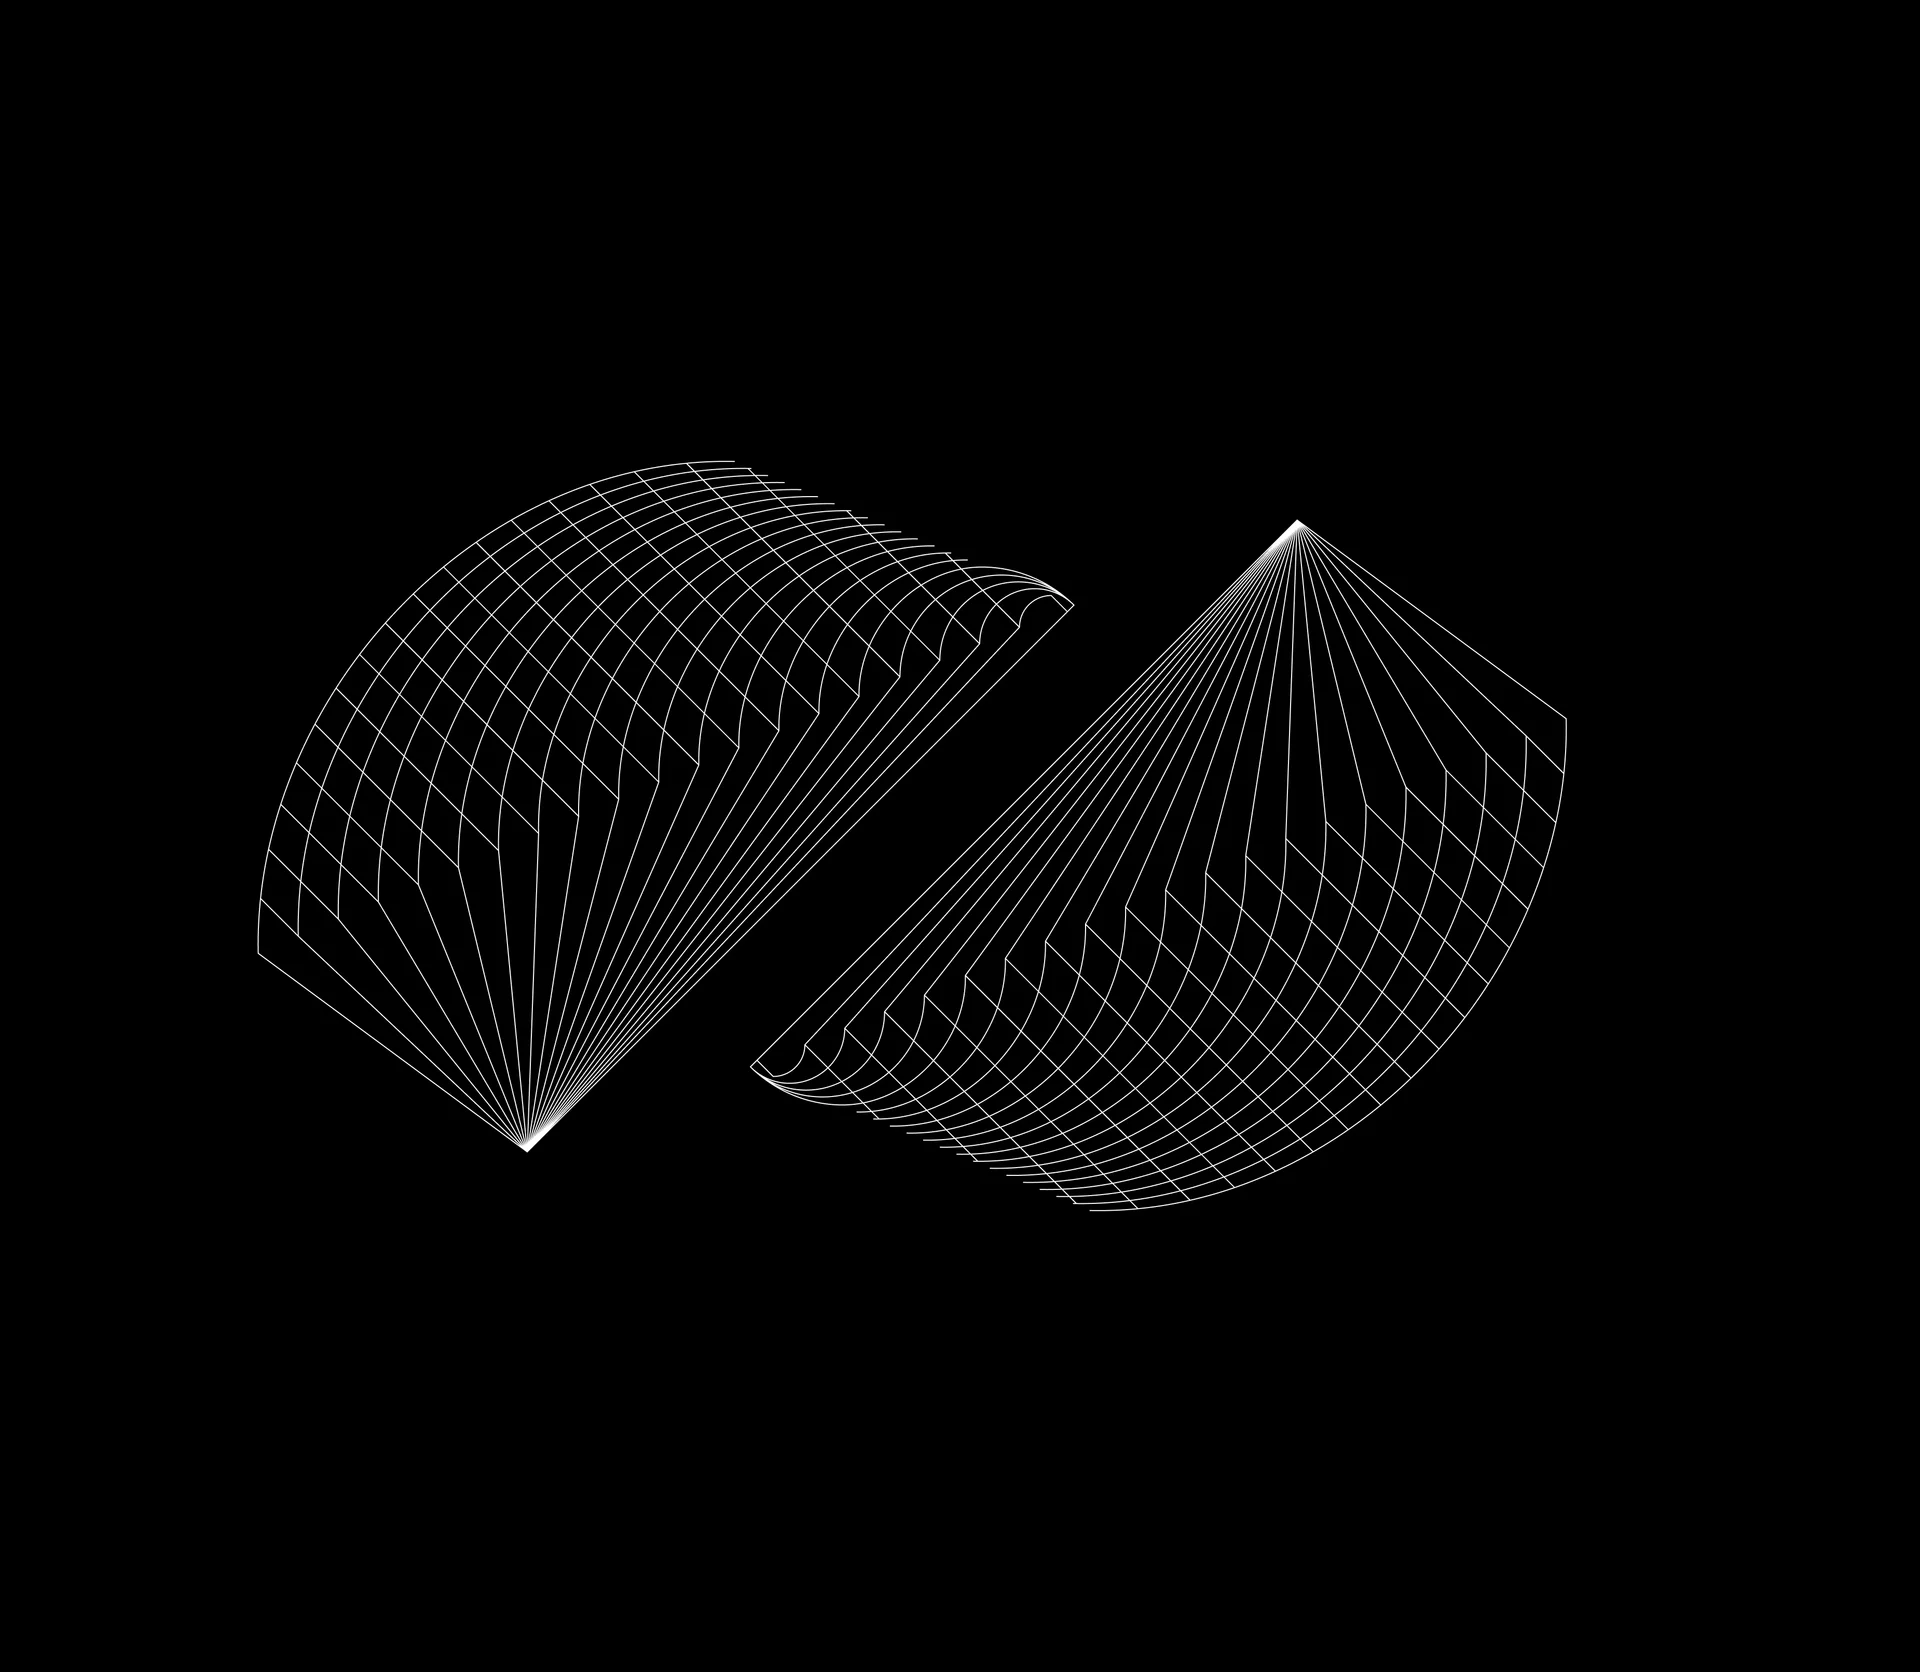
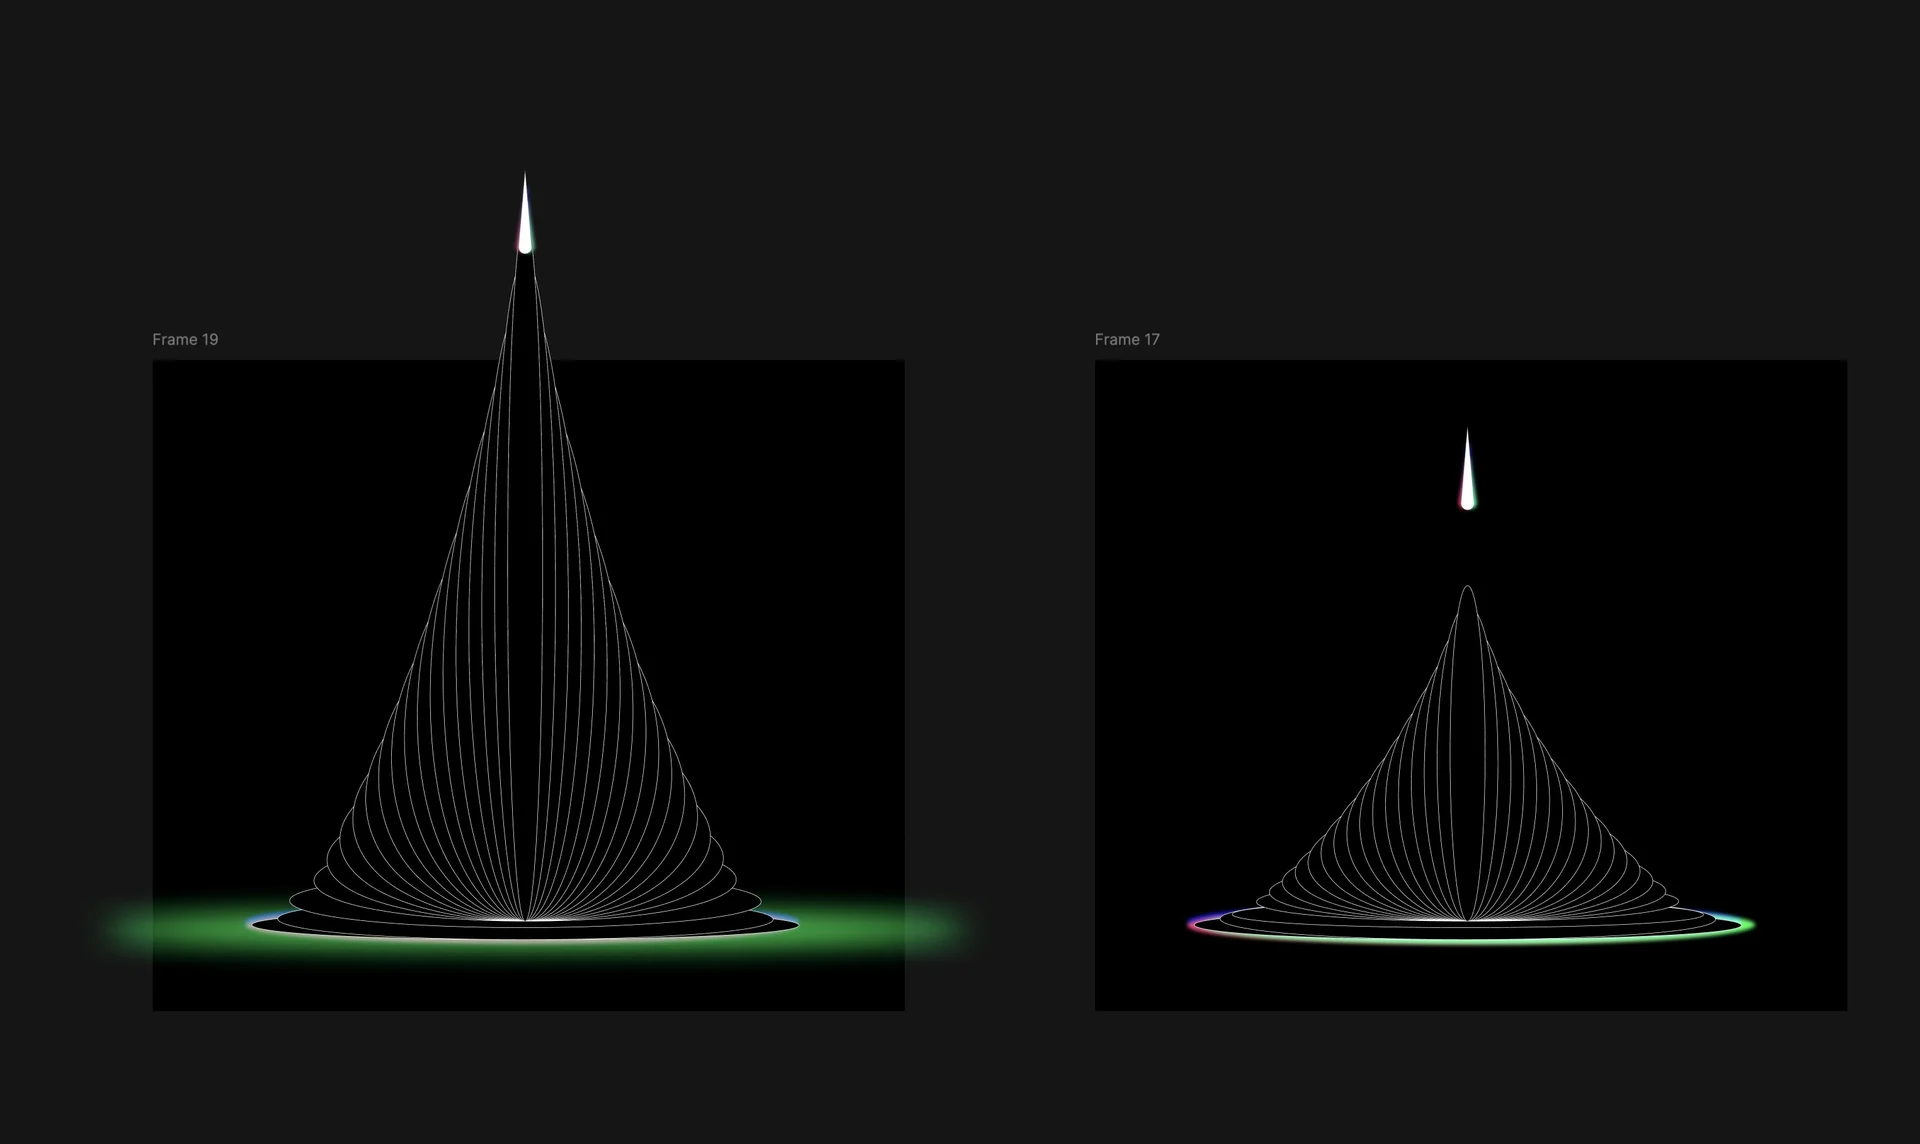
I was trying to find a way to morph and shape these SVGs with motion, almost like a gravitational ripple effect. The metaphor I was going with was the line within the old logo, the dash. I had this vision in my head where the line would come out from the logo and start creating these geometric shapes. They would move, morph, change, and transform. There would be small pulses of color when the motion was activated and would go off the screen.
Like geometric, elegant spiderwebs that could be interacted with. The lines of the table interface becoming something--a thread you could pull on.
Strange things happen when you stare at tables for two years.







A logo made of bits
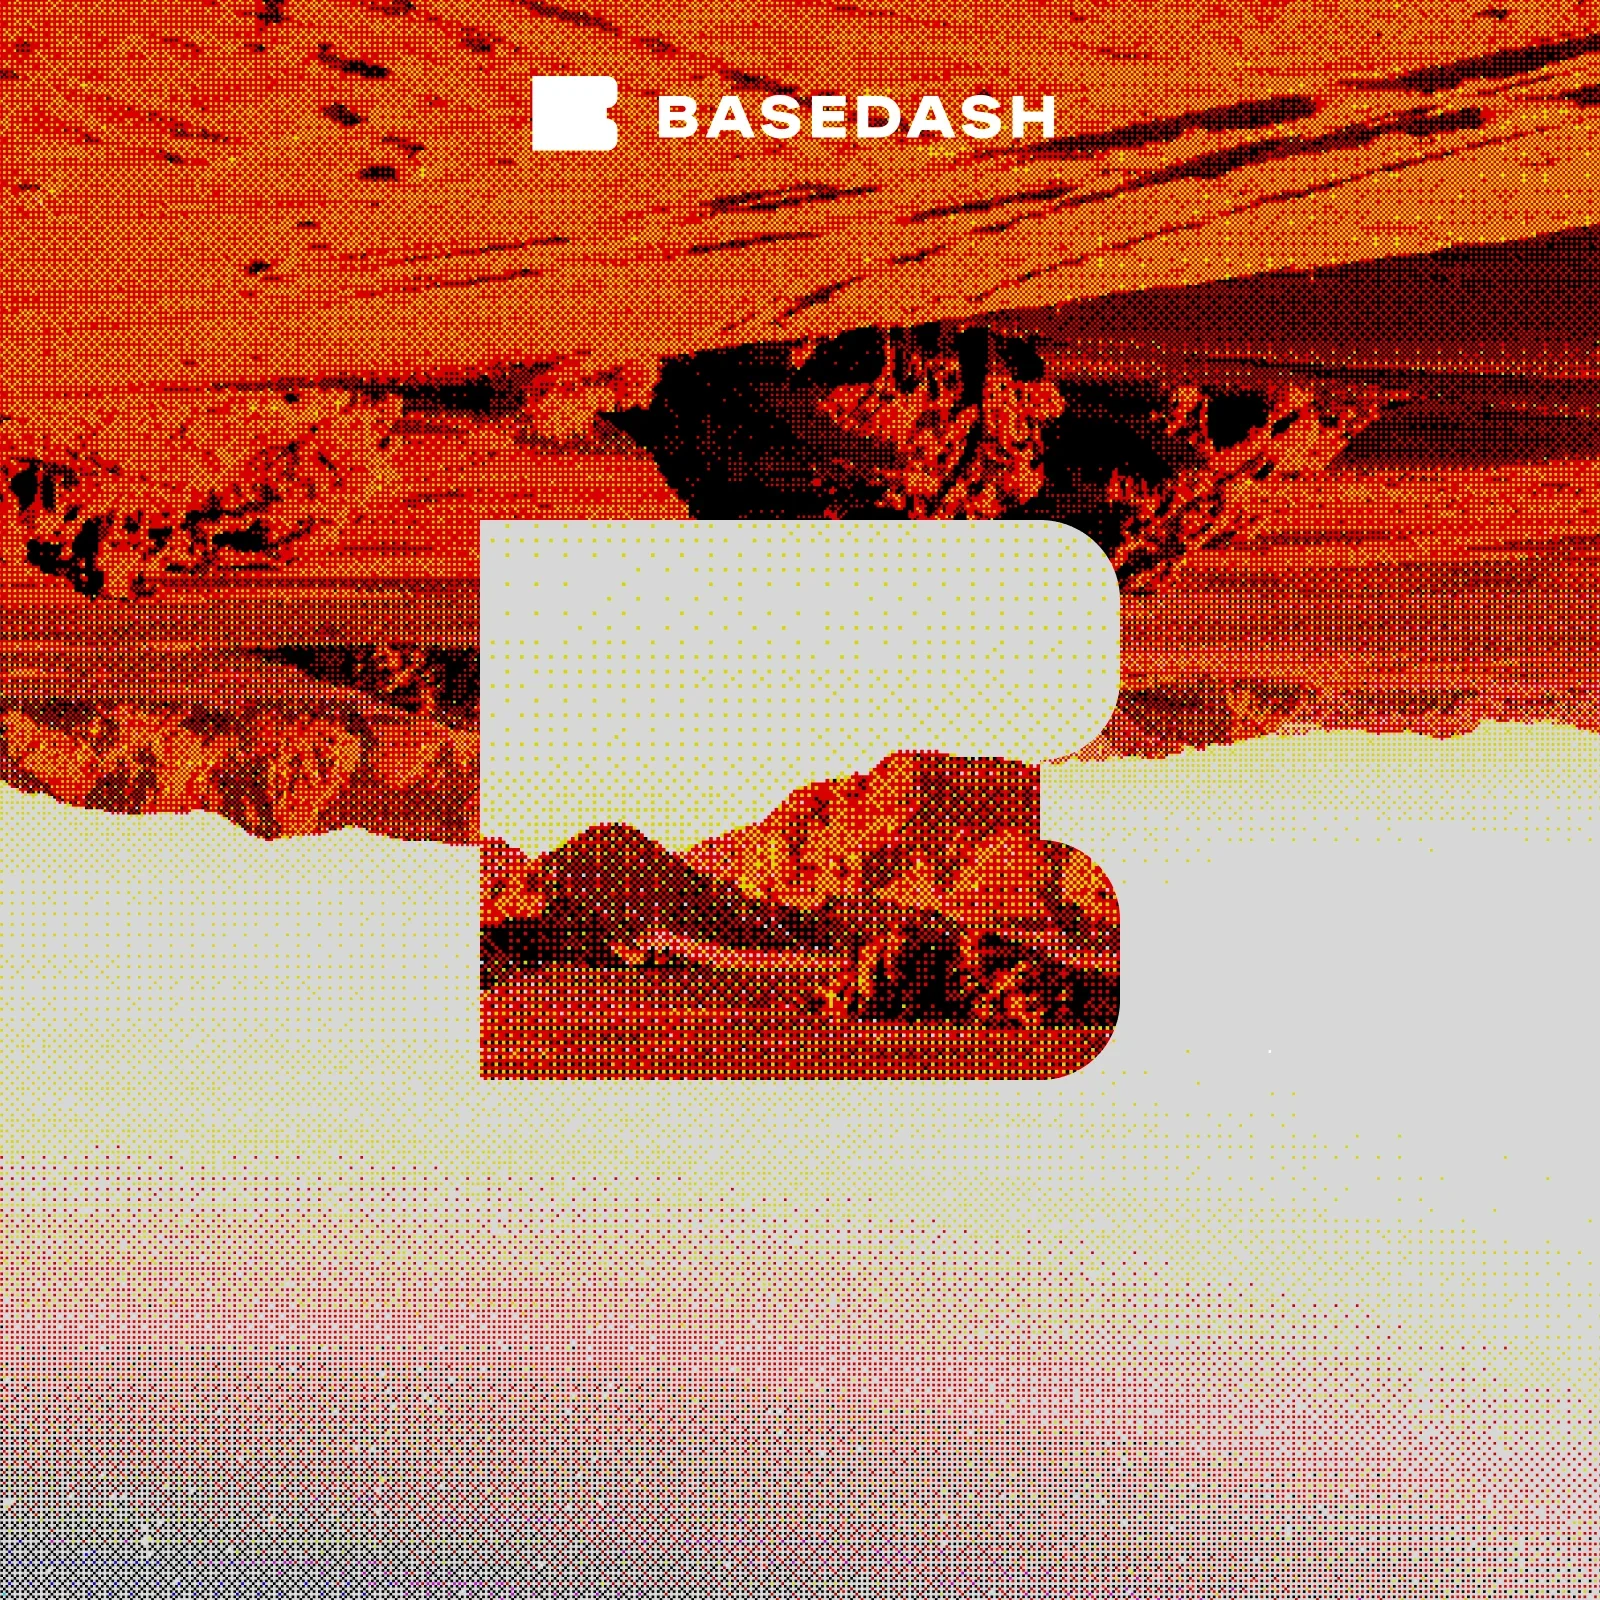
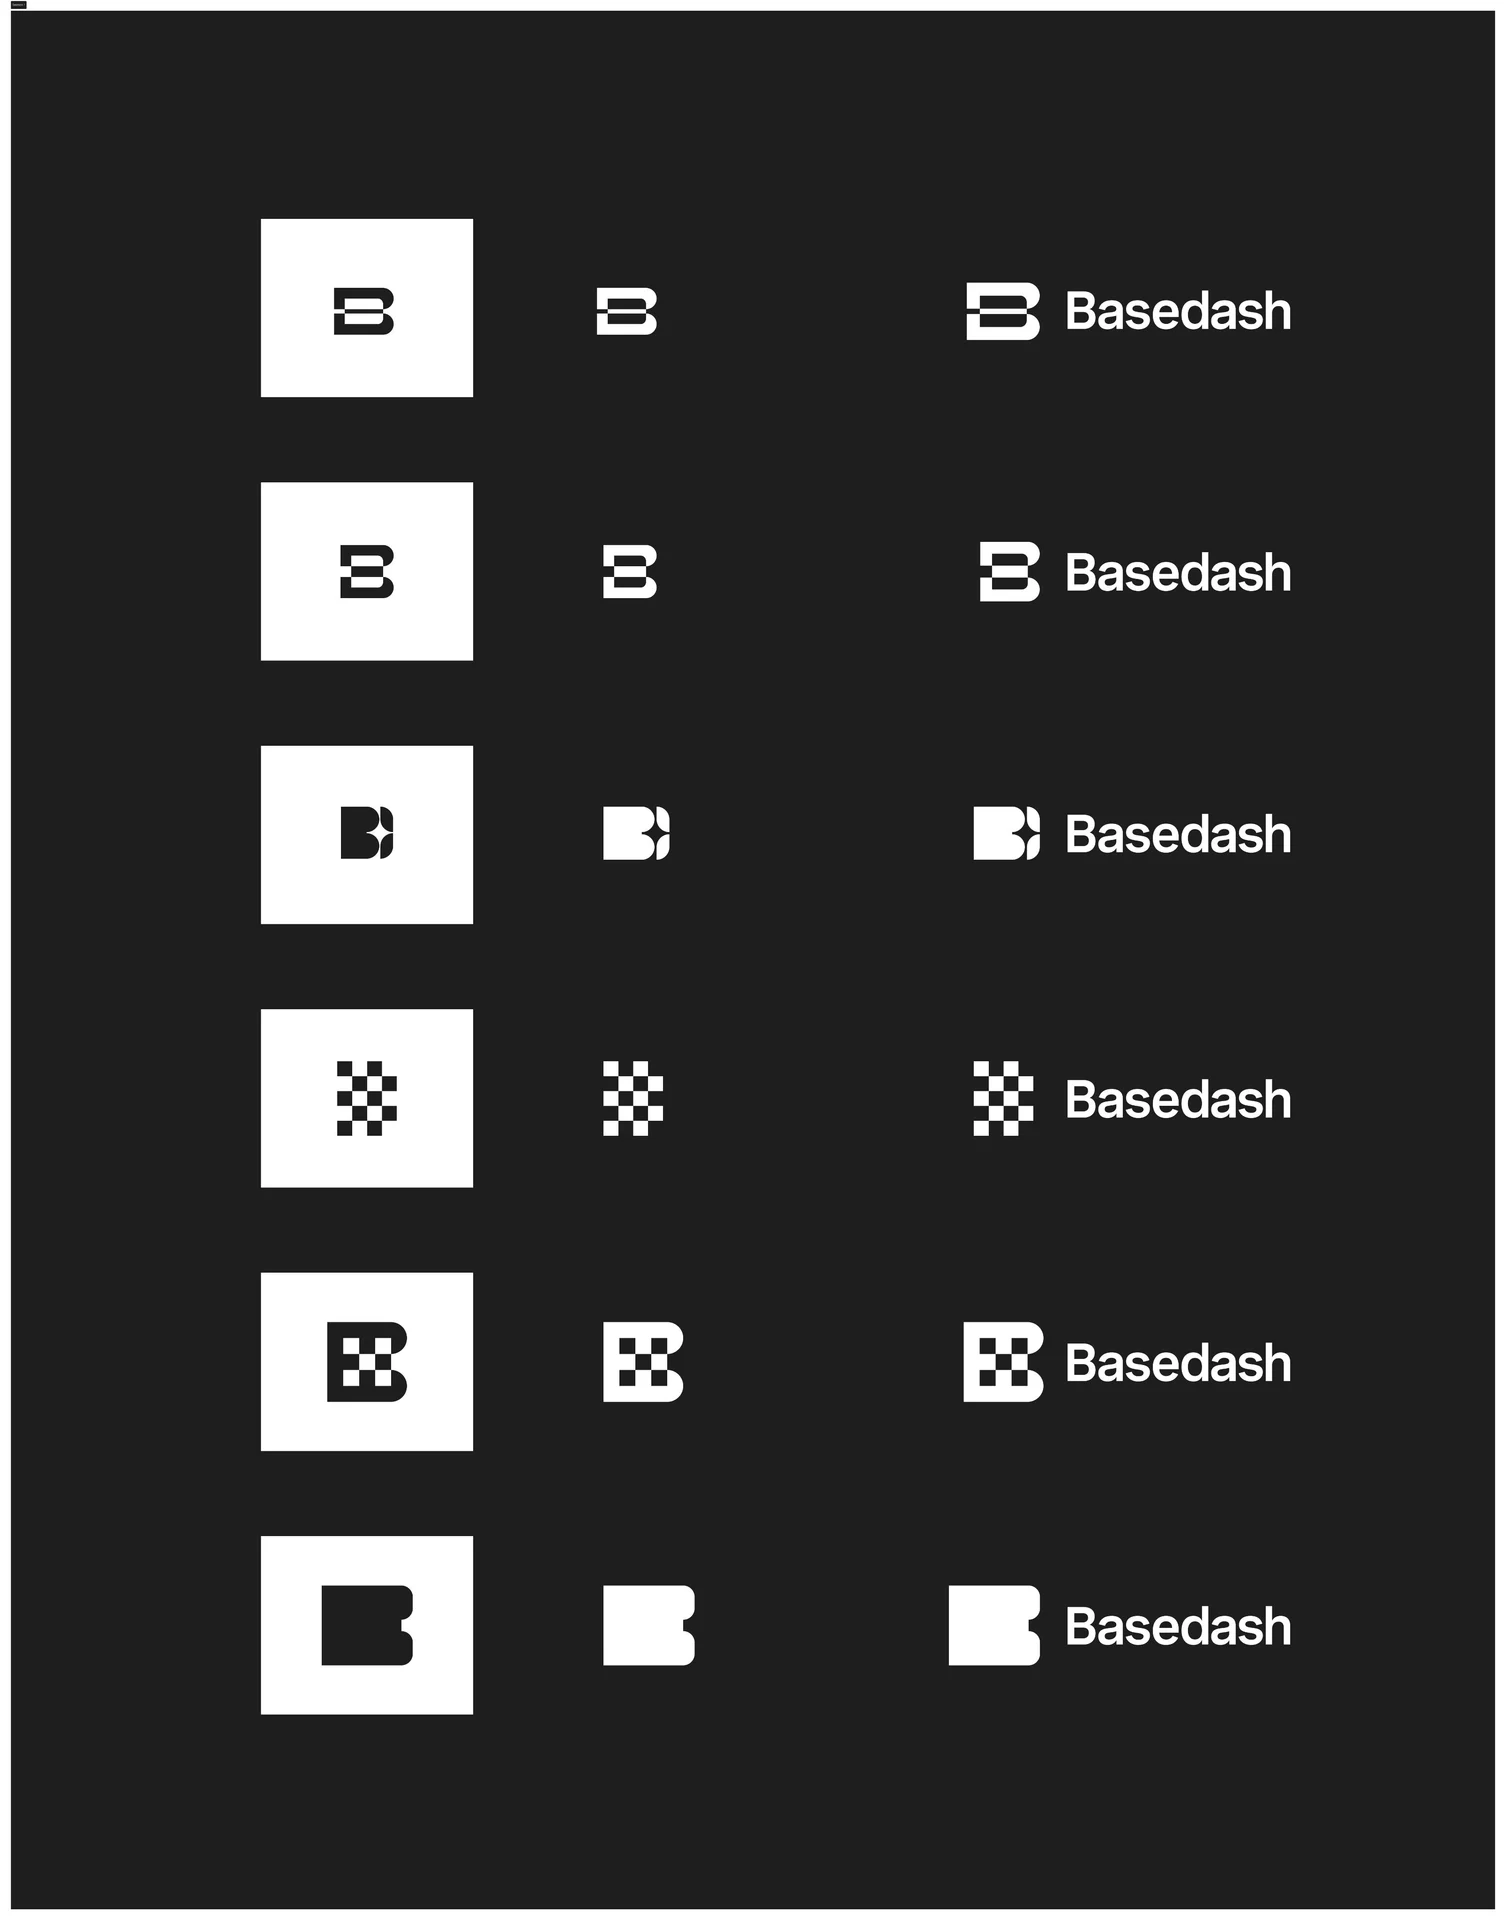
Speaking of rebrand, the new logo took quite a bit of revisions to get right. Some of these were kind of cool, not gonna lie.
Maybe not original, but kind of cool.
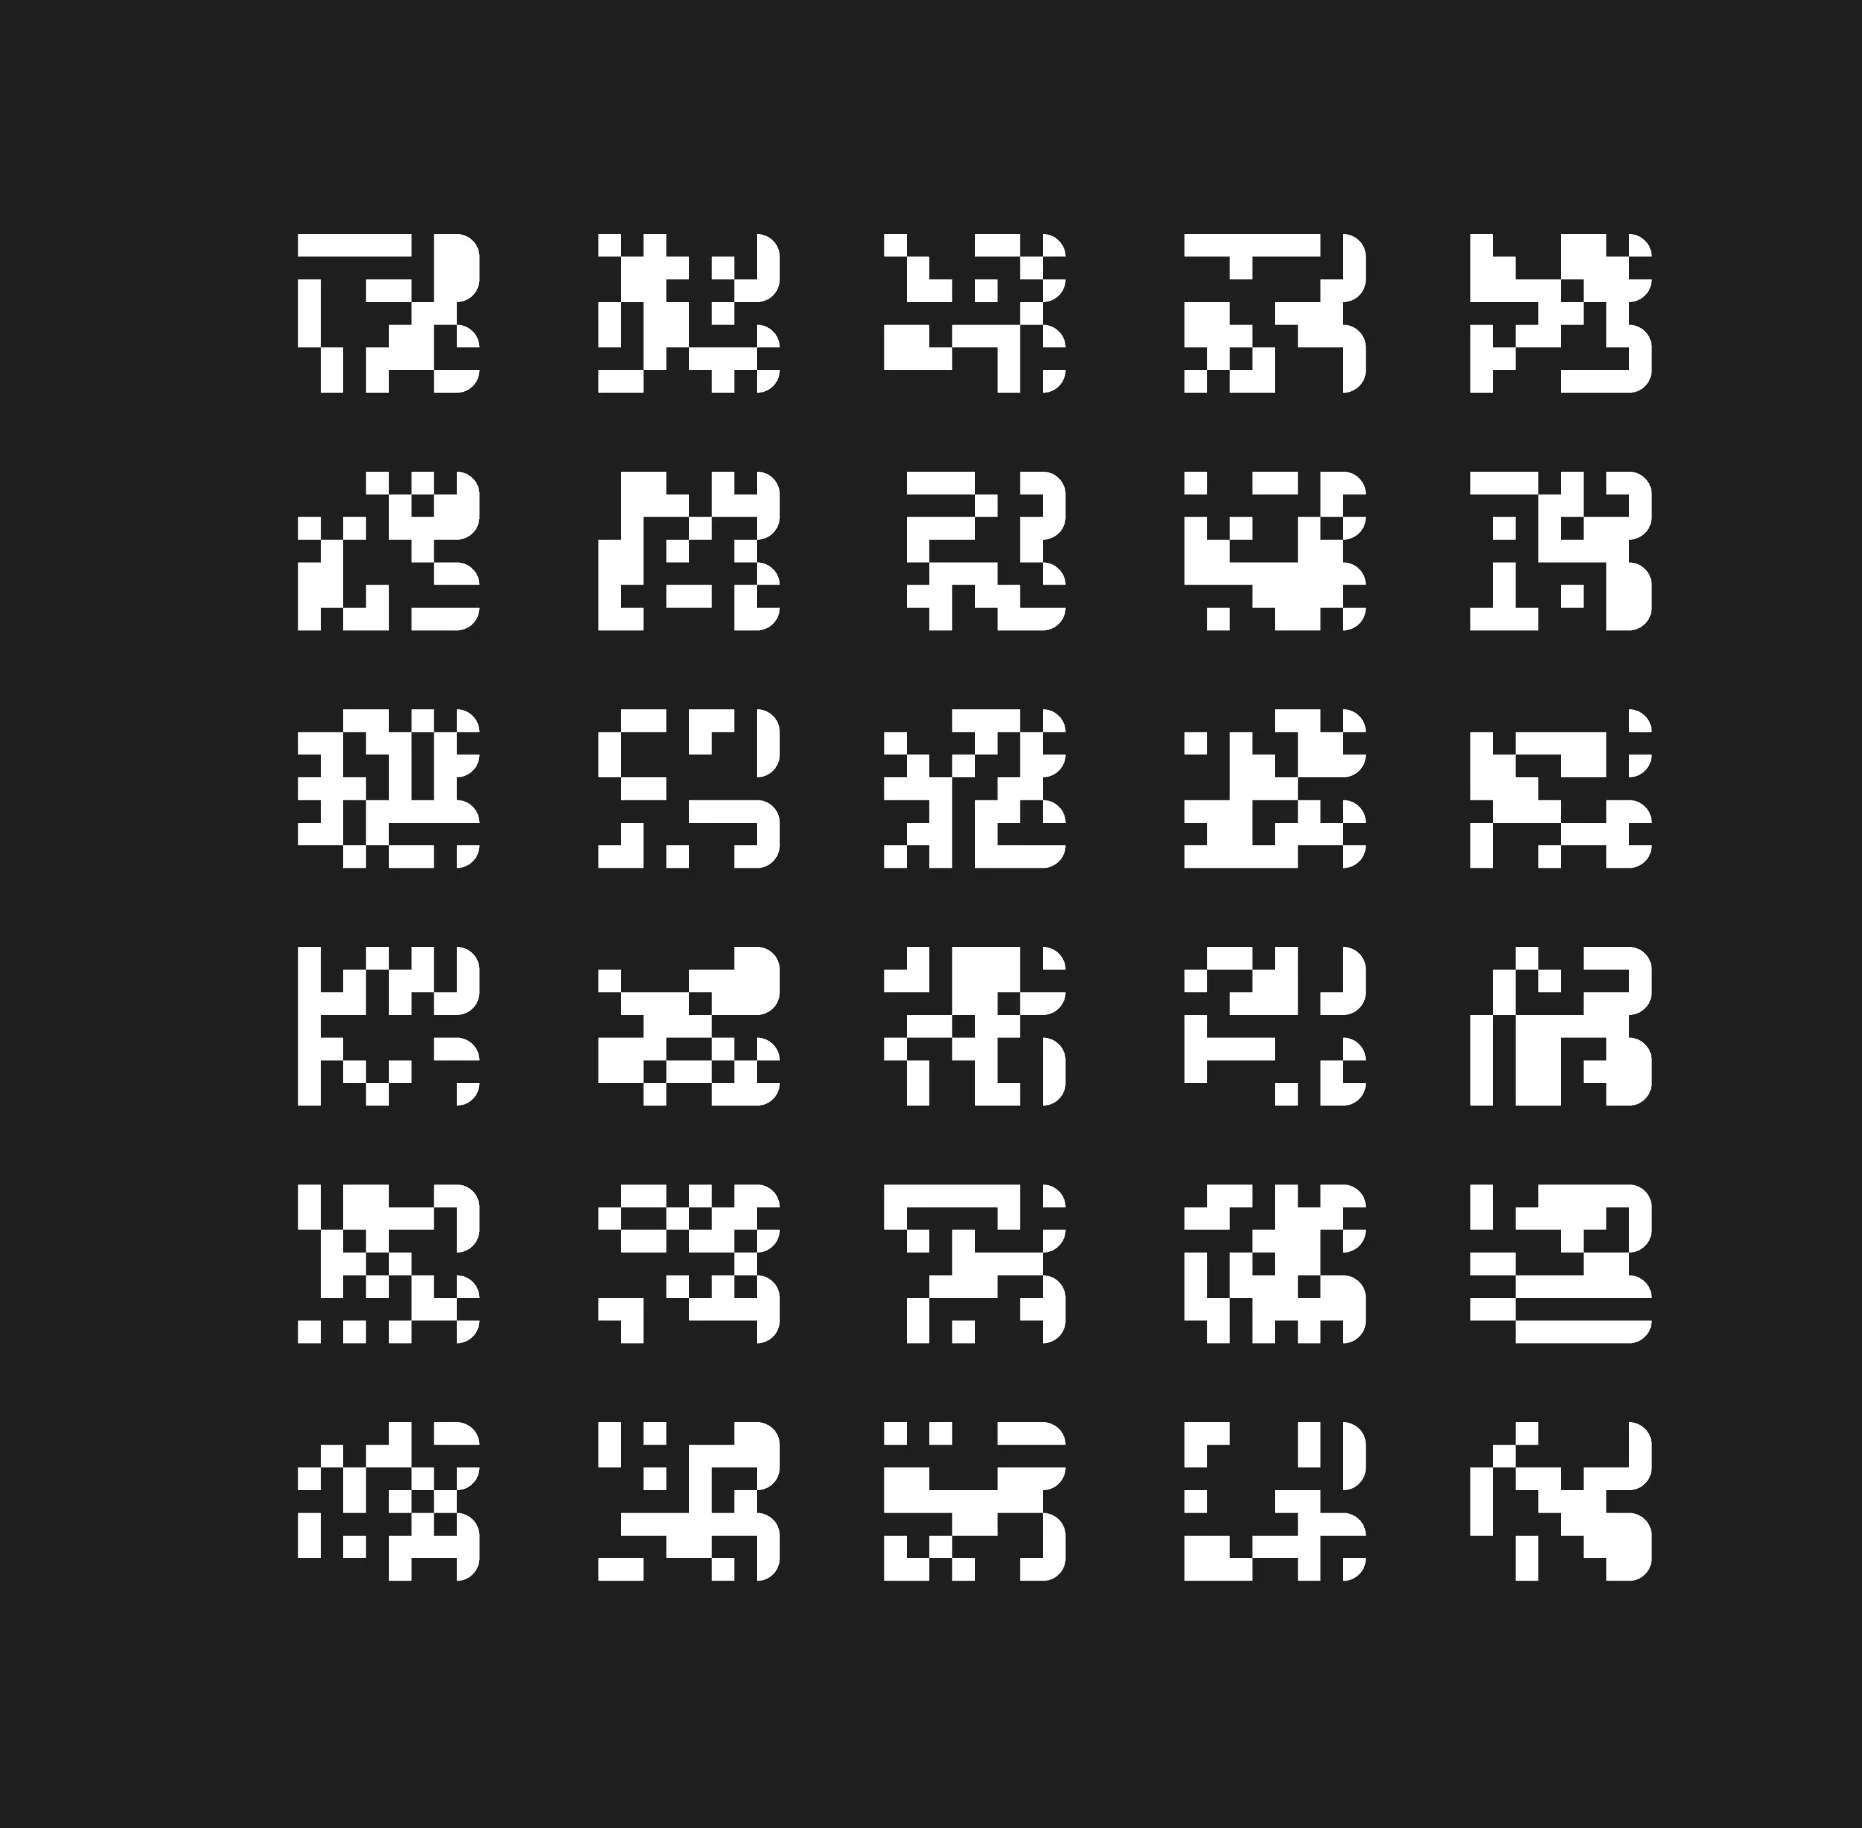
This is a concept I had where the logo itself would be a dithered texture.
It would be divided into this grid of bits, and then every time the page loaded, it would transform and change into almost like a QR code grid, meaning the logo would be procedural.
There would be four default resting states: a block, one with lines, one that was kind of glitched out, but the loading state would be just a random assortment of glitched characters that would resolve into one of the final filled shapes.
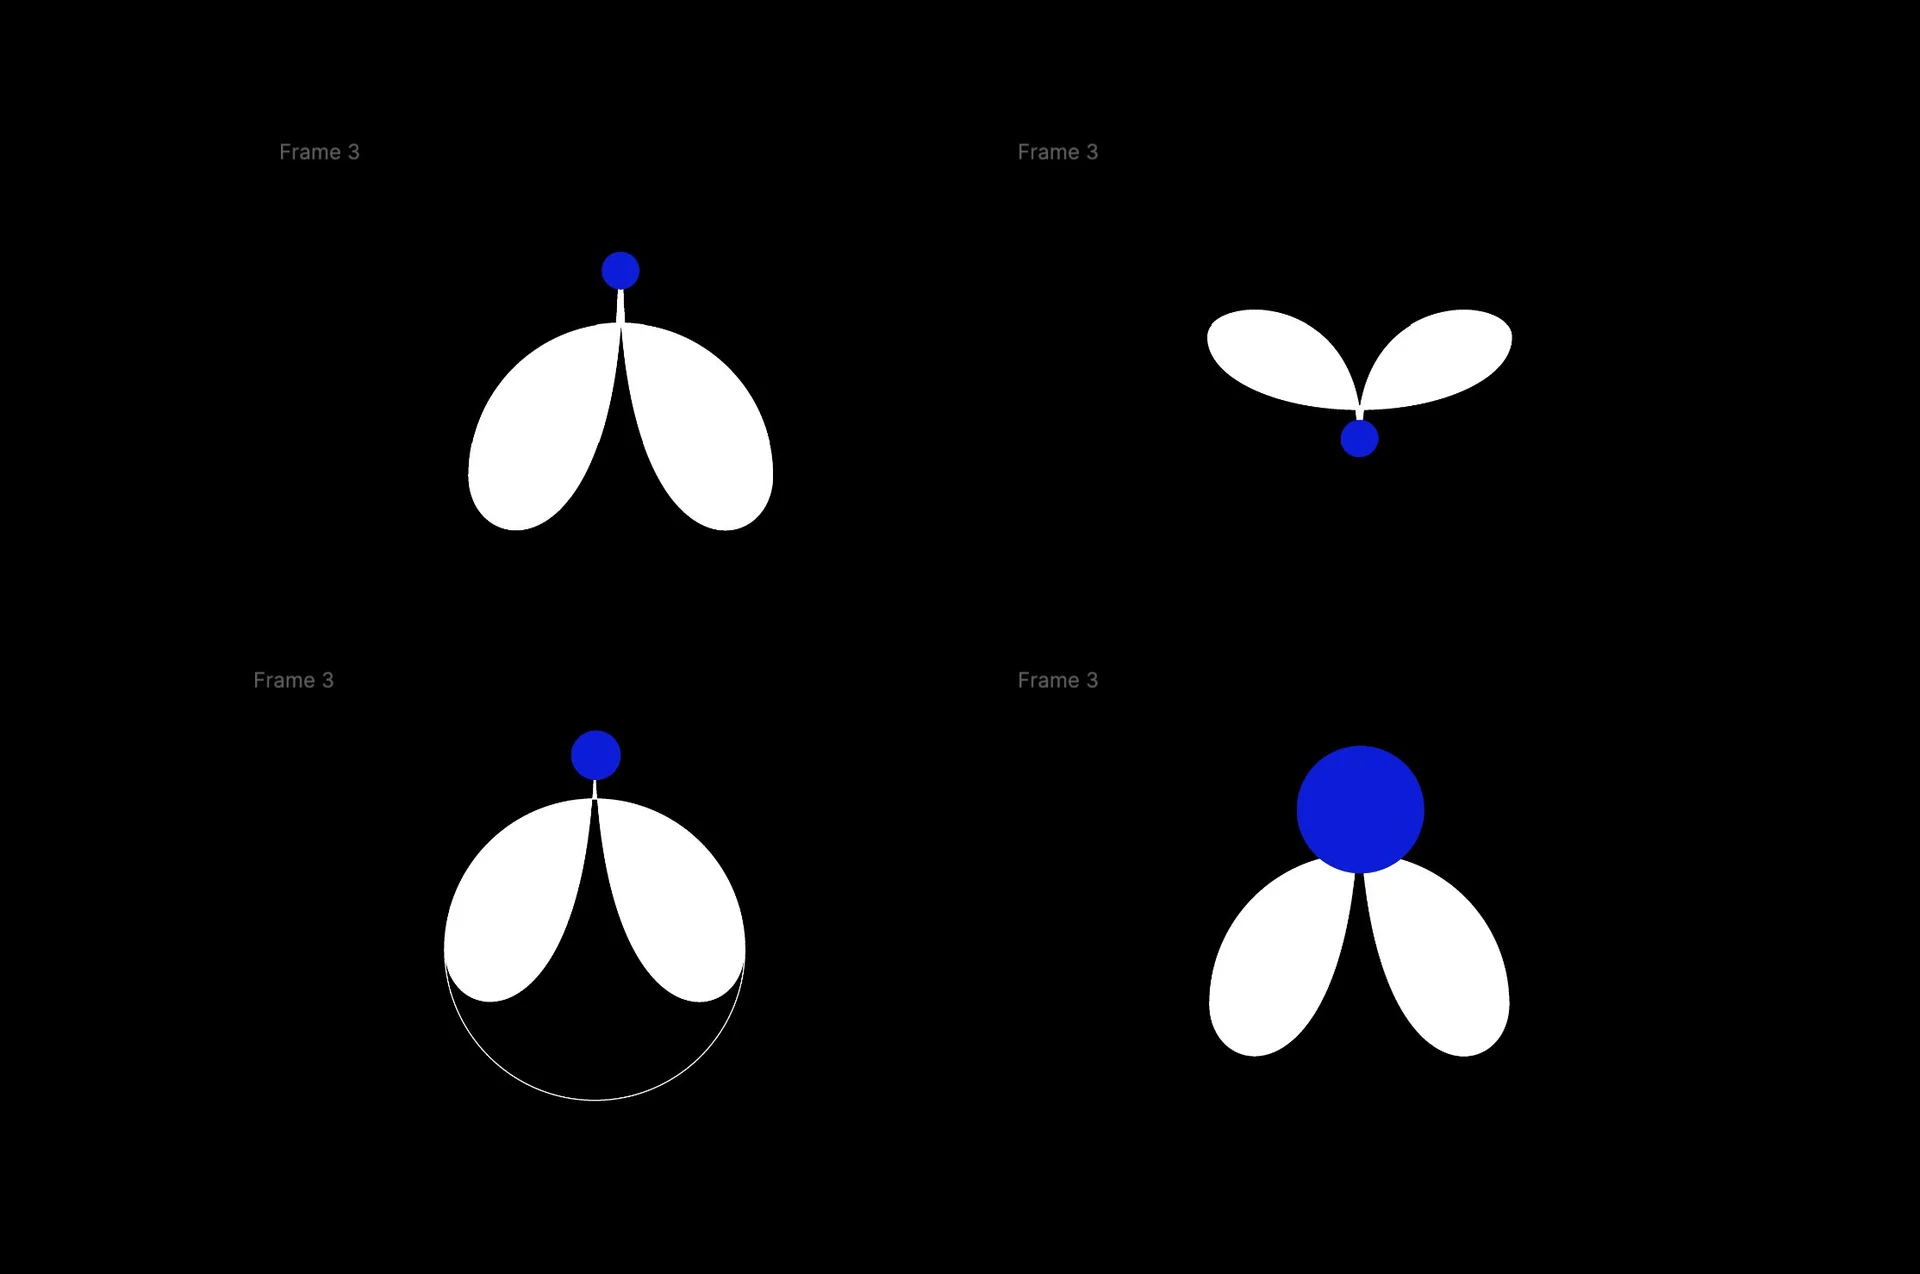
Further logo studies.
Another logo direction from the same exploration.


Funnels, connections, gauges, and generated dashboards
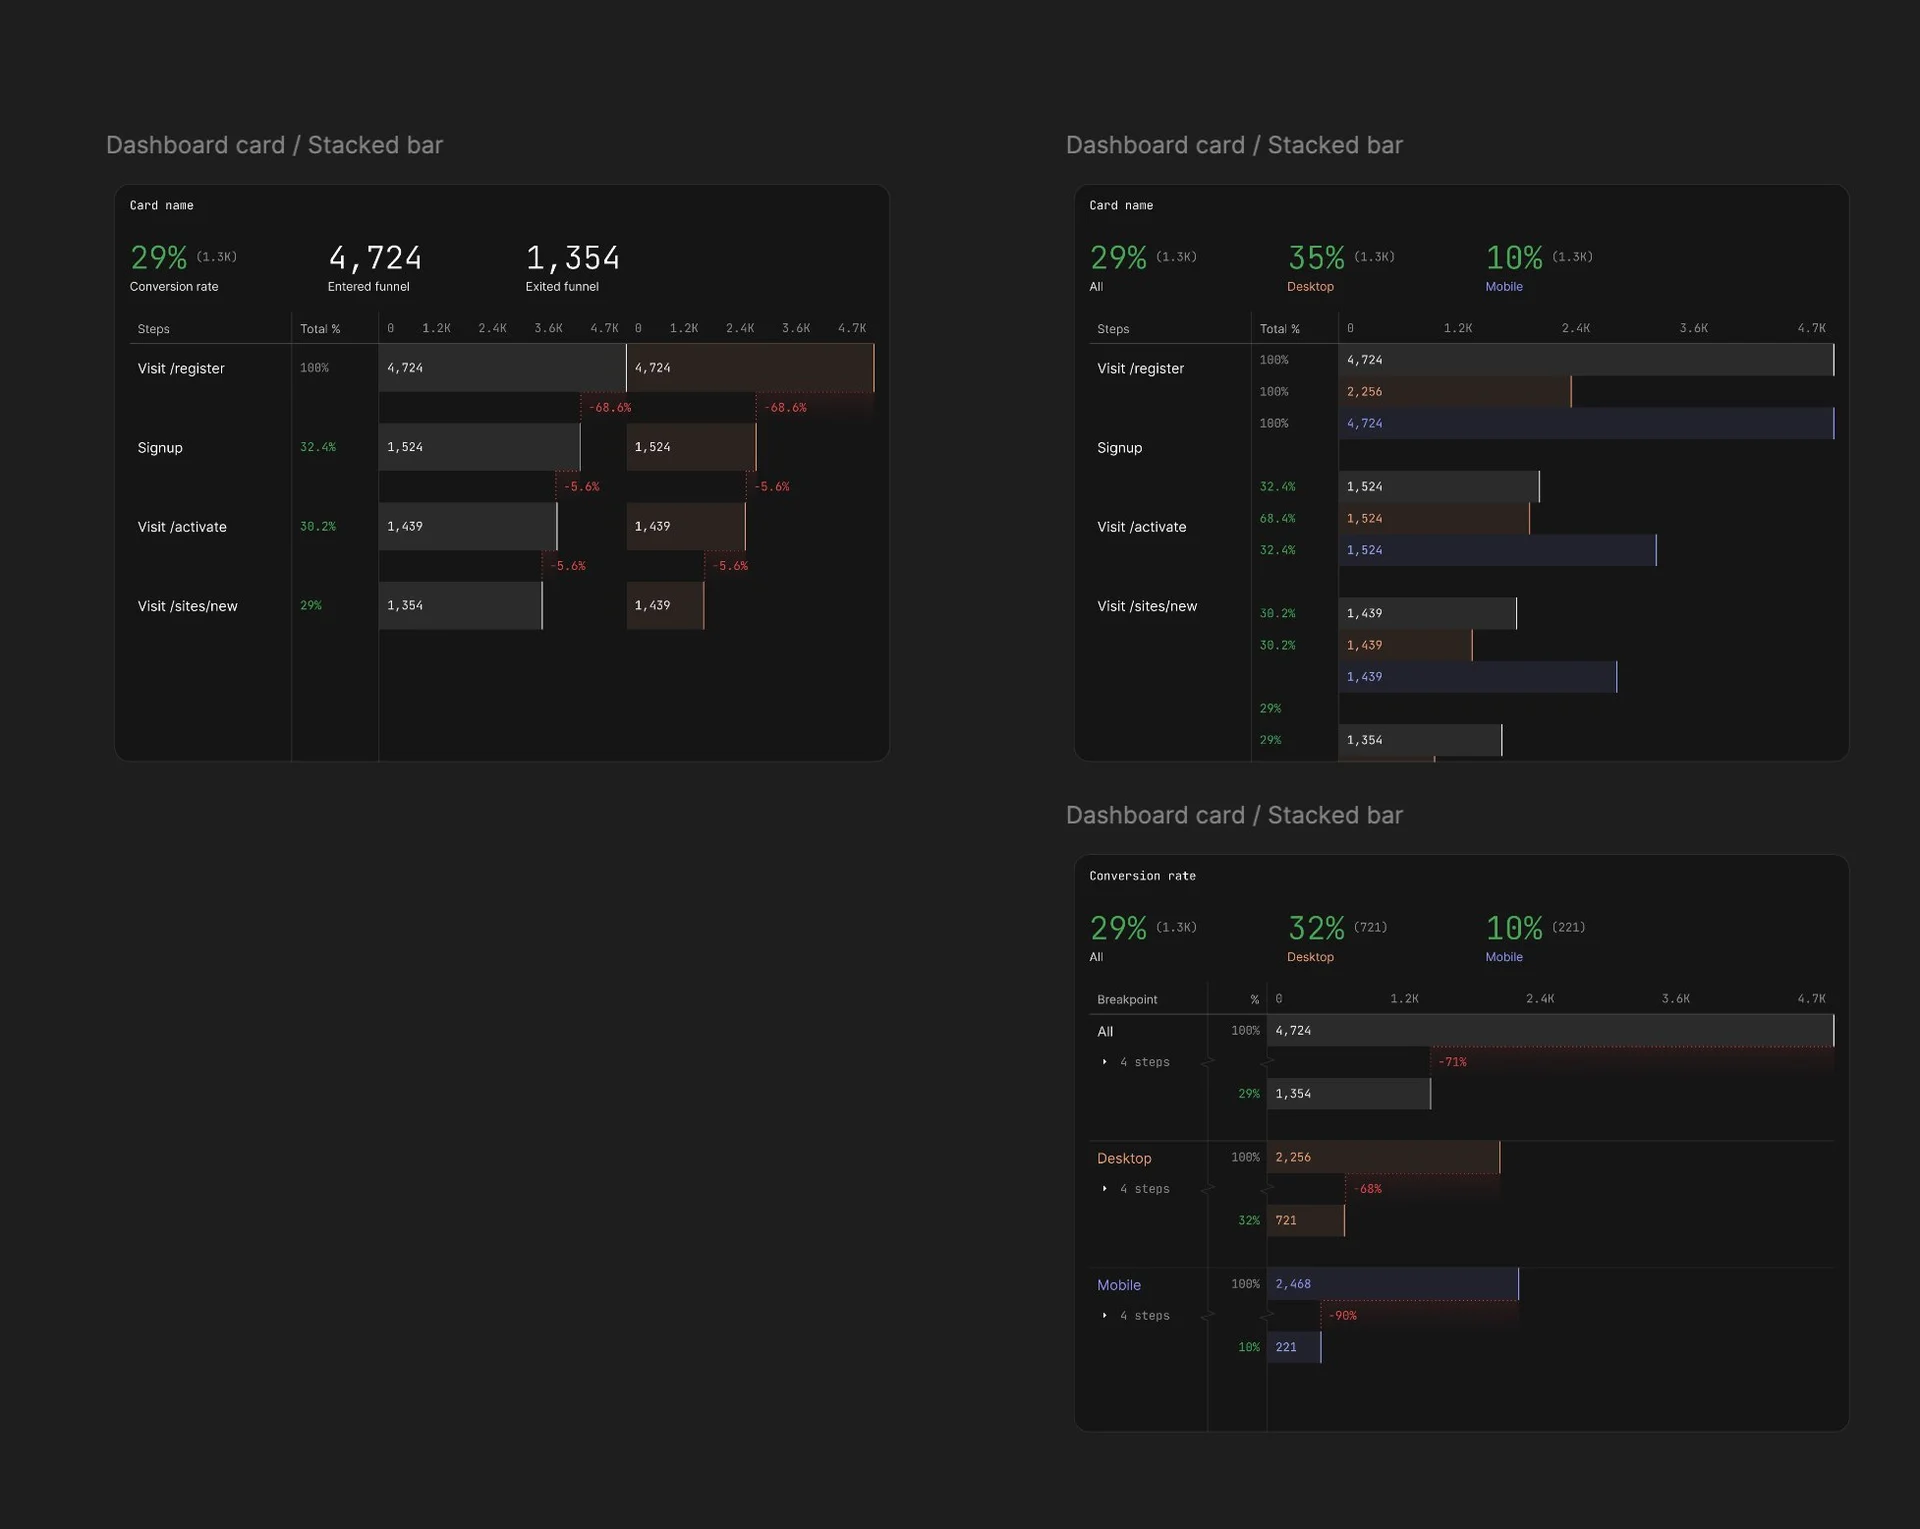
Funnel chart explorations.
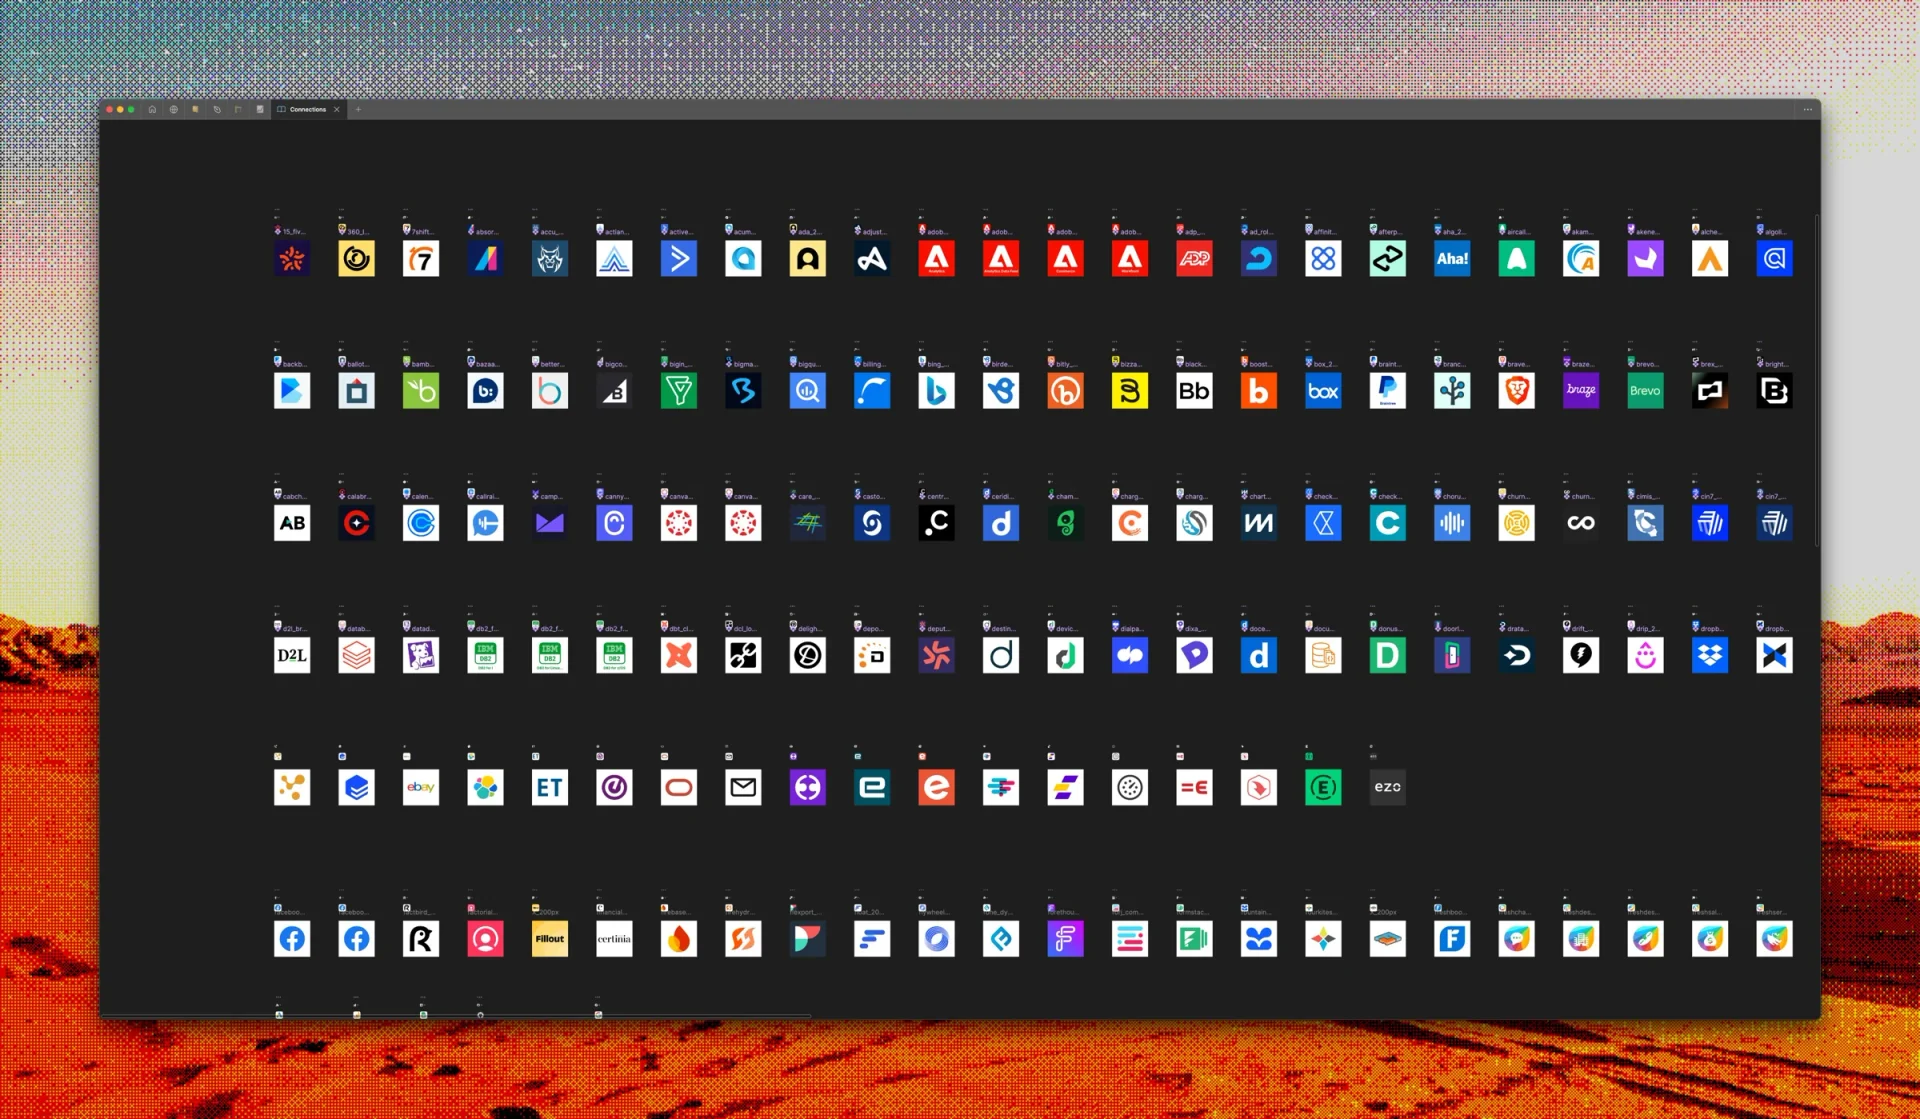
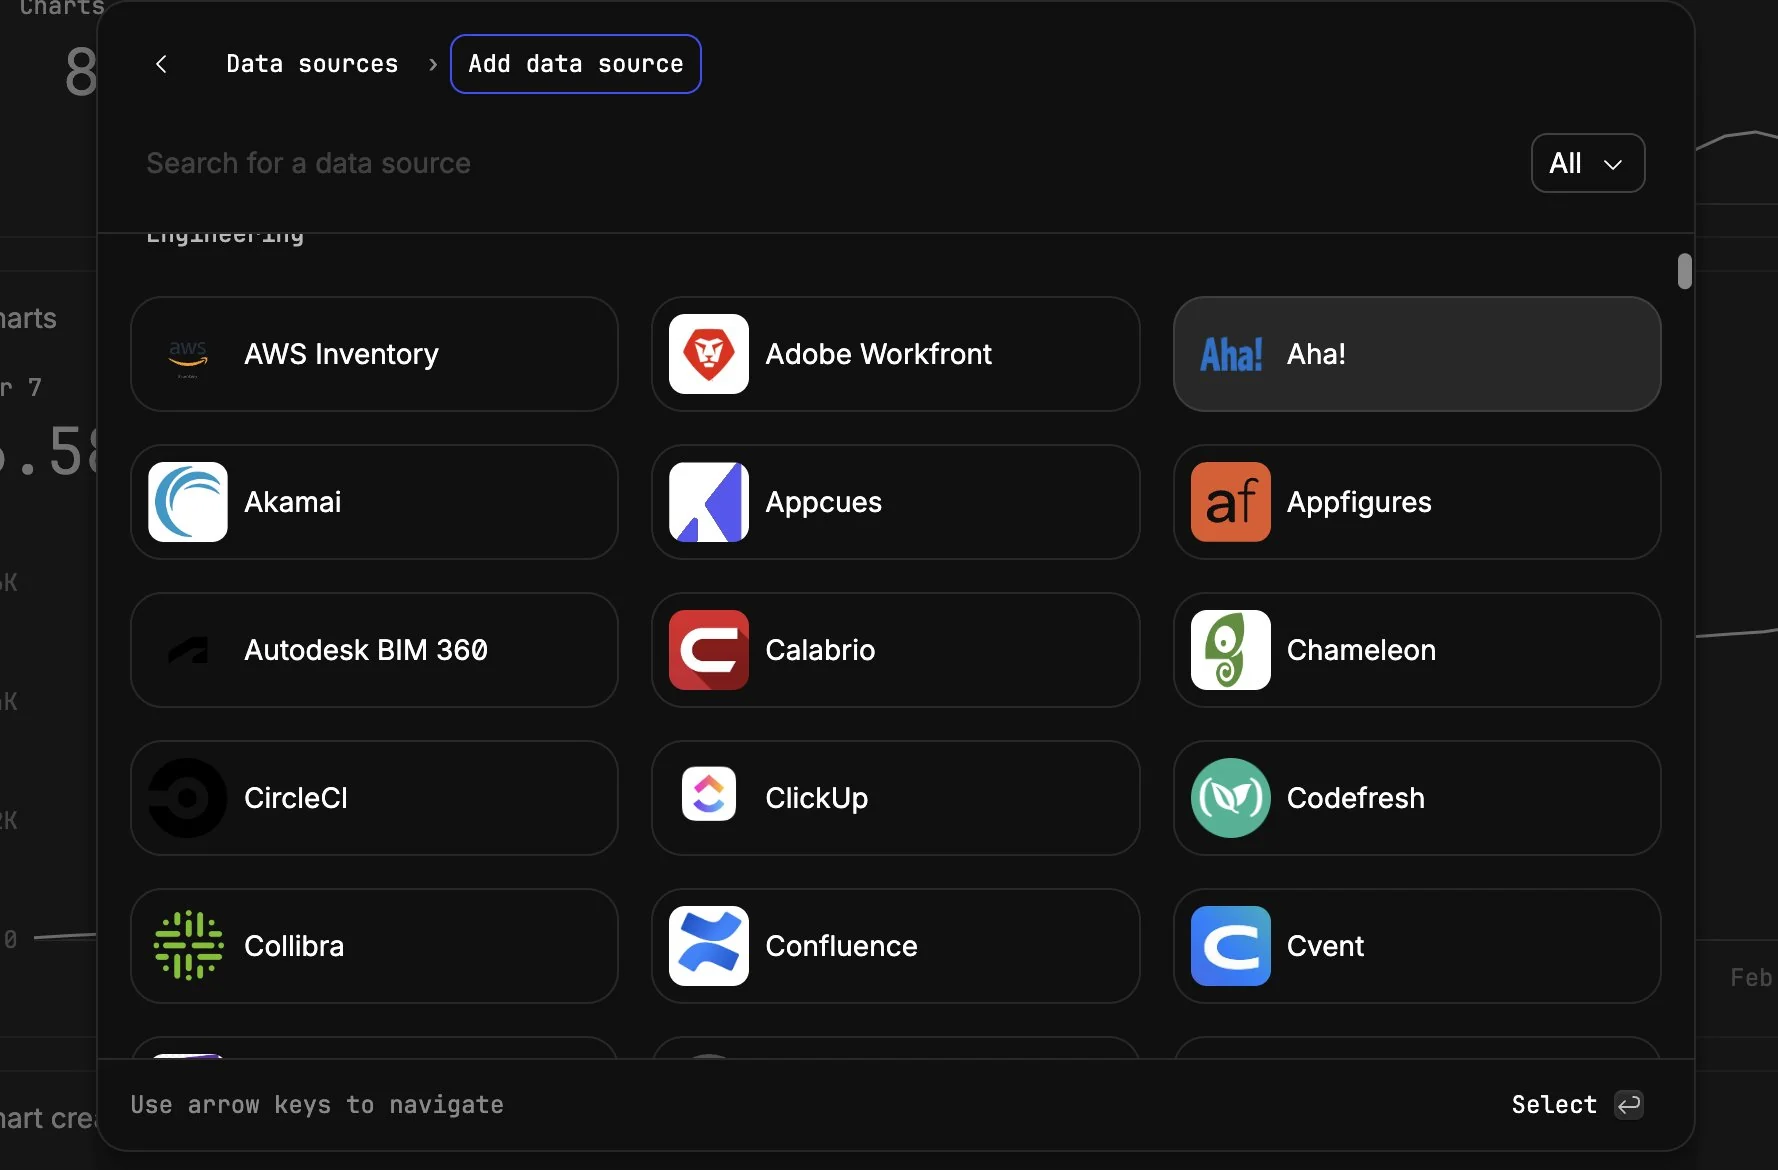
Connection modal explorations.
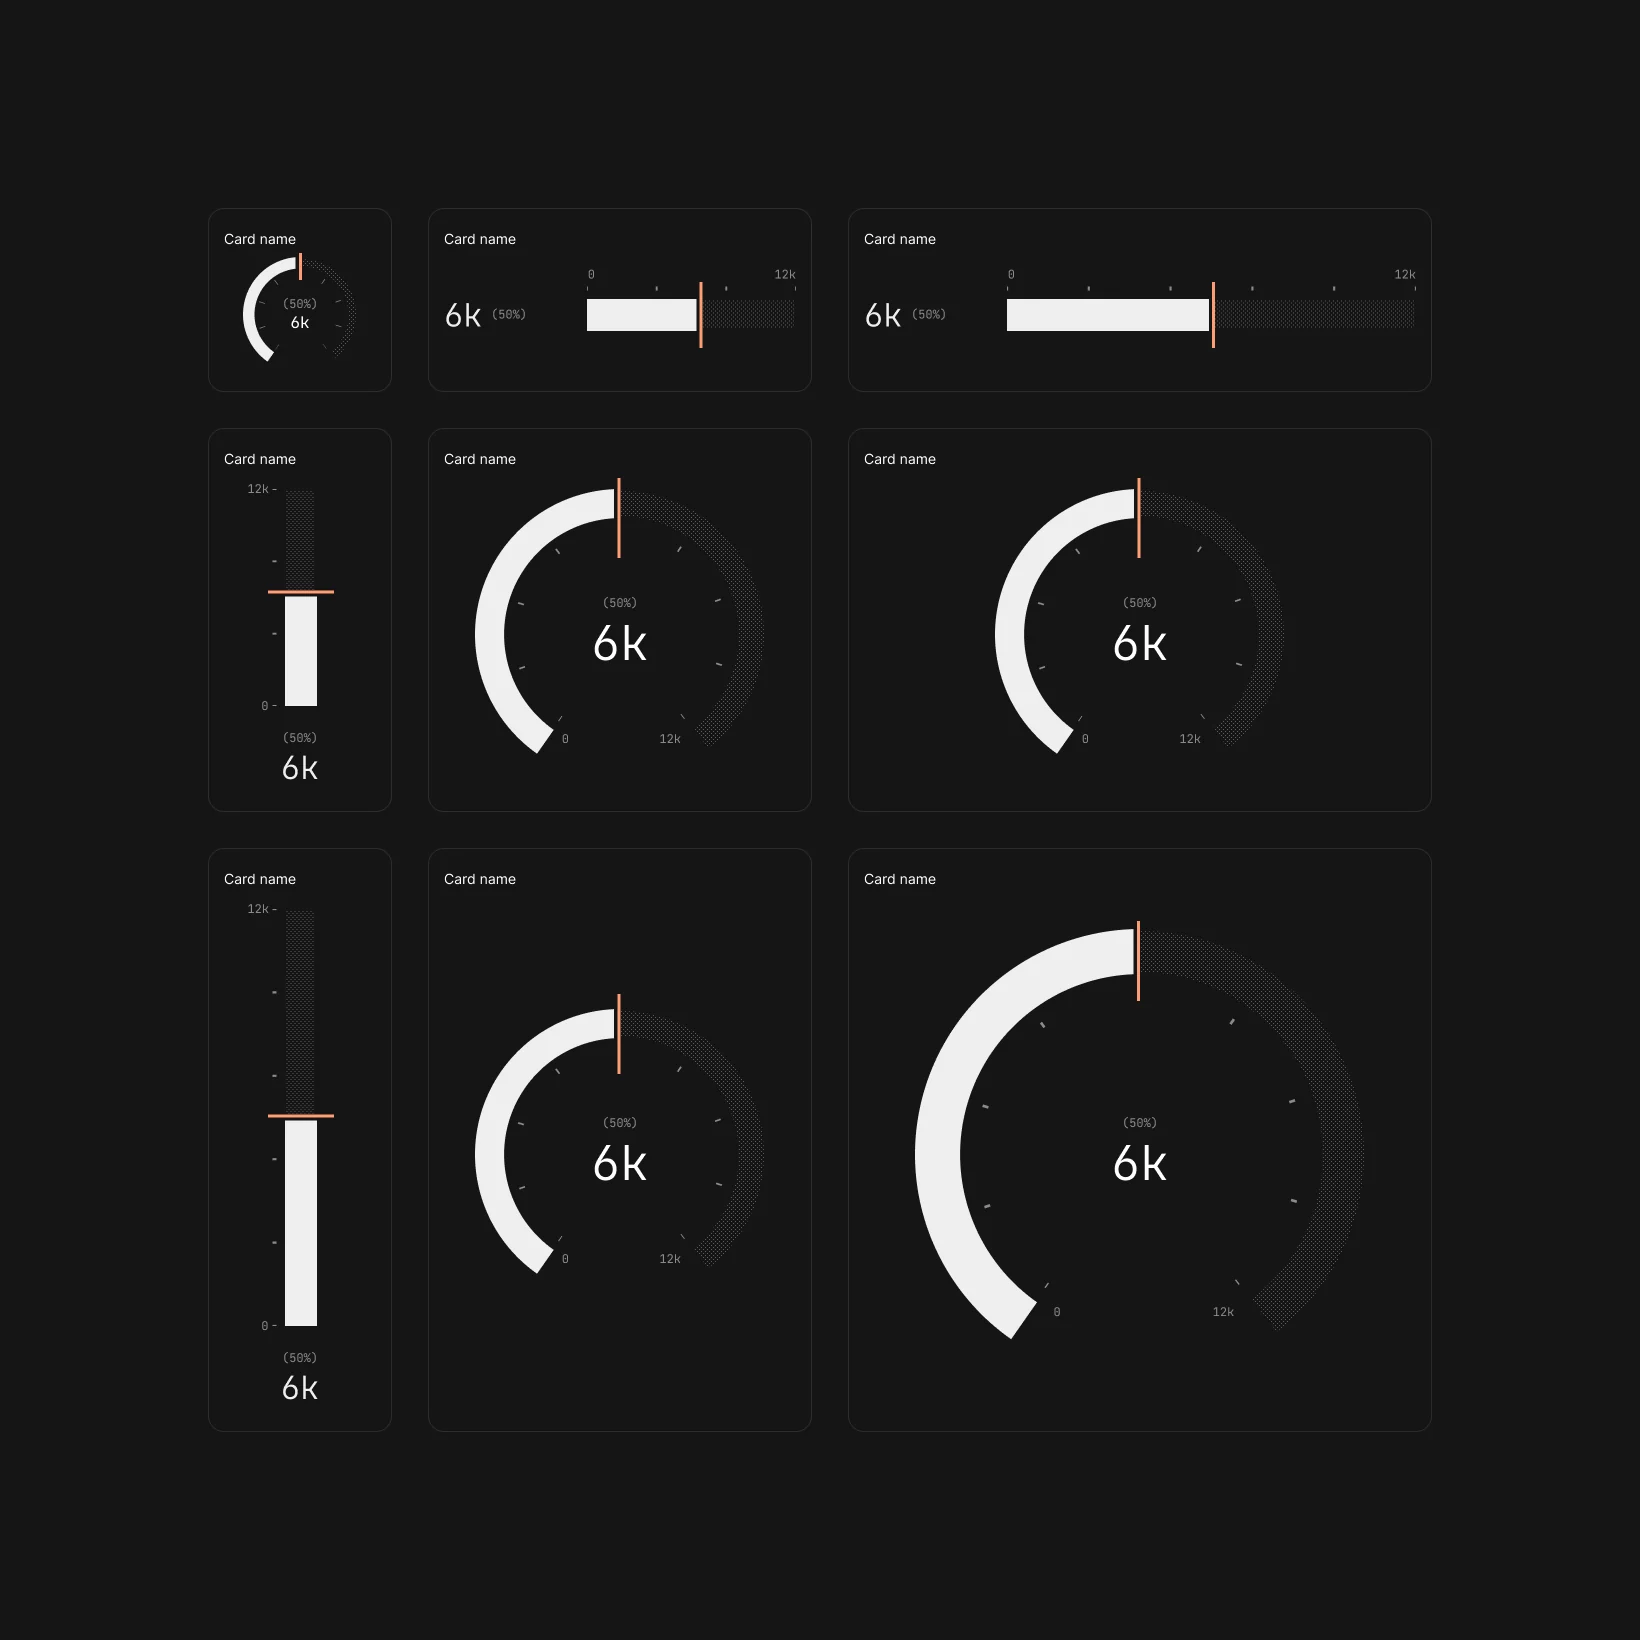
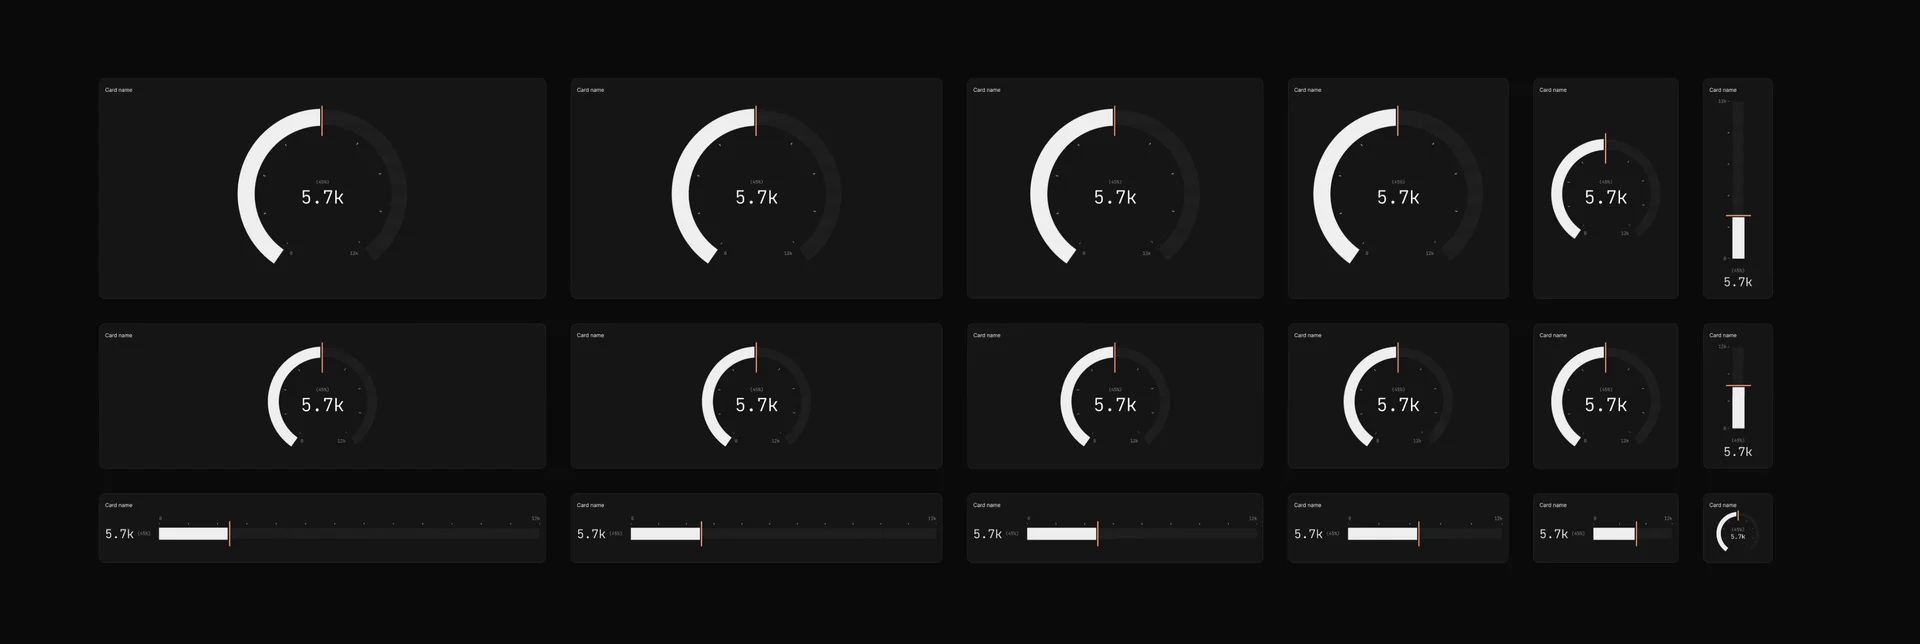
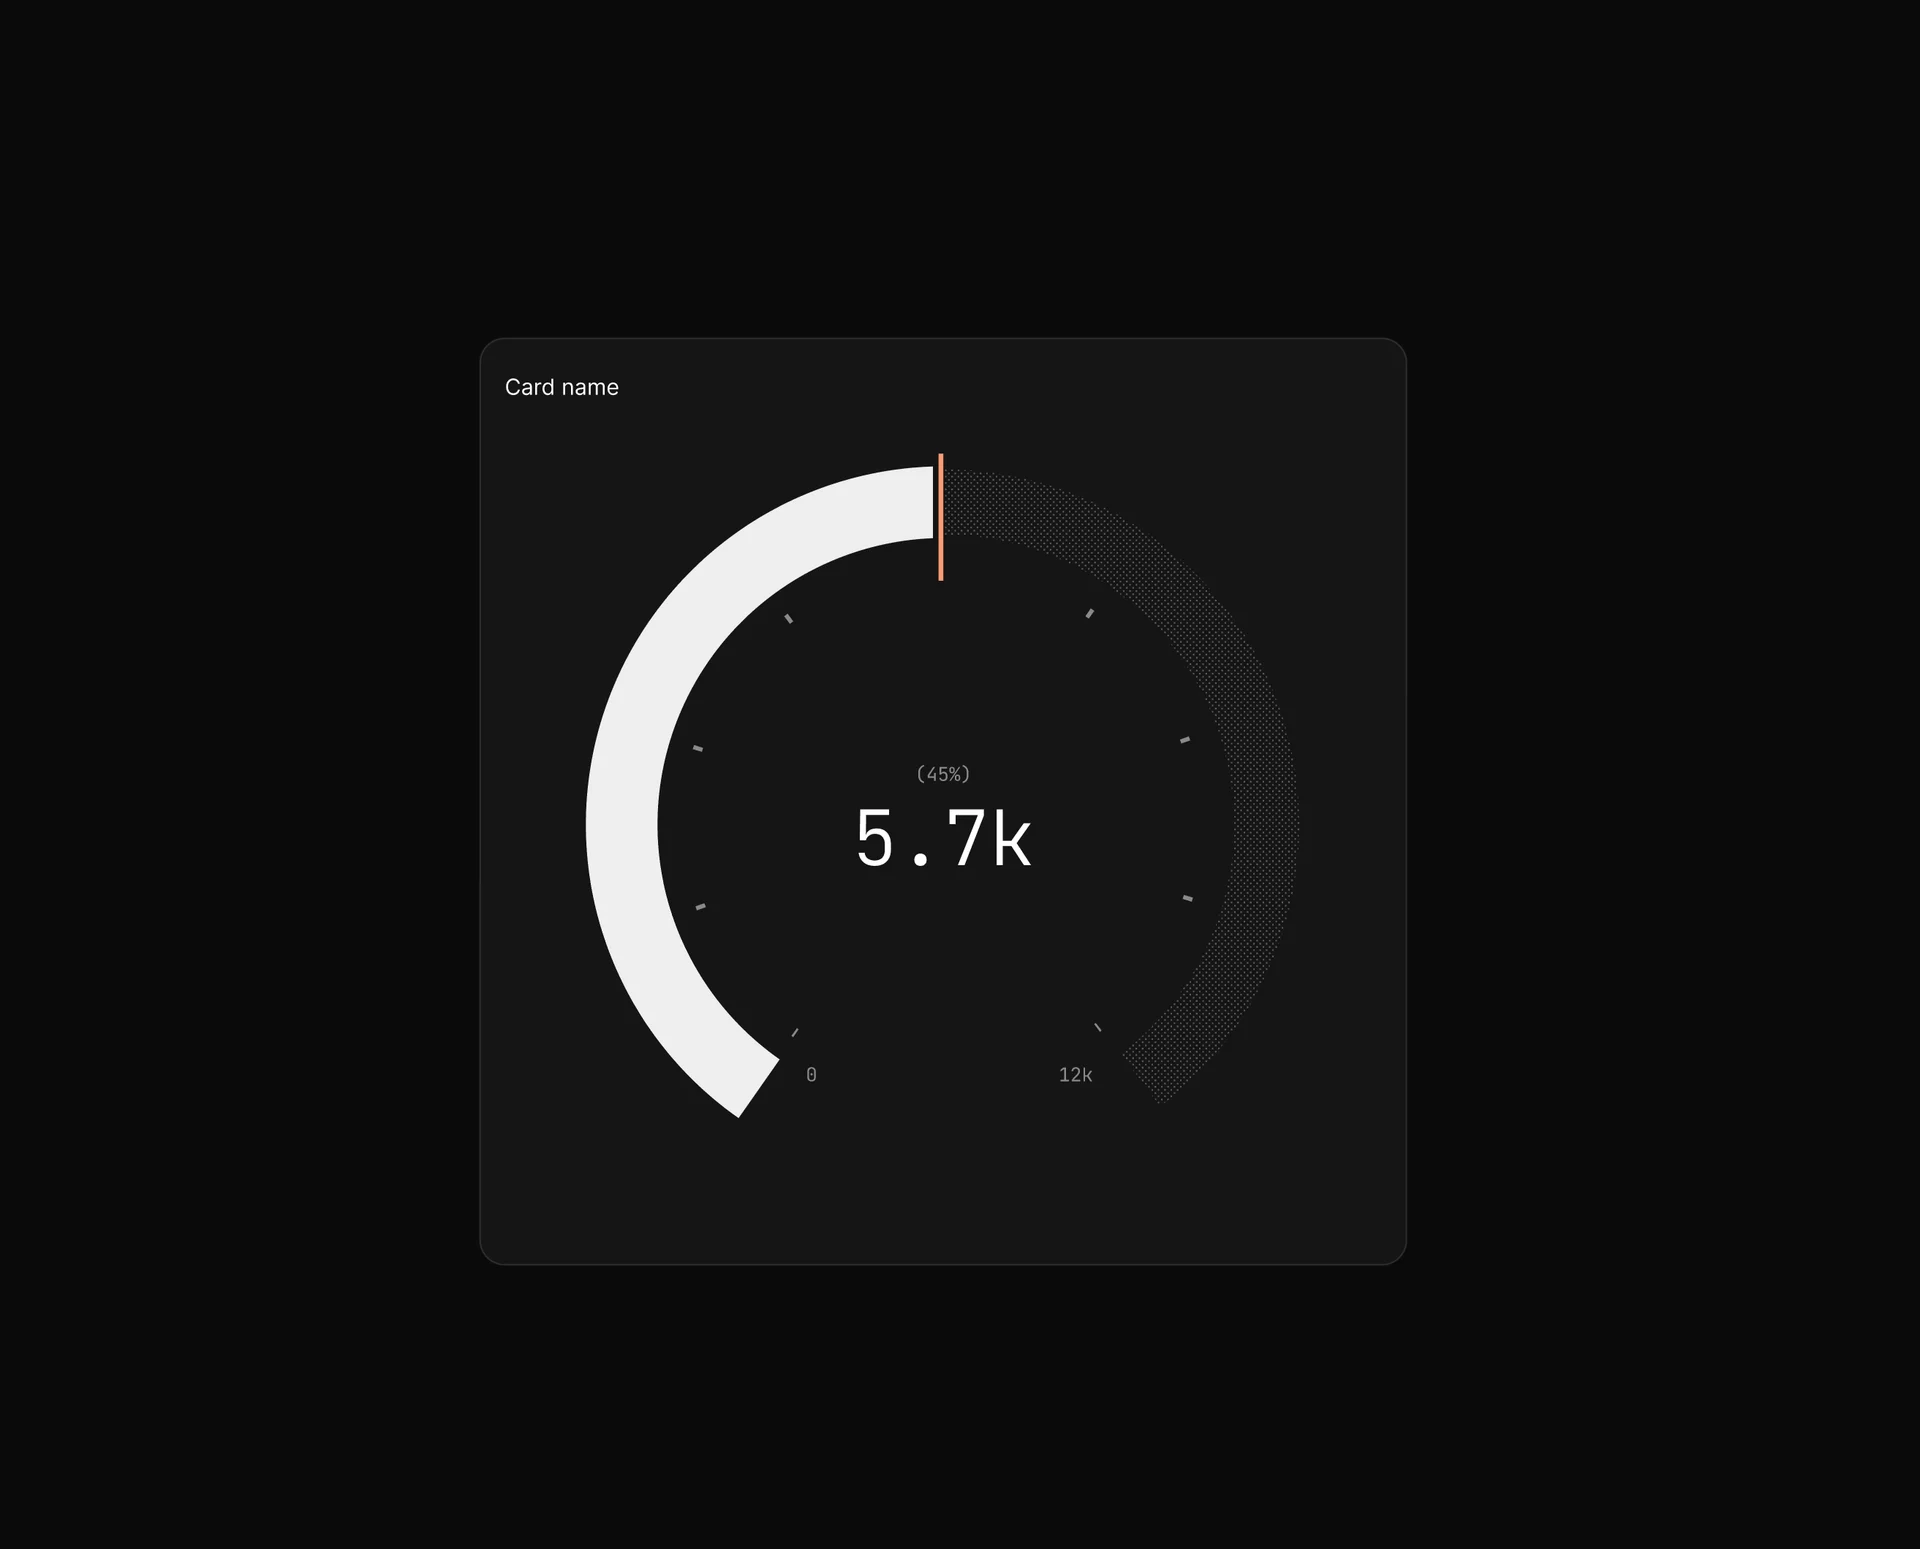
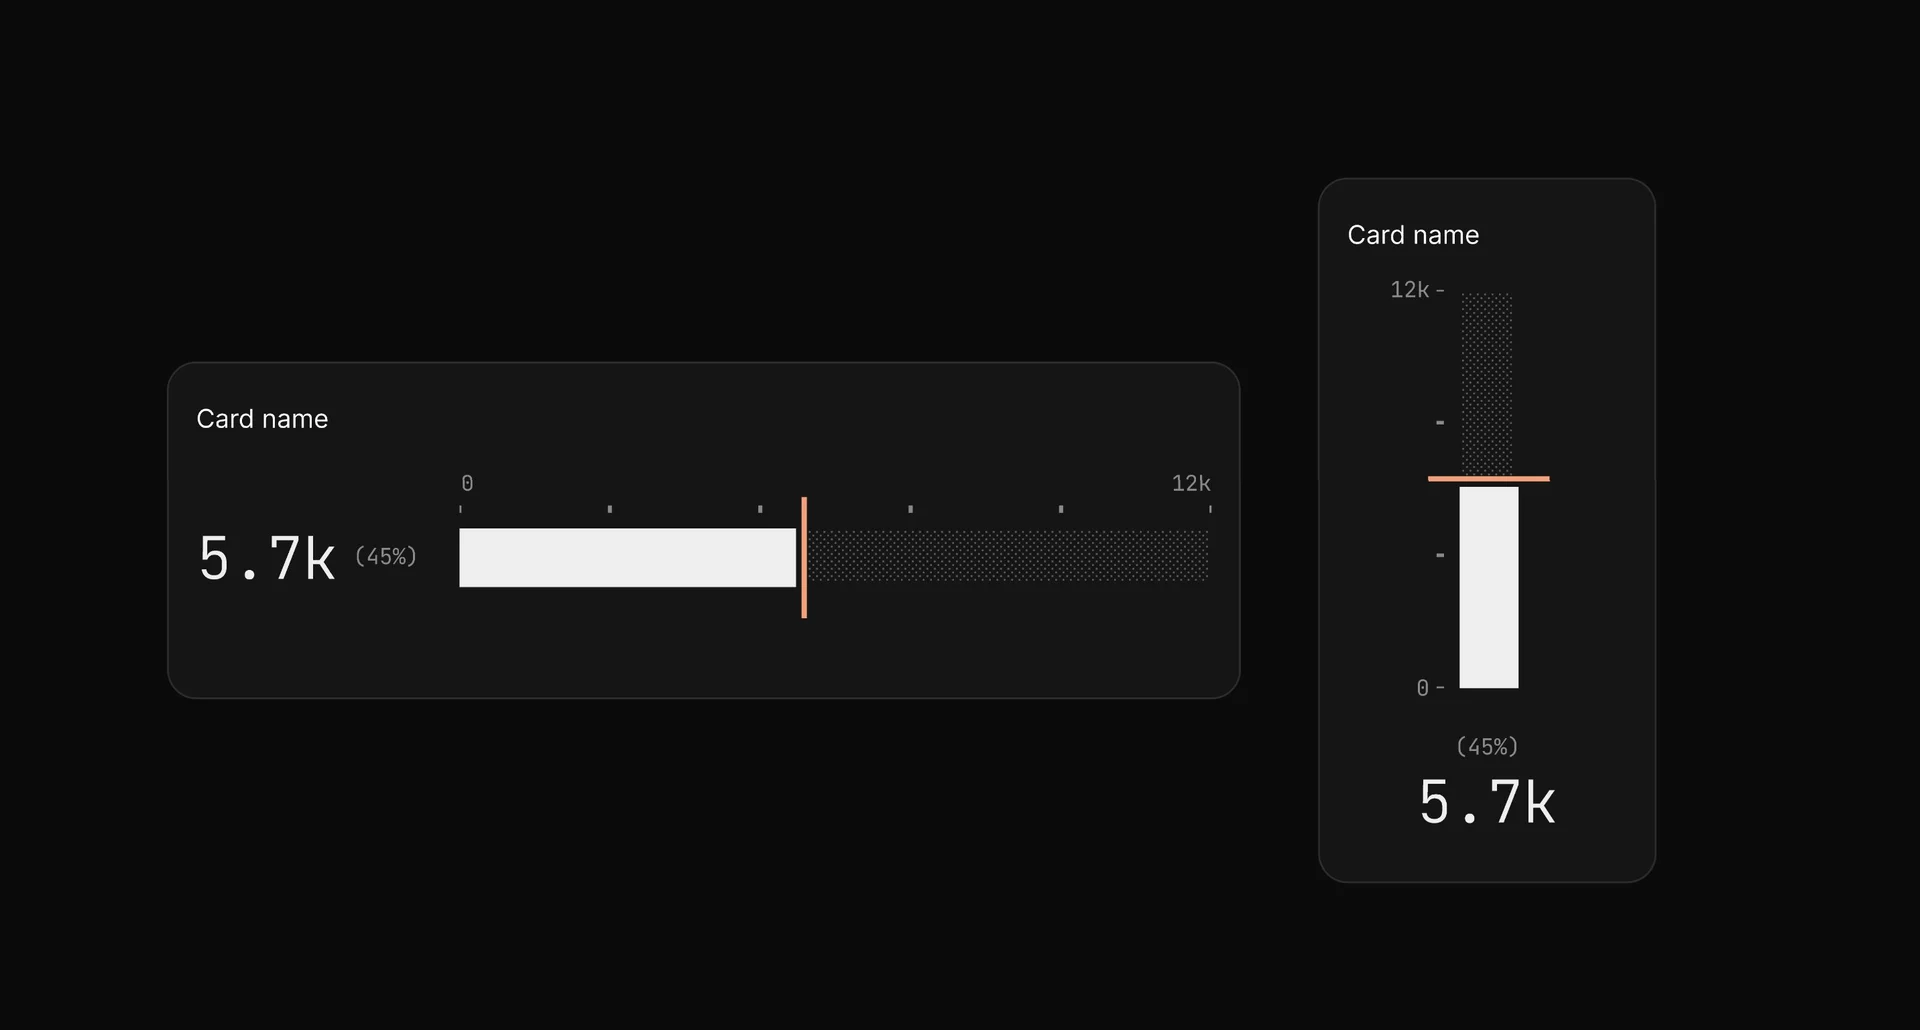
Gauge chart explorations.
Dashboard generation.
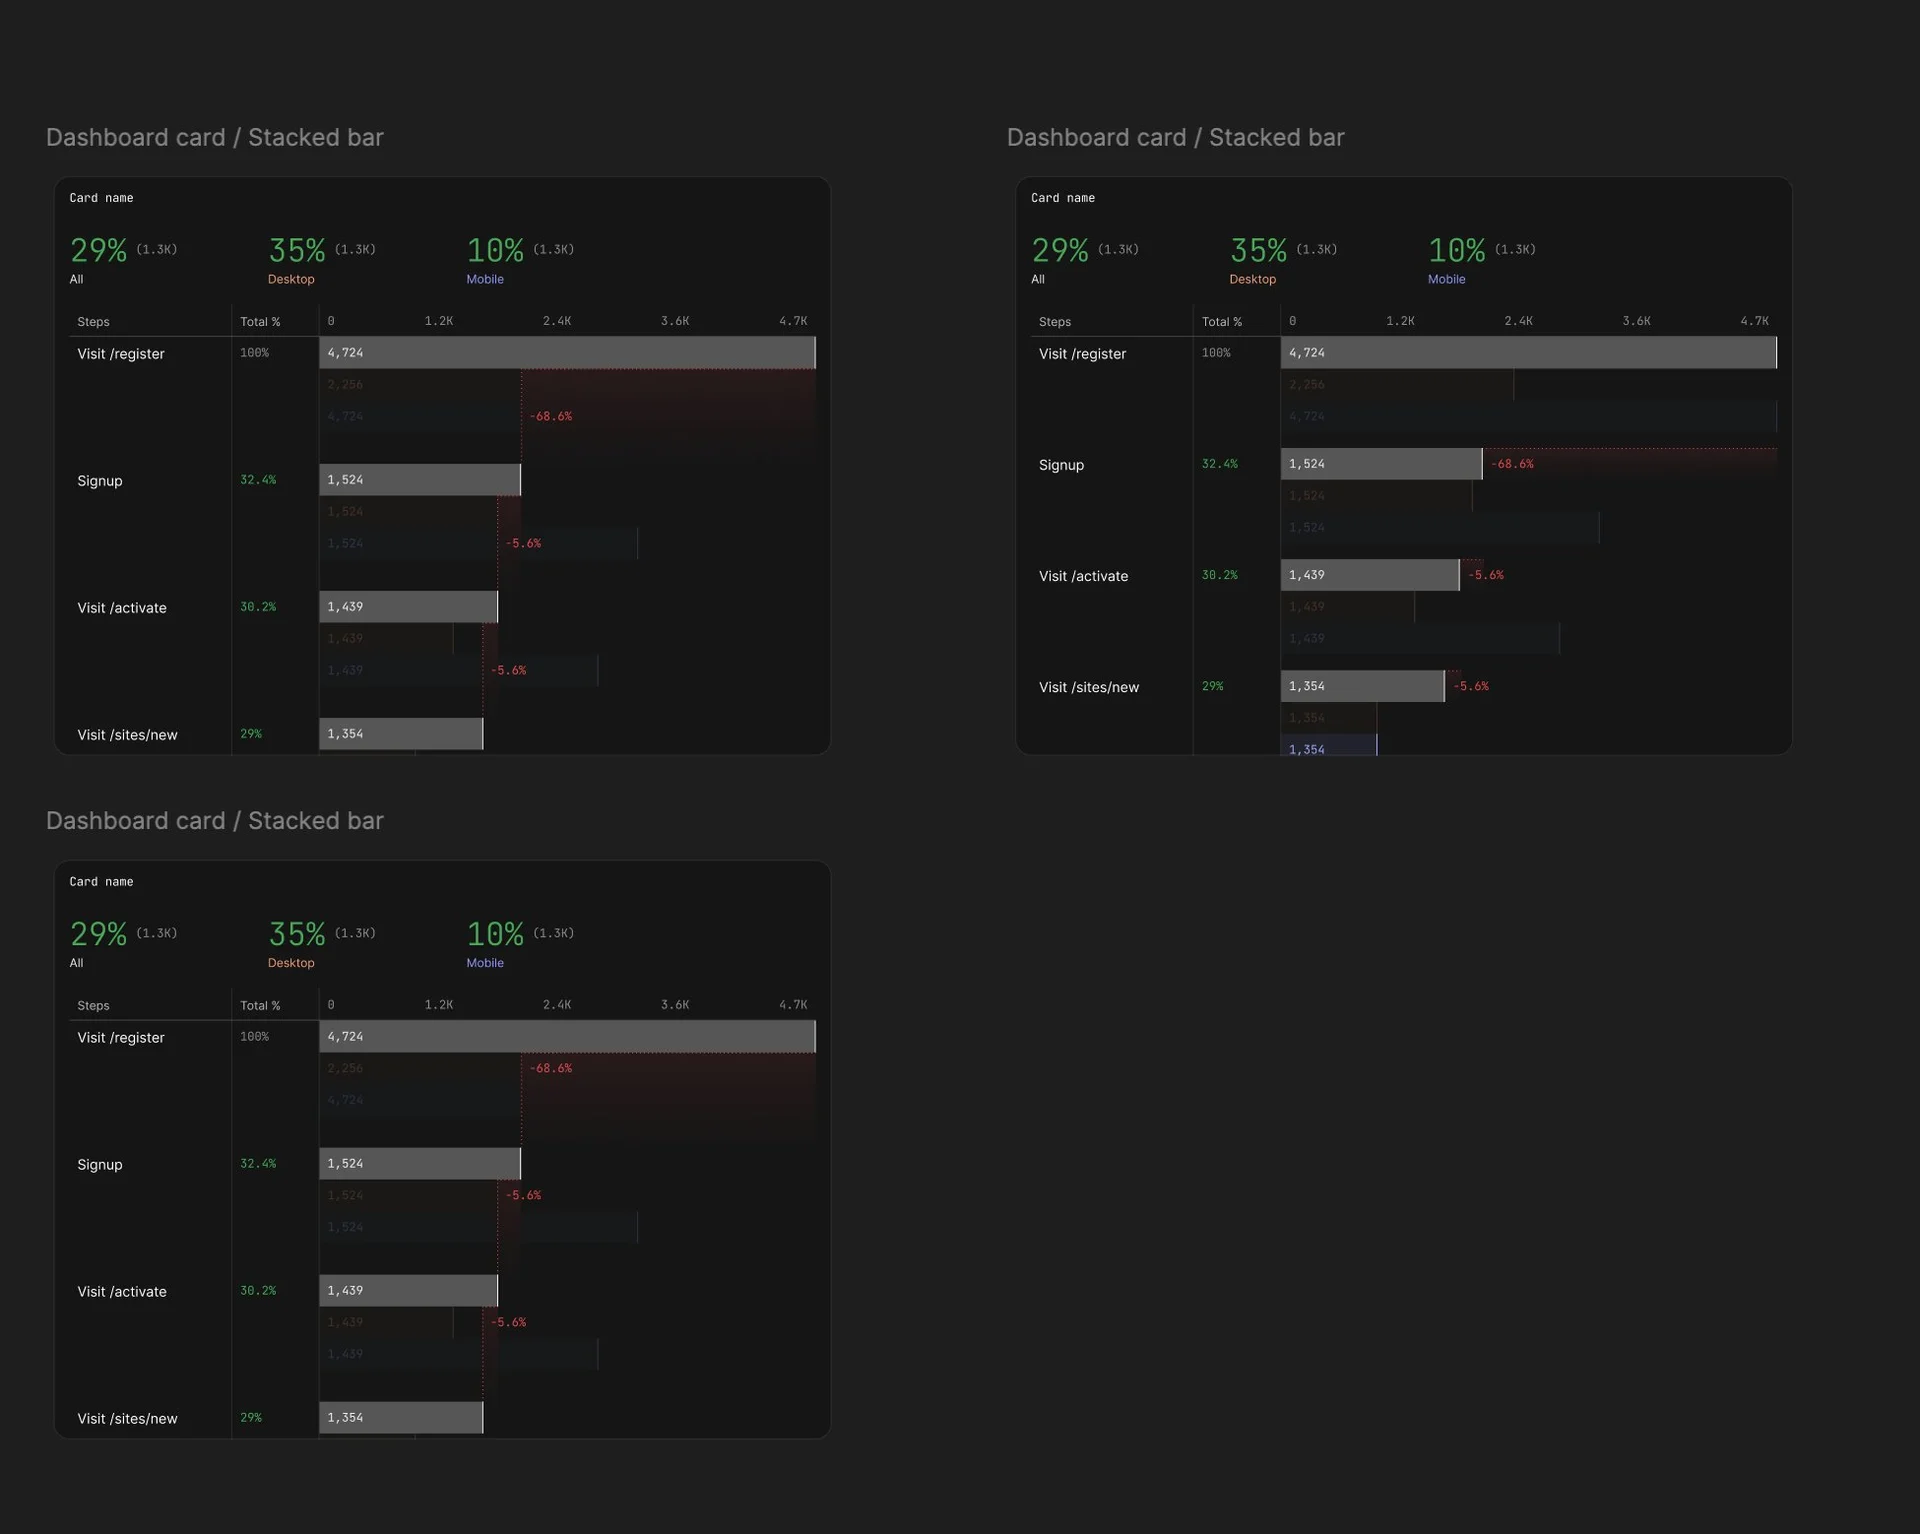
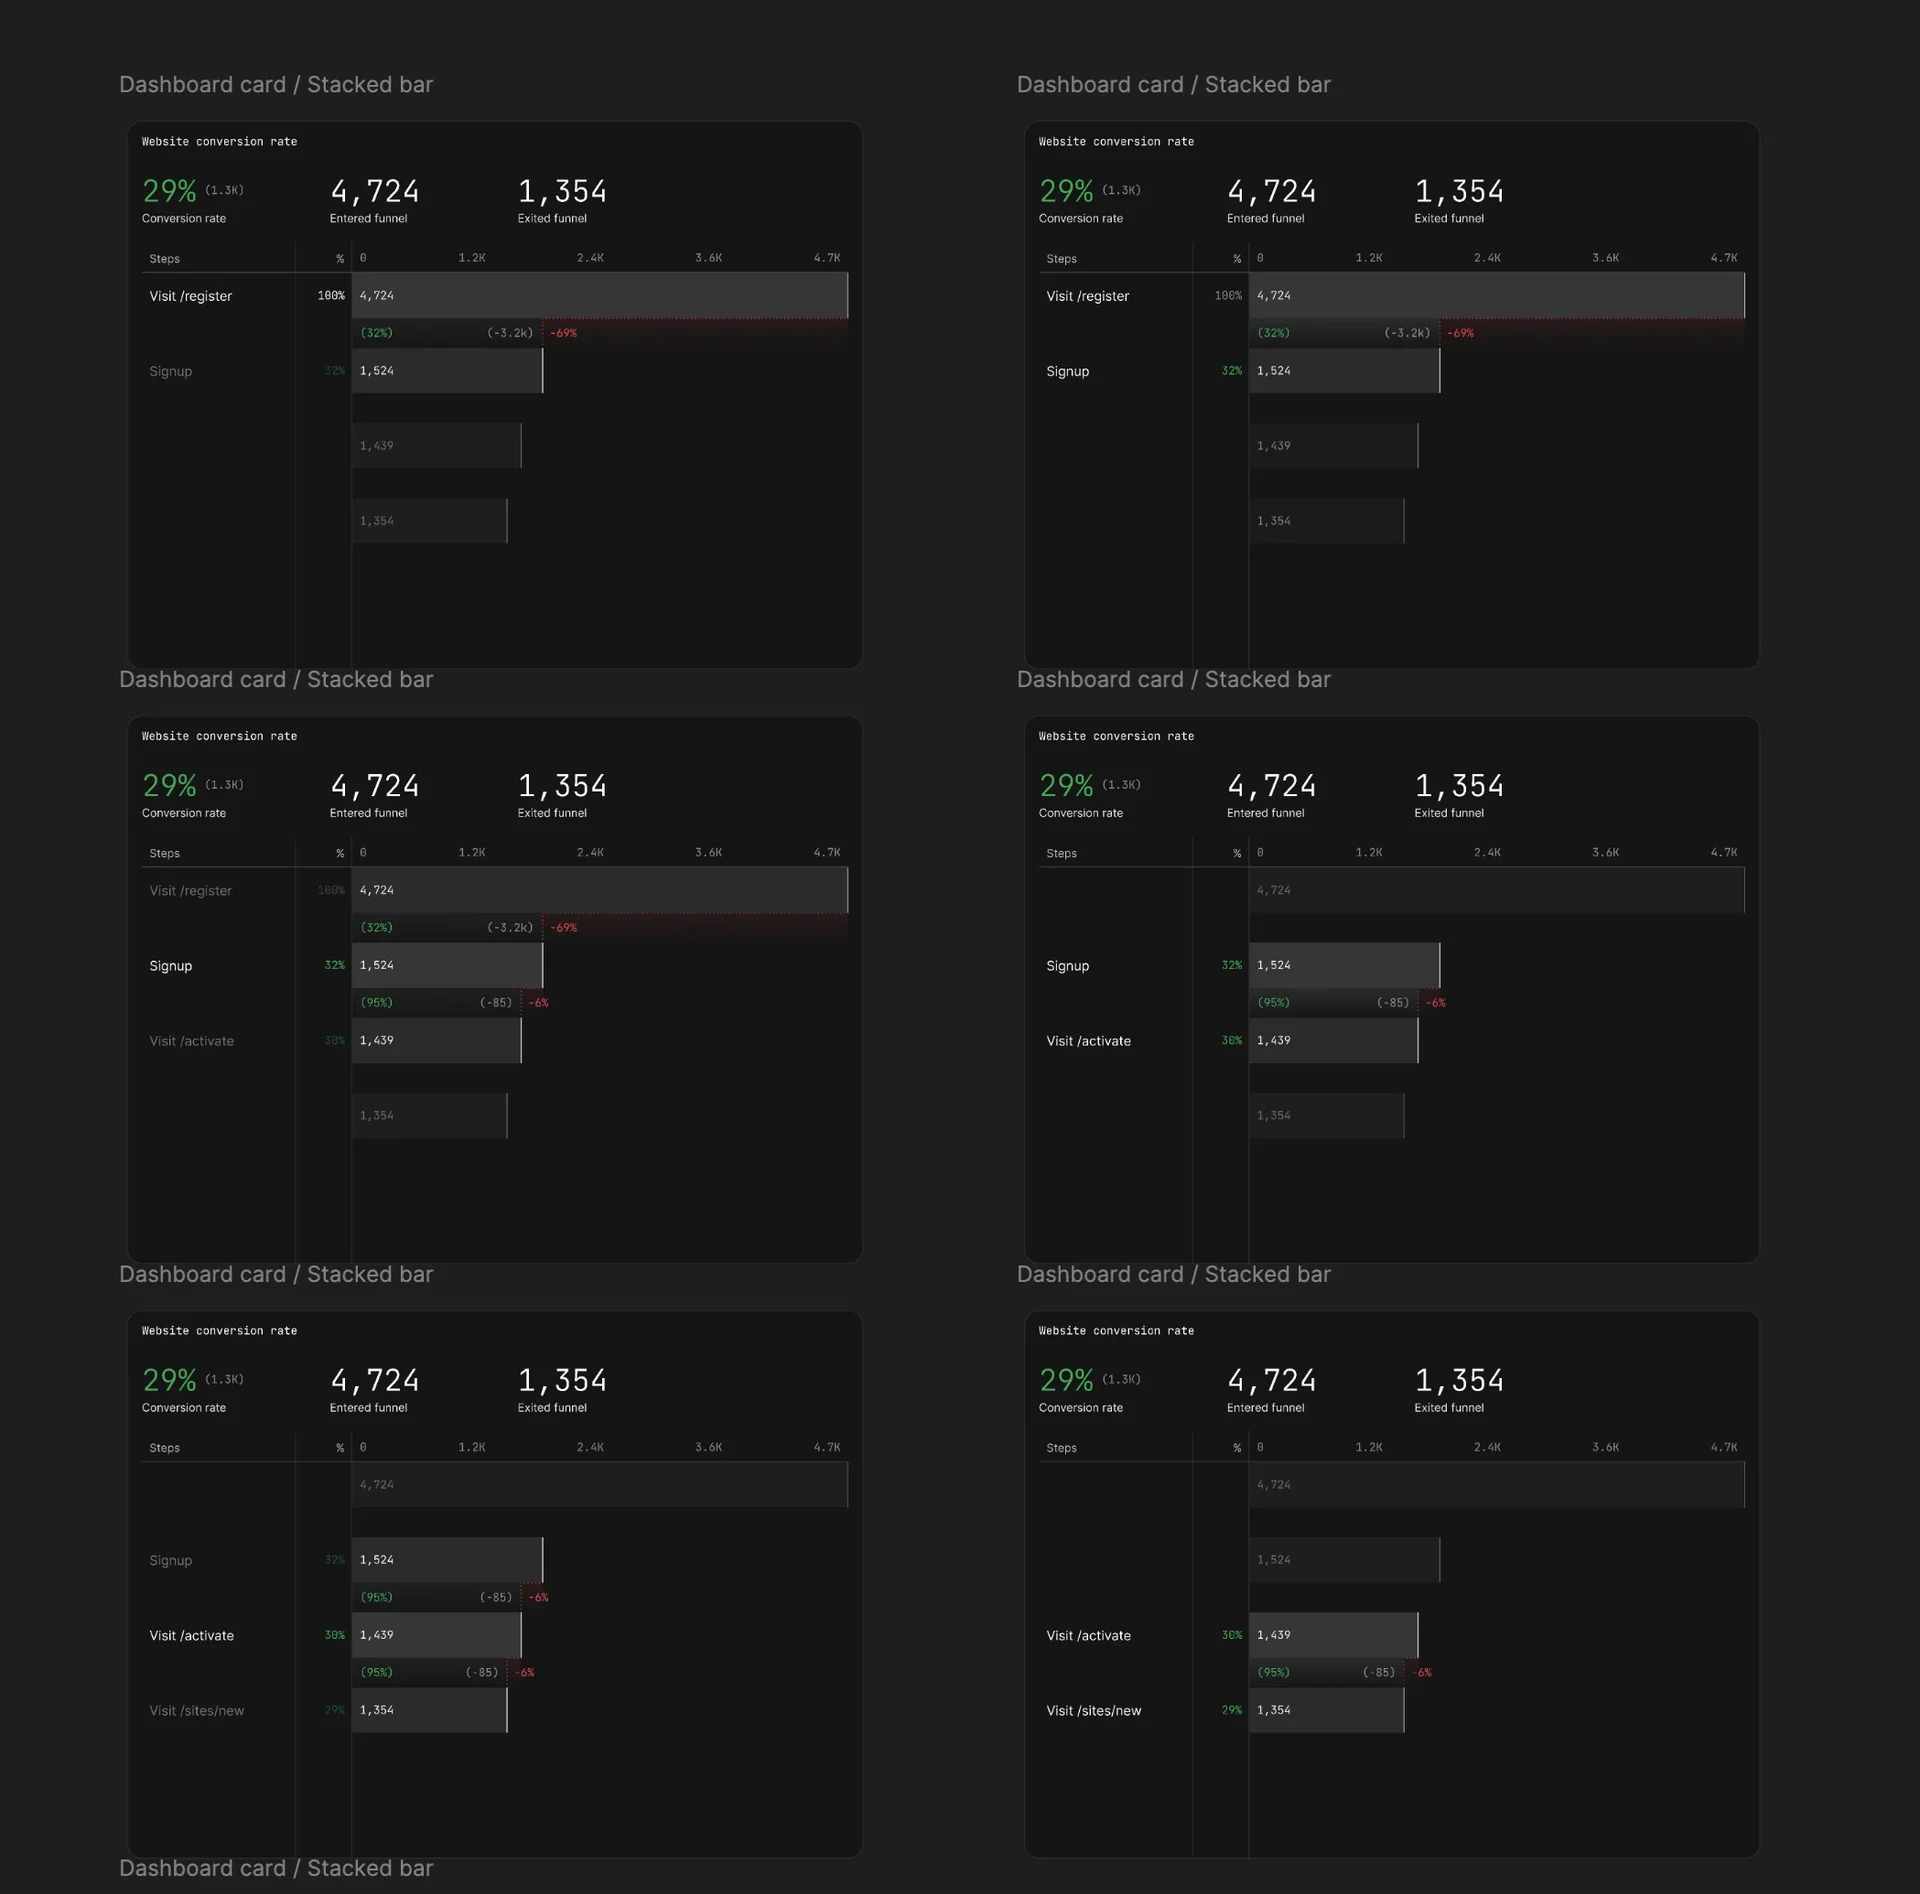
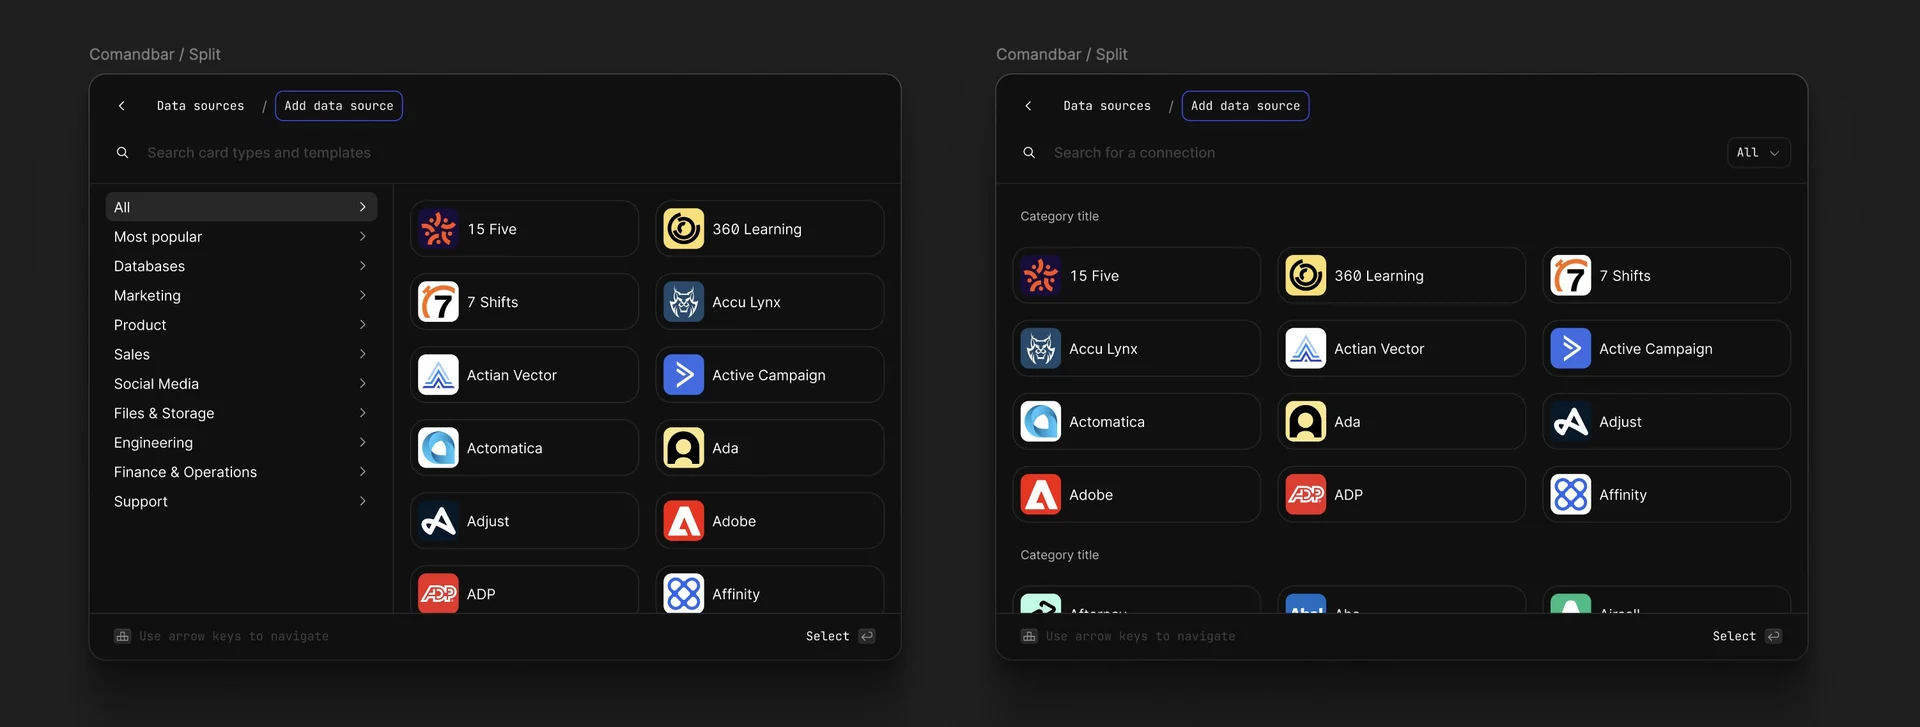
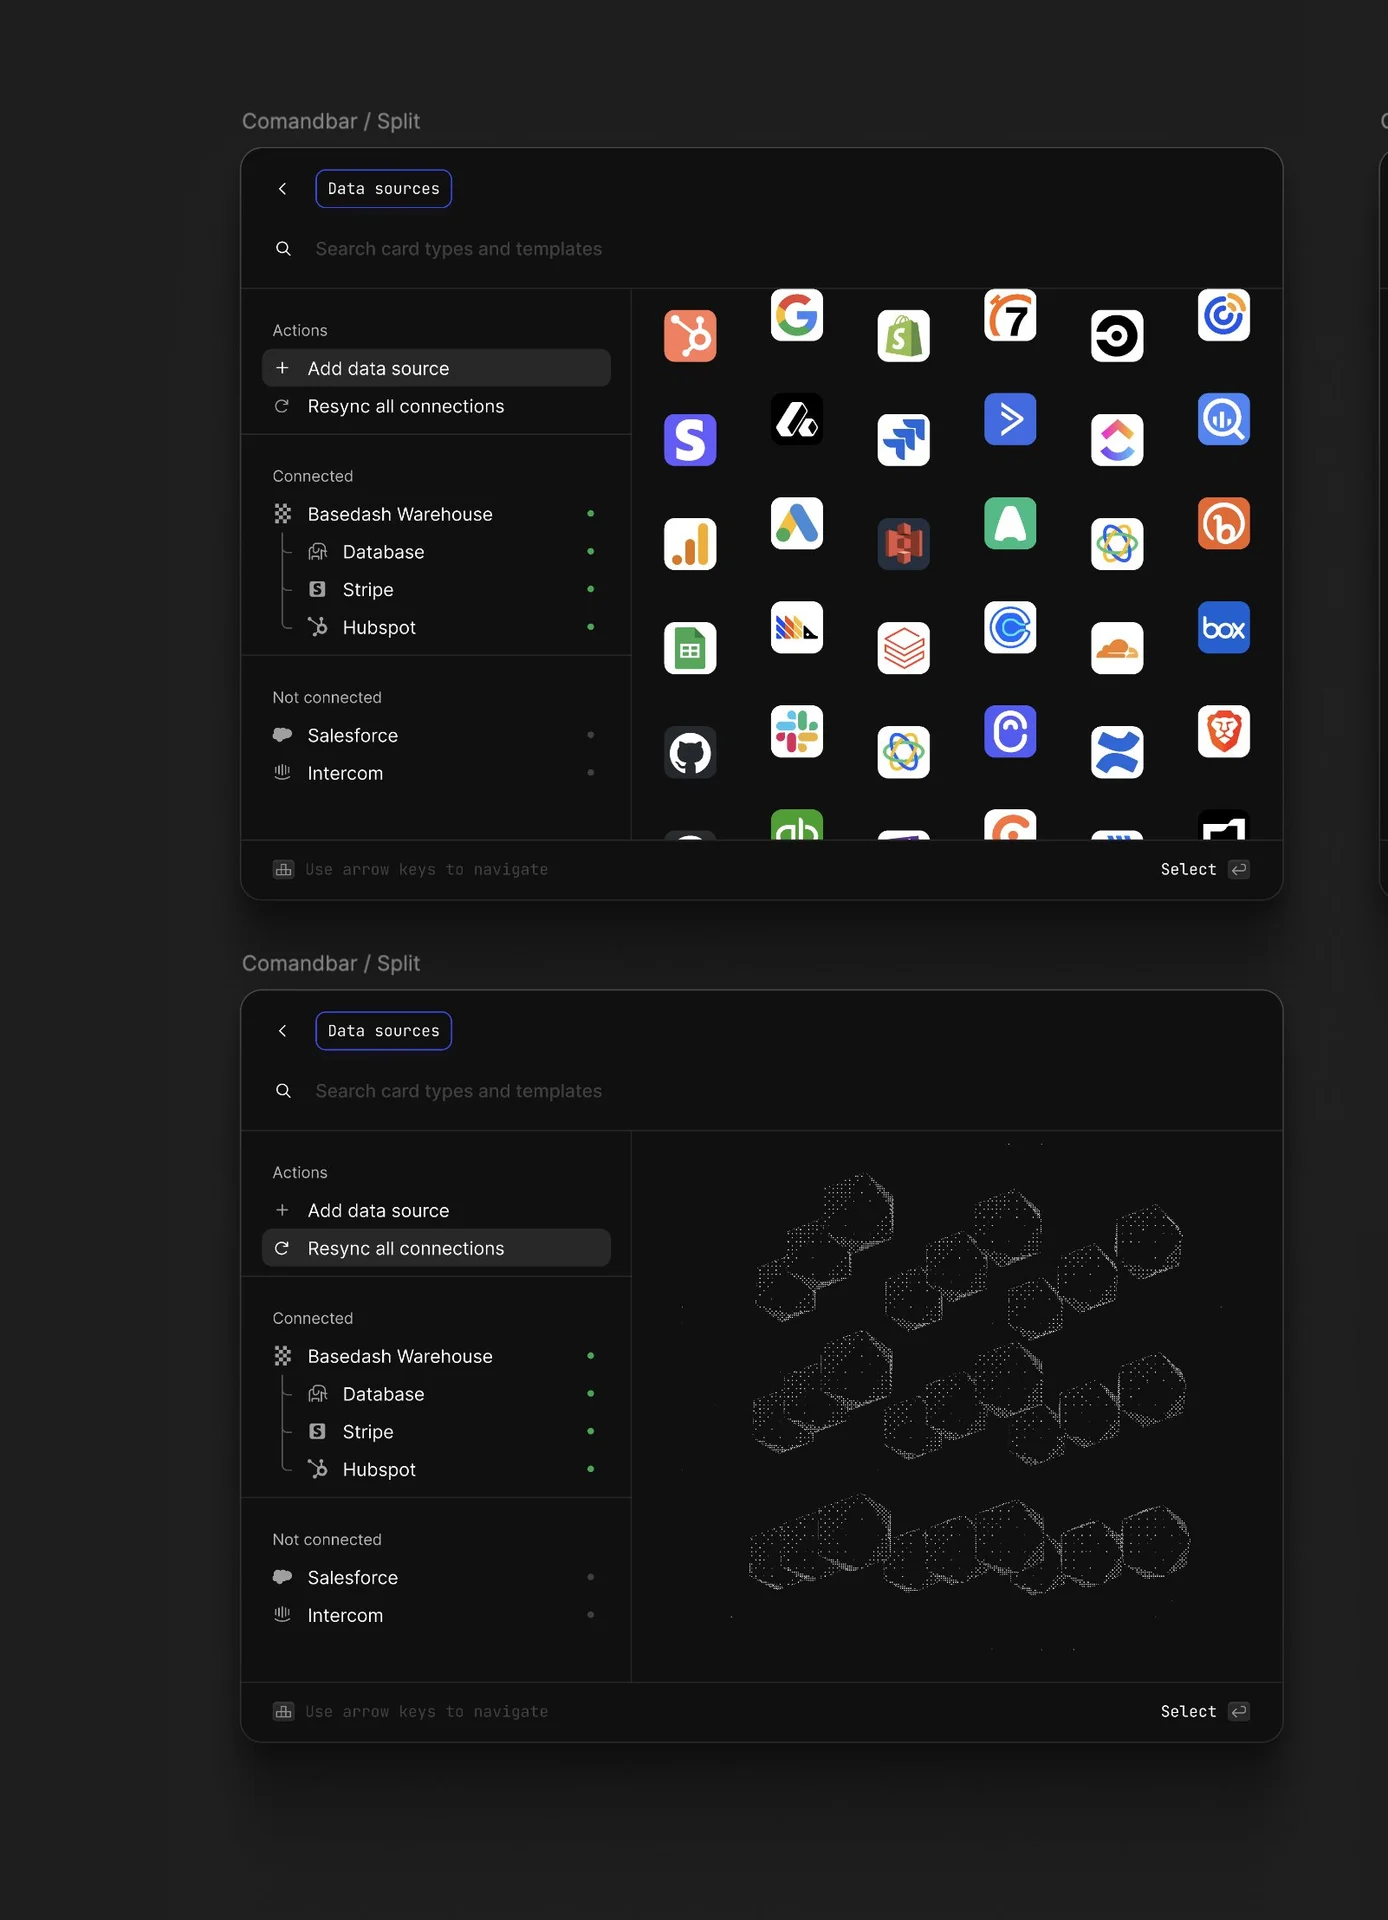
Creating charts and asking questions of the data
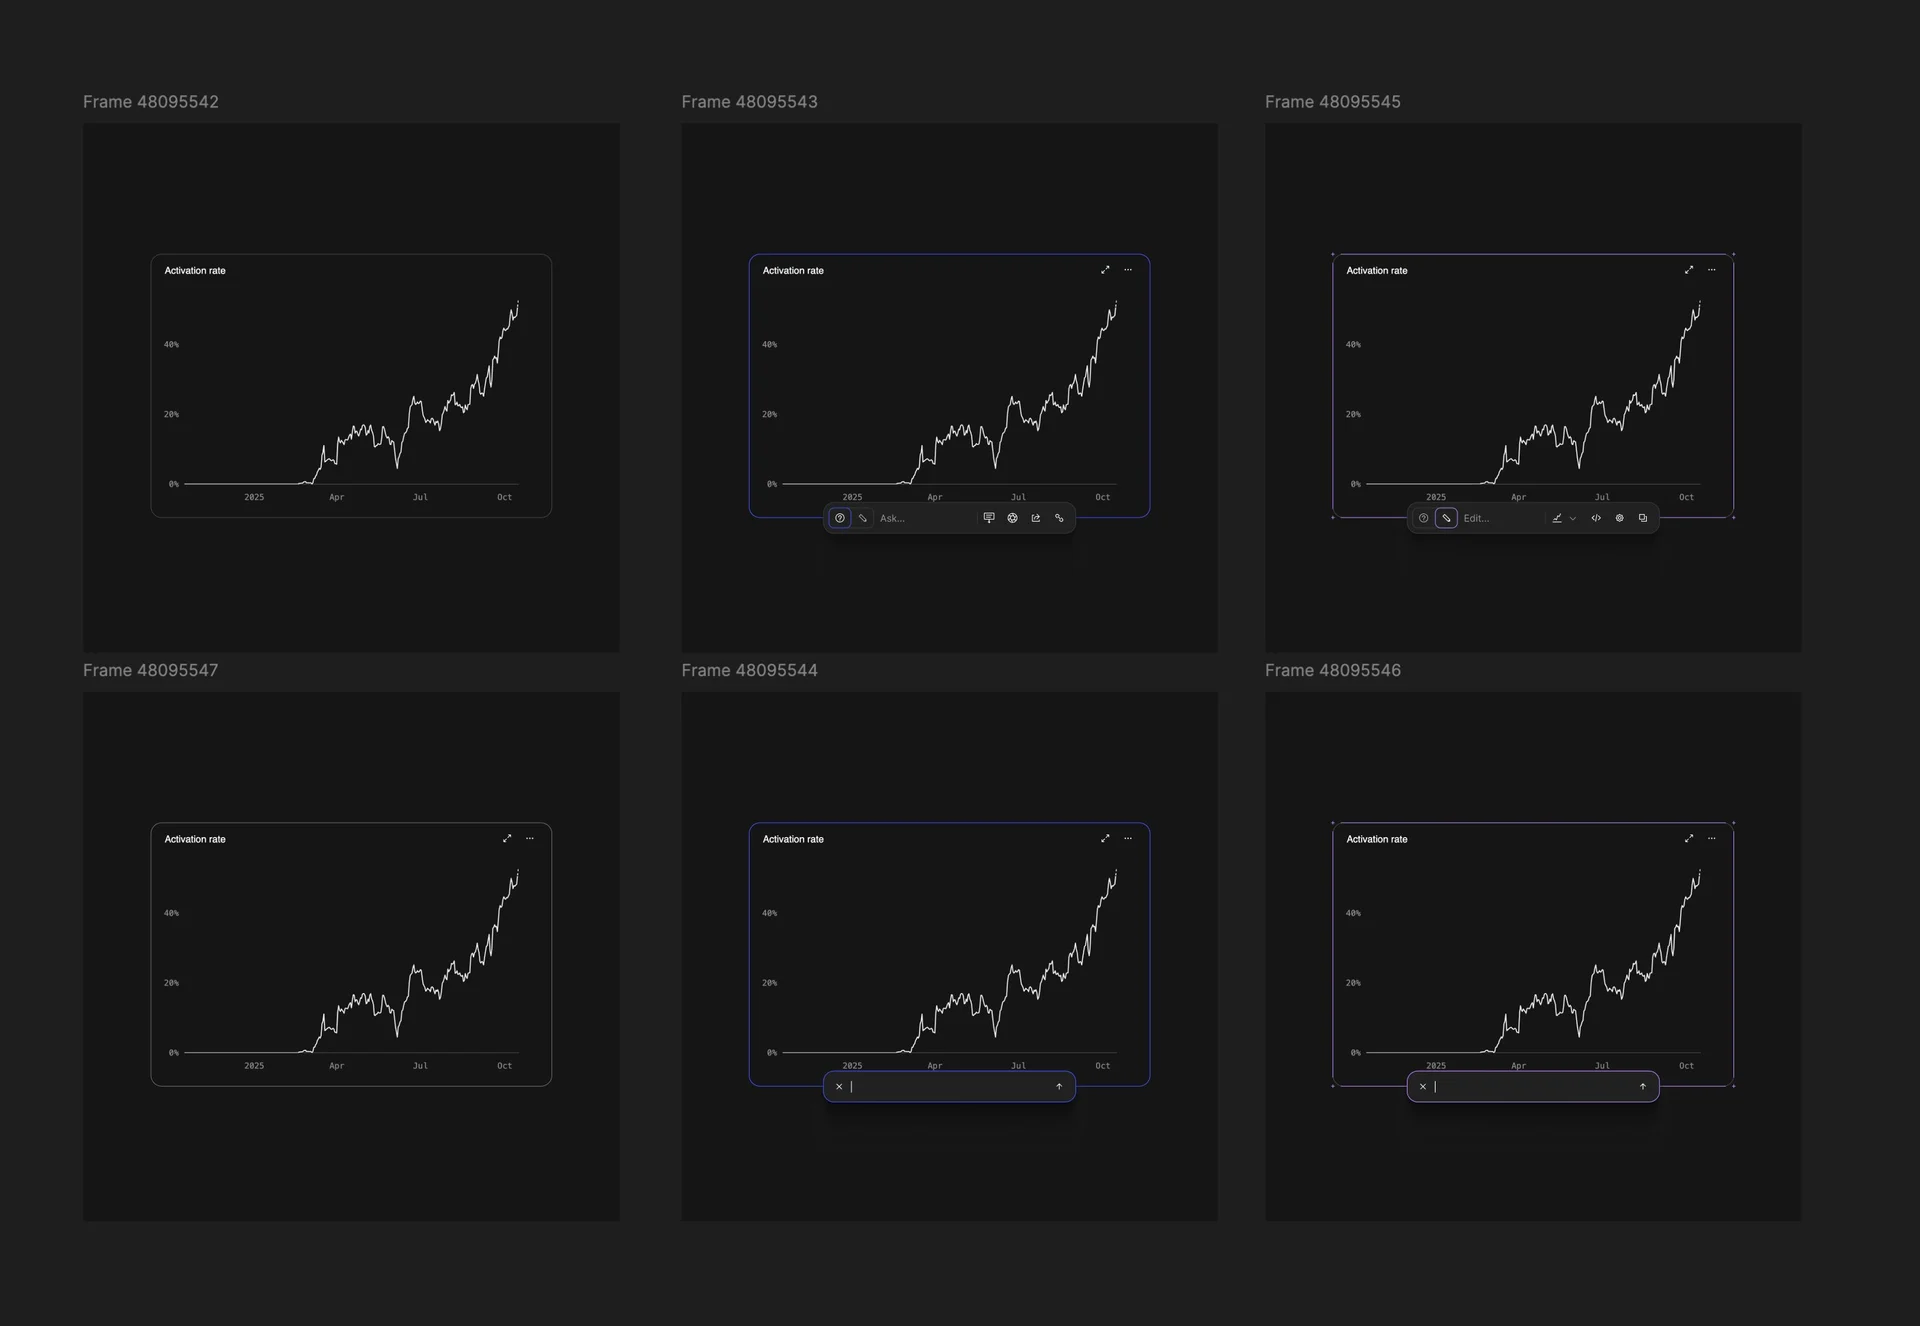
This was a recent prototype I did in @Figma make for a new way to create charts on a dashboard that would require less clicks for different sizes and also different block types.
Basically combine the creation with the definition of size and location. Loosen the construct of the grid layout. Allow better controls for non-visual block types like spacers and headings.
There's something here to be sure.
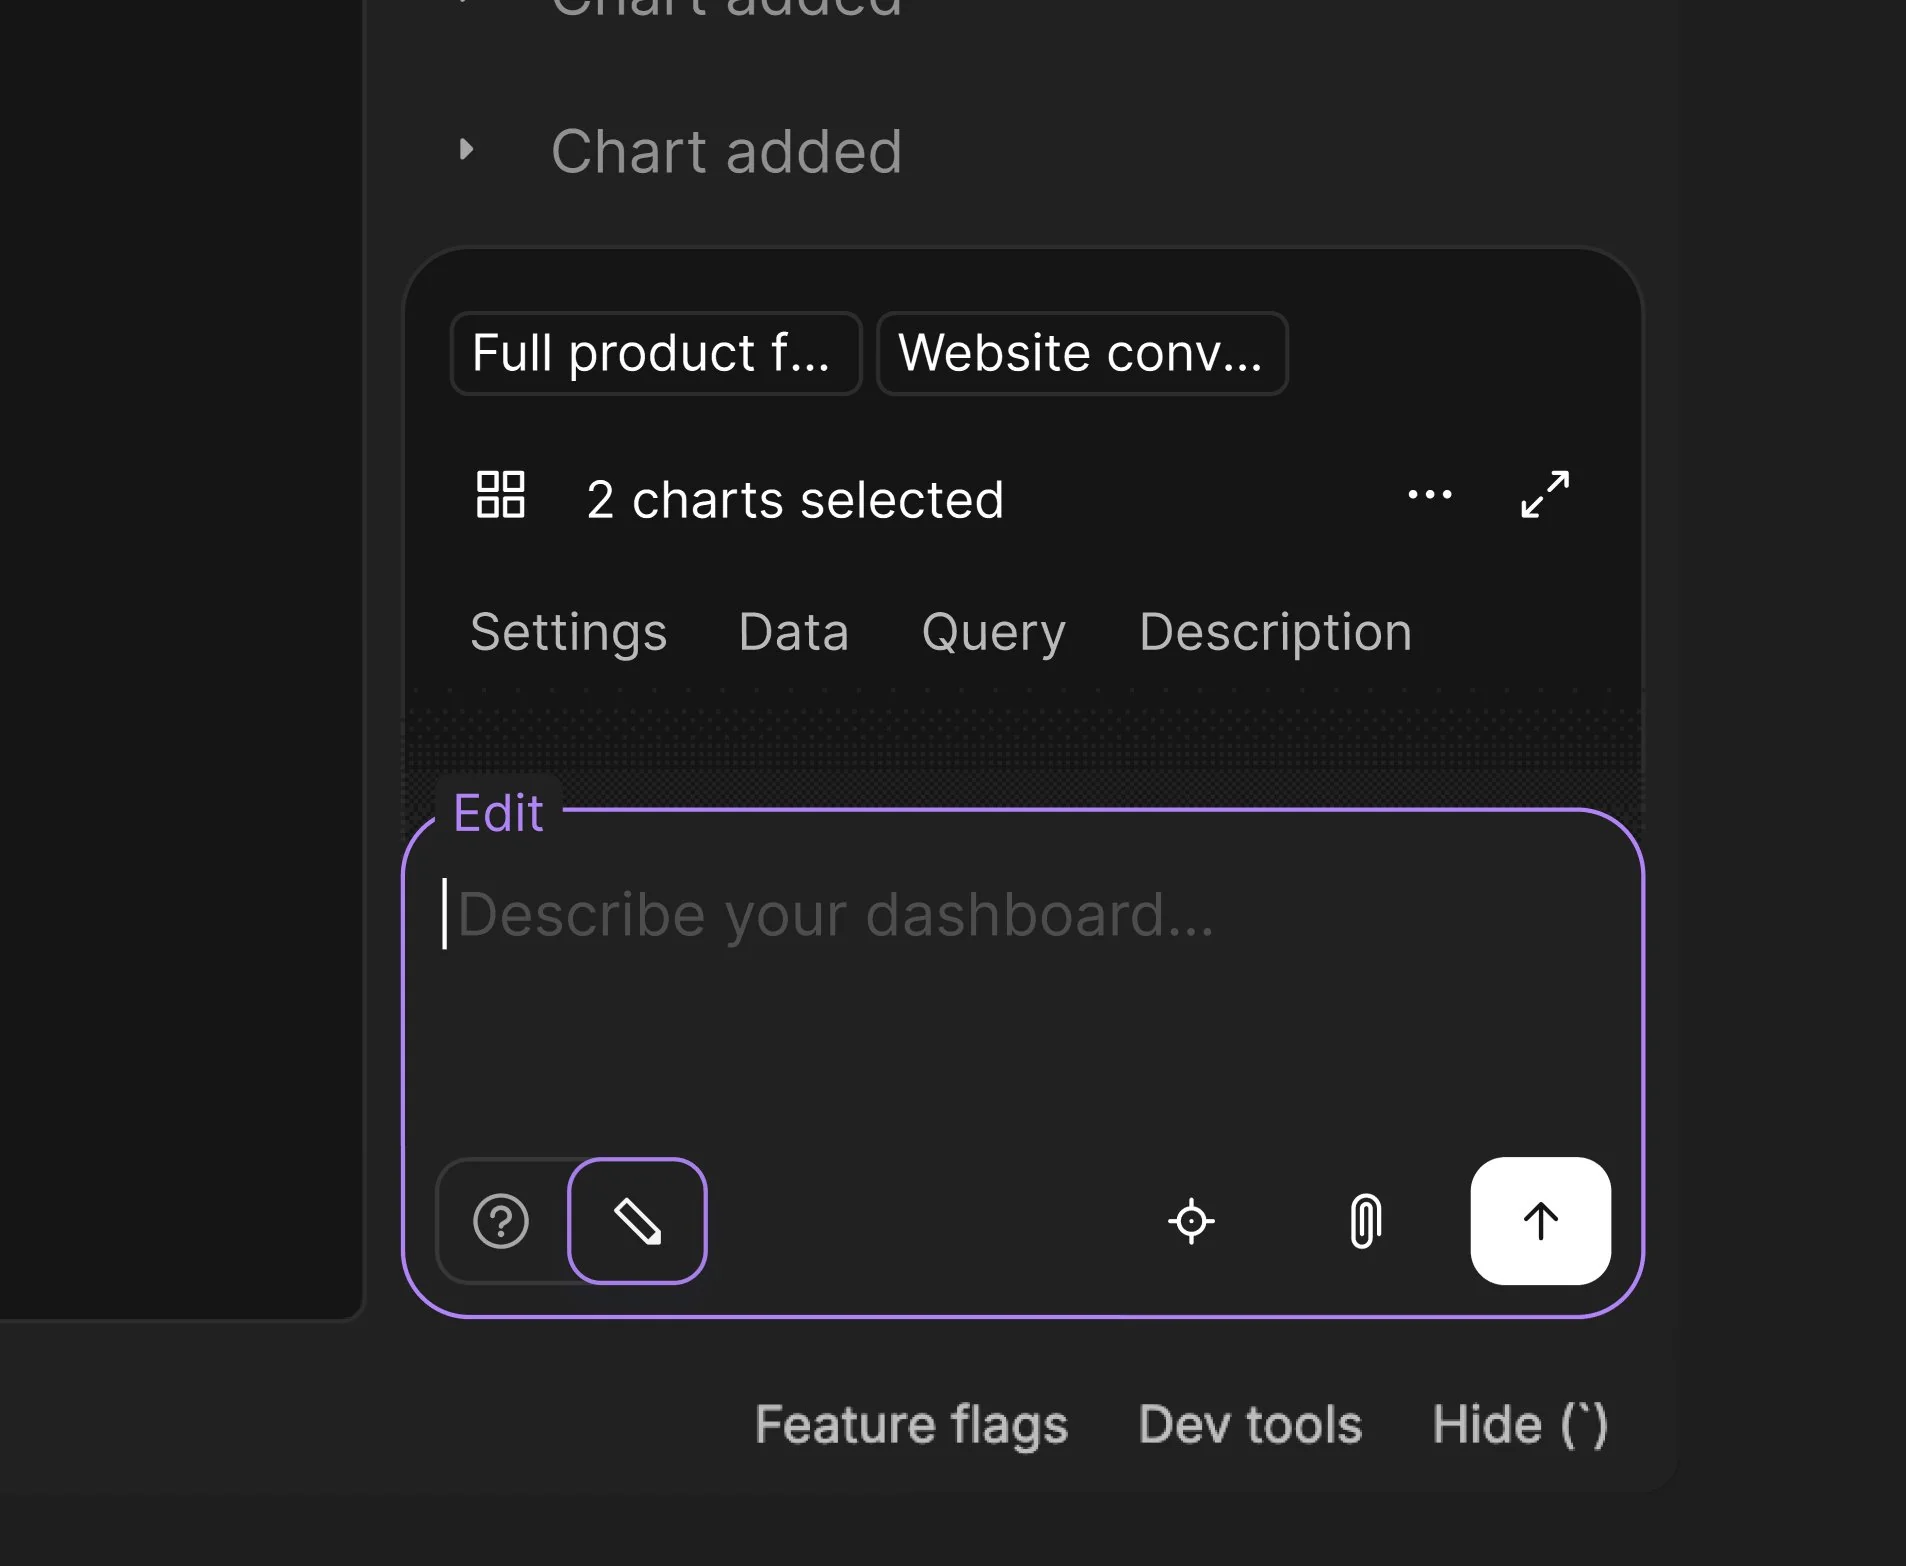
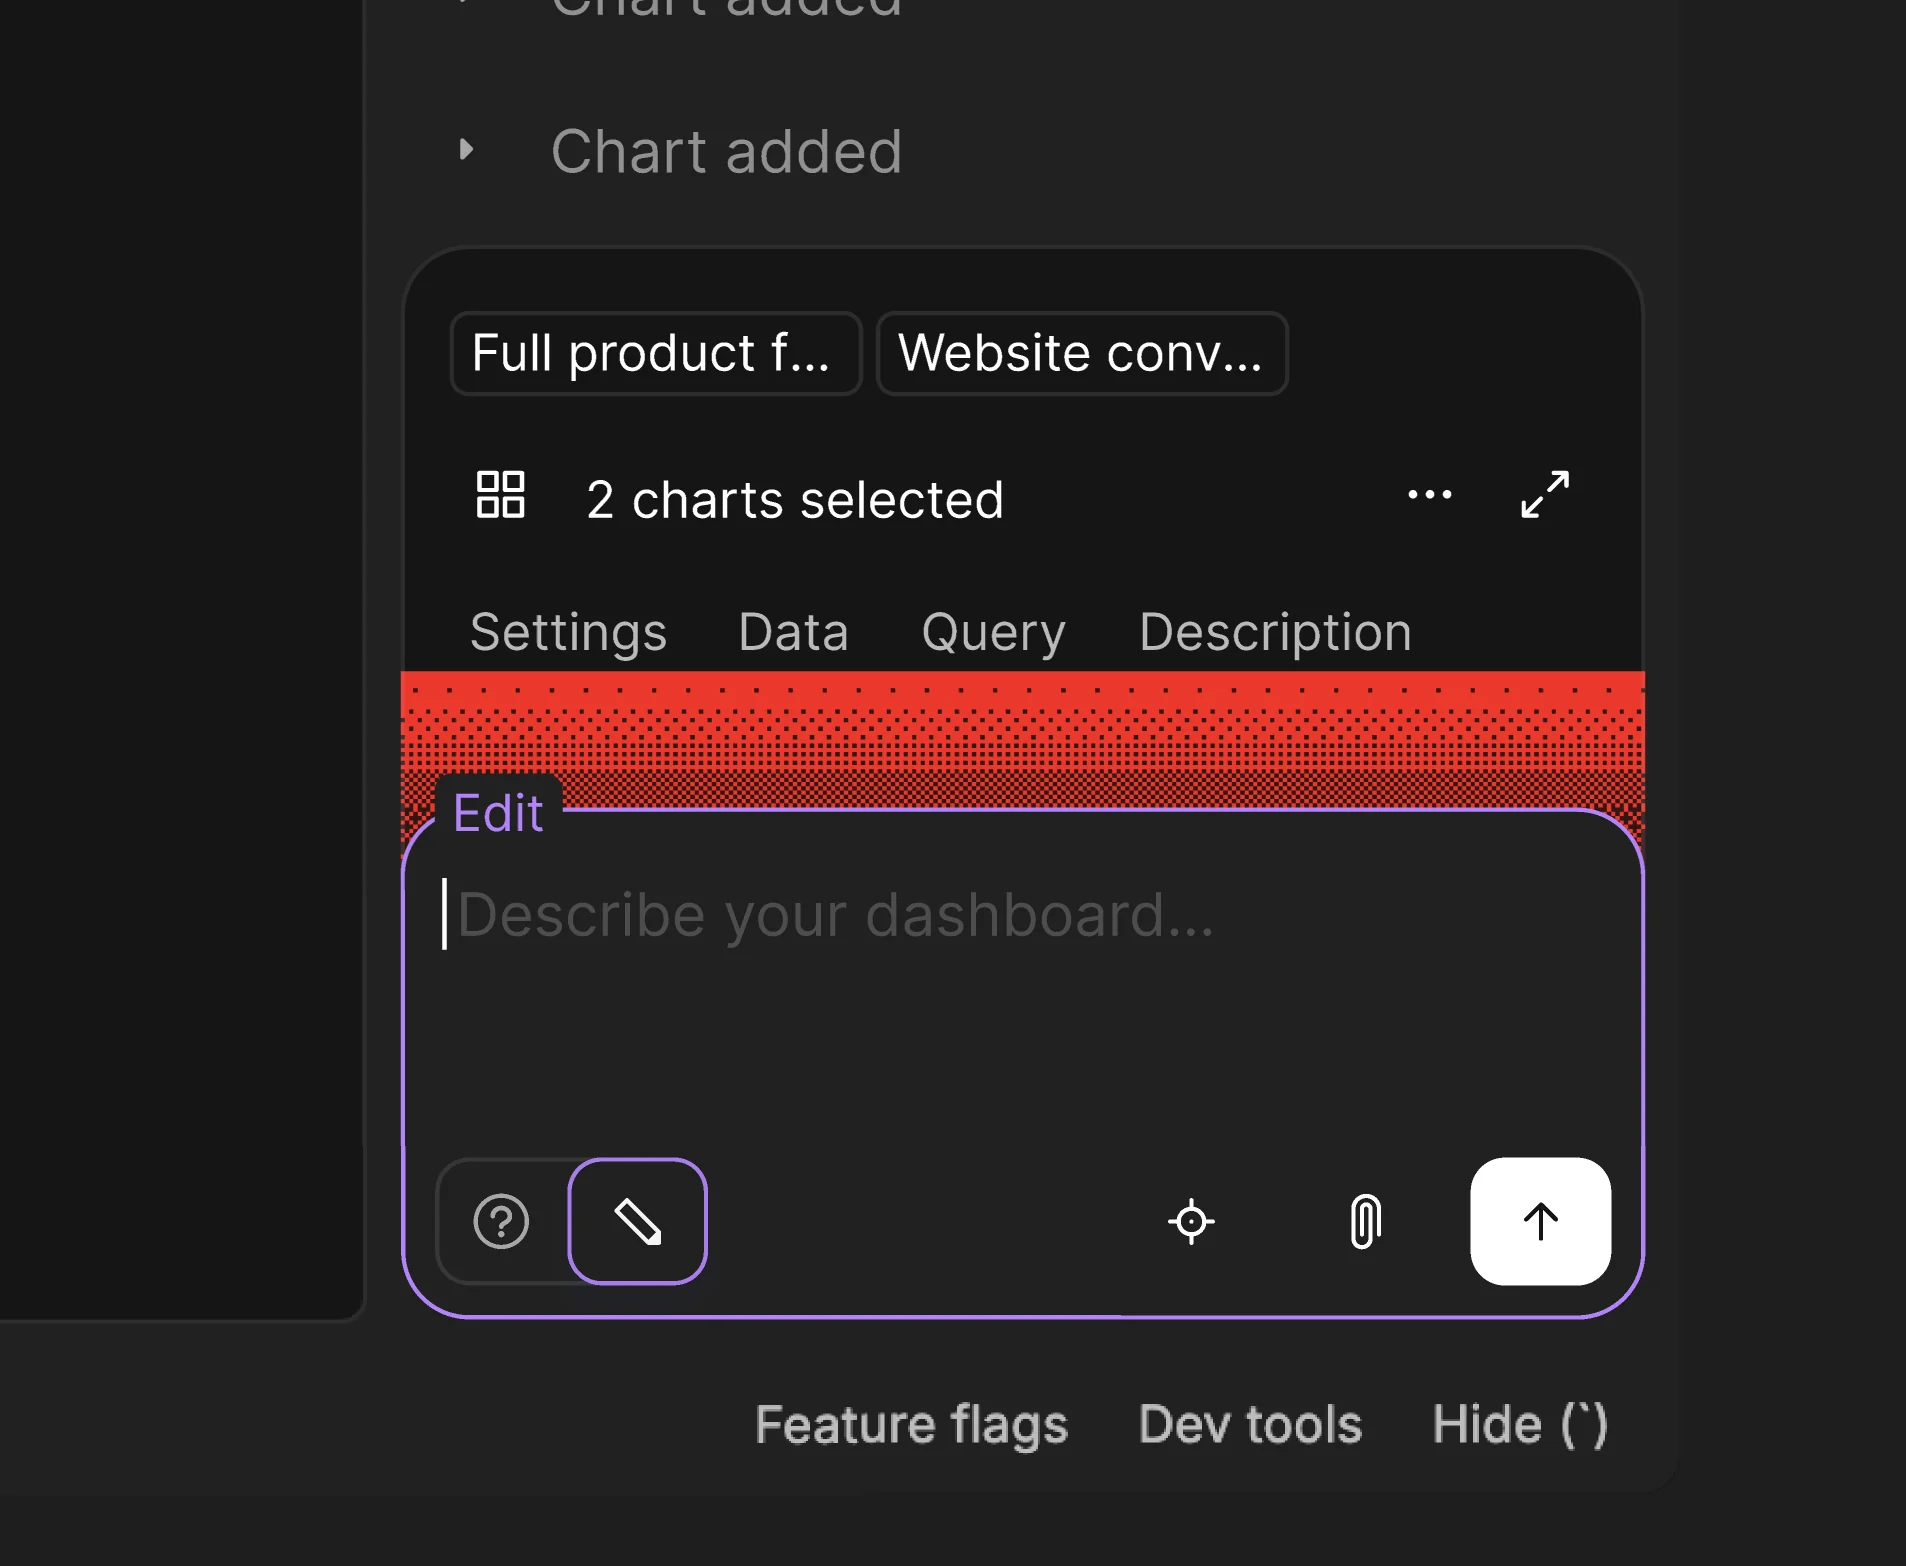
Edit and ask states for AI selection, to allow the AI to not just be involved in the creation process, but also in digging into data and doing complex analysis. Why did this tick up? Who signed up? When? What's the spike in traffic? Etc.
Ditherface and a different kind of research incentive
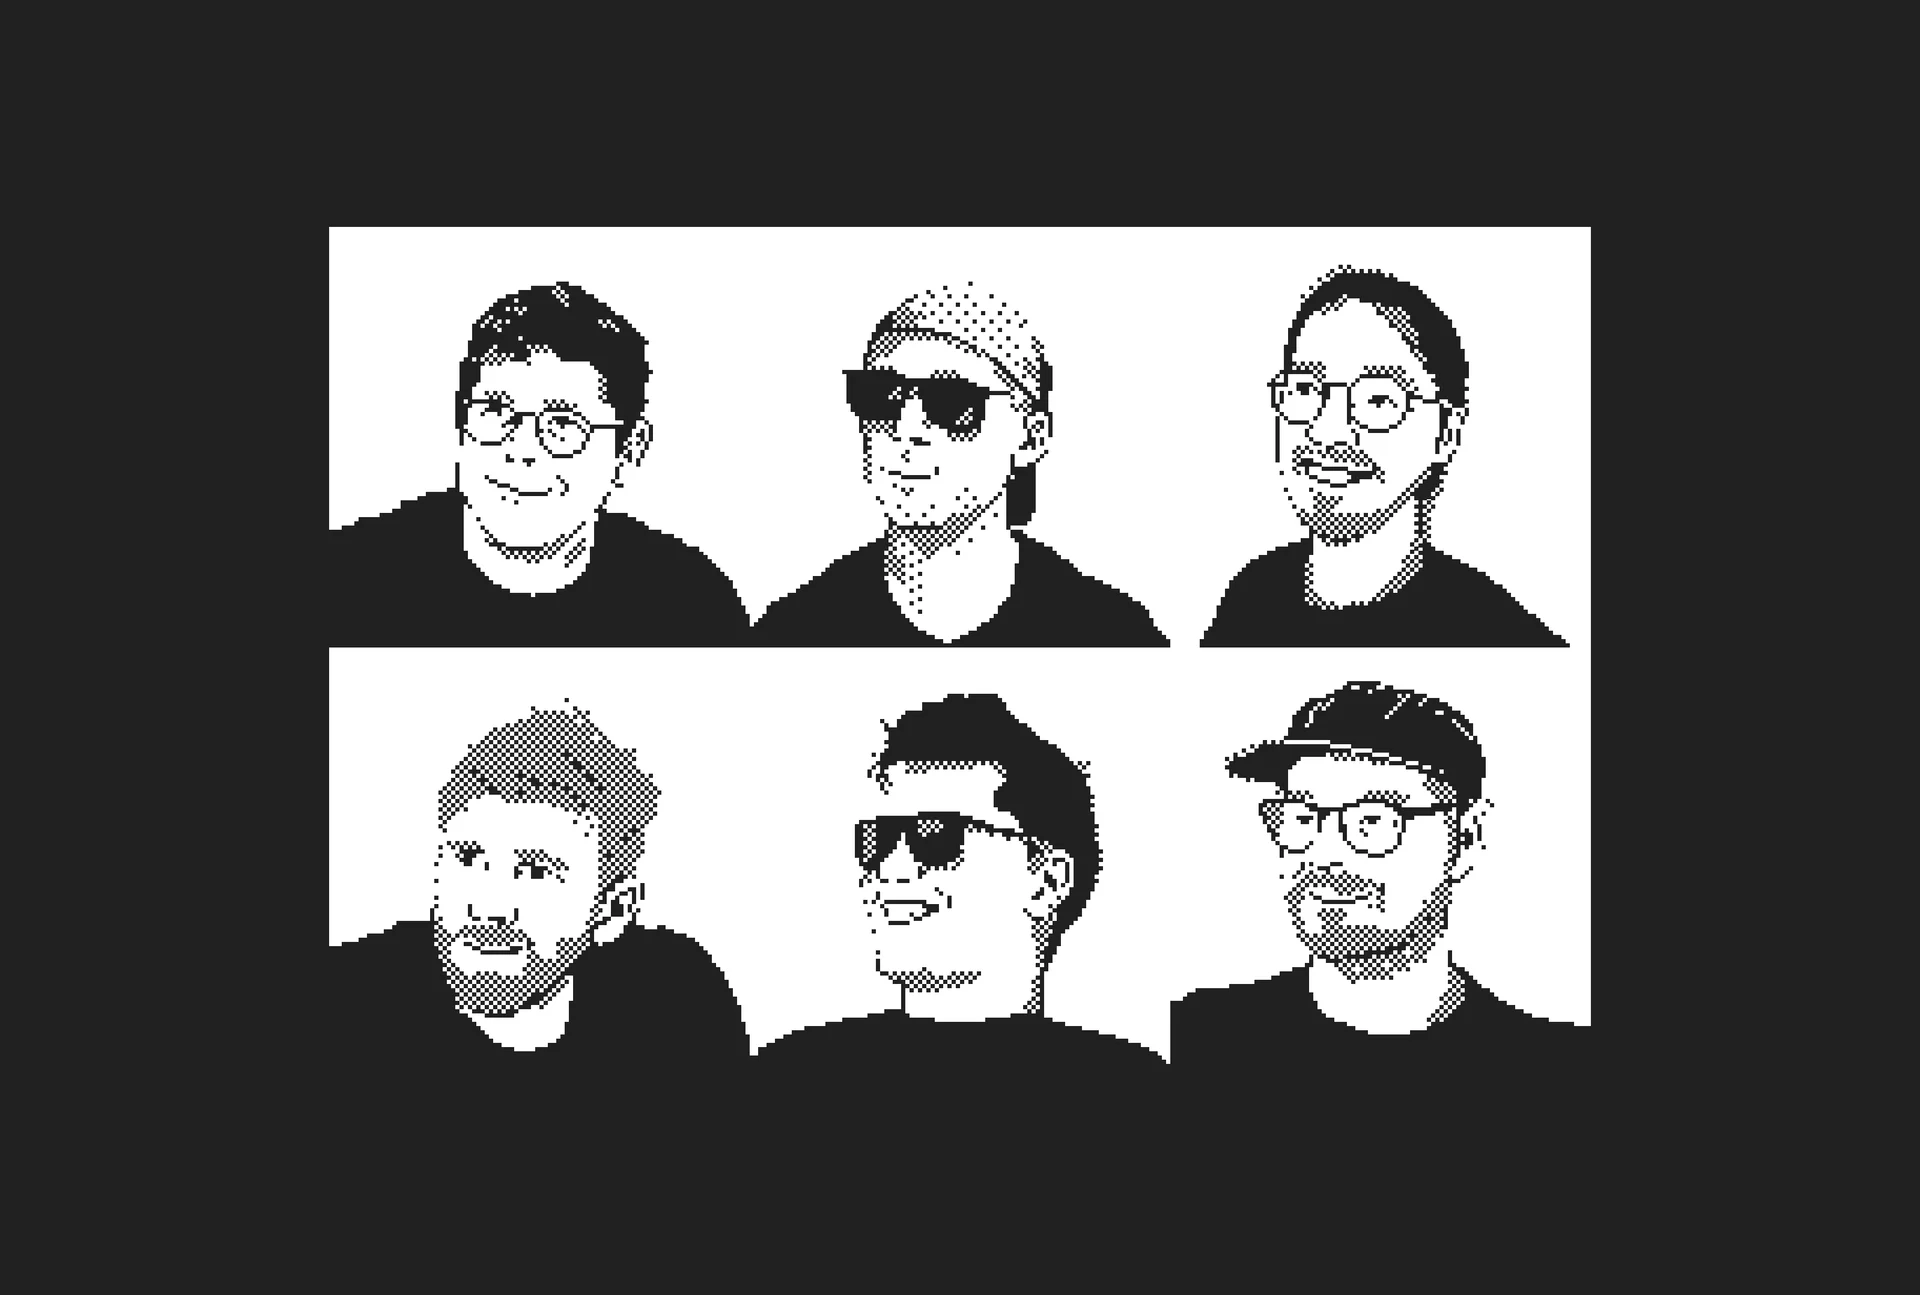
Oh, and then there's Ditherface.
Wow, I couldn't have predicted what this small project would do for me.
These started as just portraits for the team for our About Us page. And then while we were in the middle of a pivot, they turned into something I could use to compensate people who were giving us feedback on the developing application.
But it turned into soooo much more.
I've connected with some absolutely incredible people because and with these portraits.
@reijowrites @dannyjpwilliams @colderoshay @designertom @ridd_design @willking @derkolstad @stephenhaney @aidanhornsby @jonminori @jdsimcoe @igarcido @JohnPhamous @mxdelacruz to name a few.
Making these was by far the best interview incentive that I've ever used. Better than gift cards or cash or account credits. I talked to so many people who gave great feedback and dramatically helped improve Basedash while we were building it out.
And it still leads to meaningful connections. Just crazy.
State of databases
I almost forgot about state of databases.
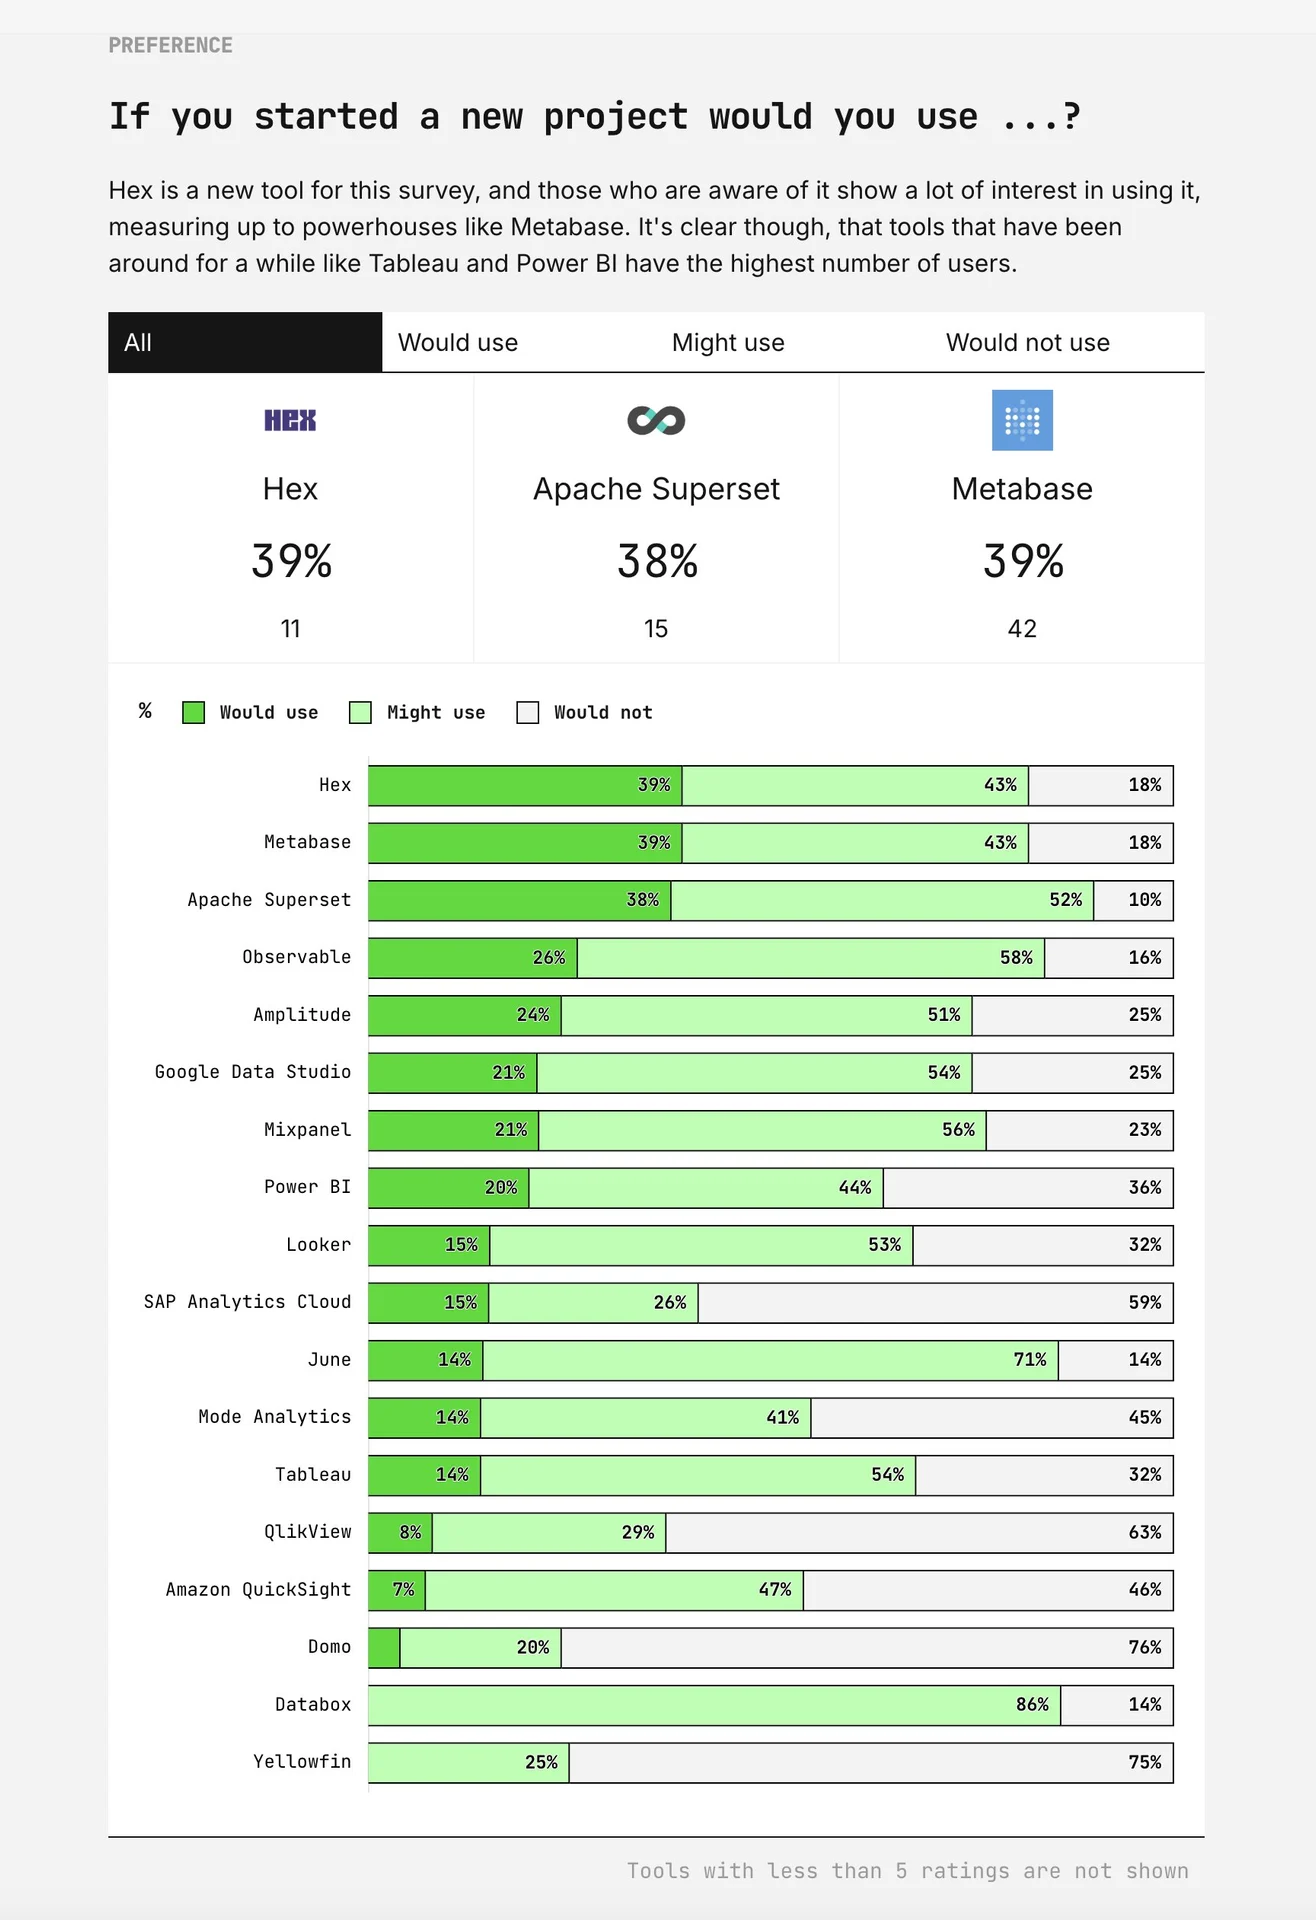
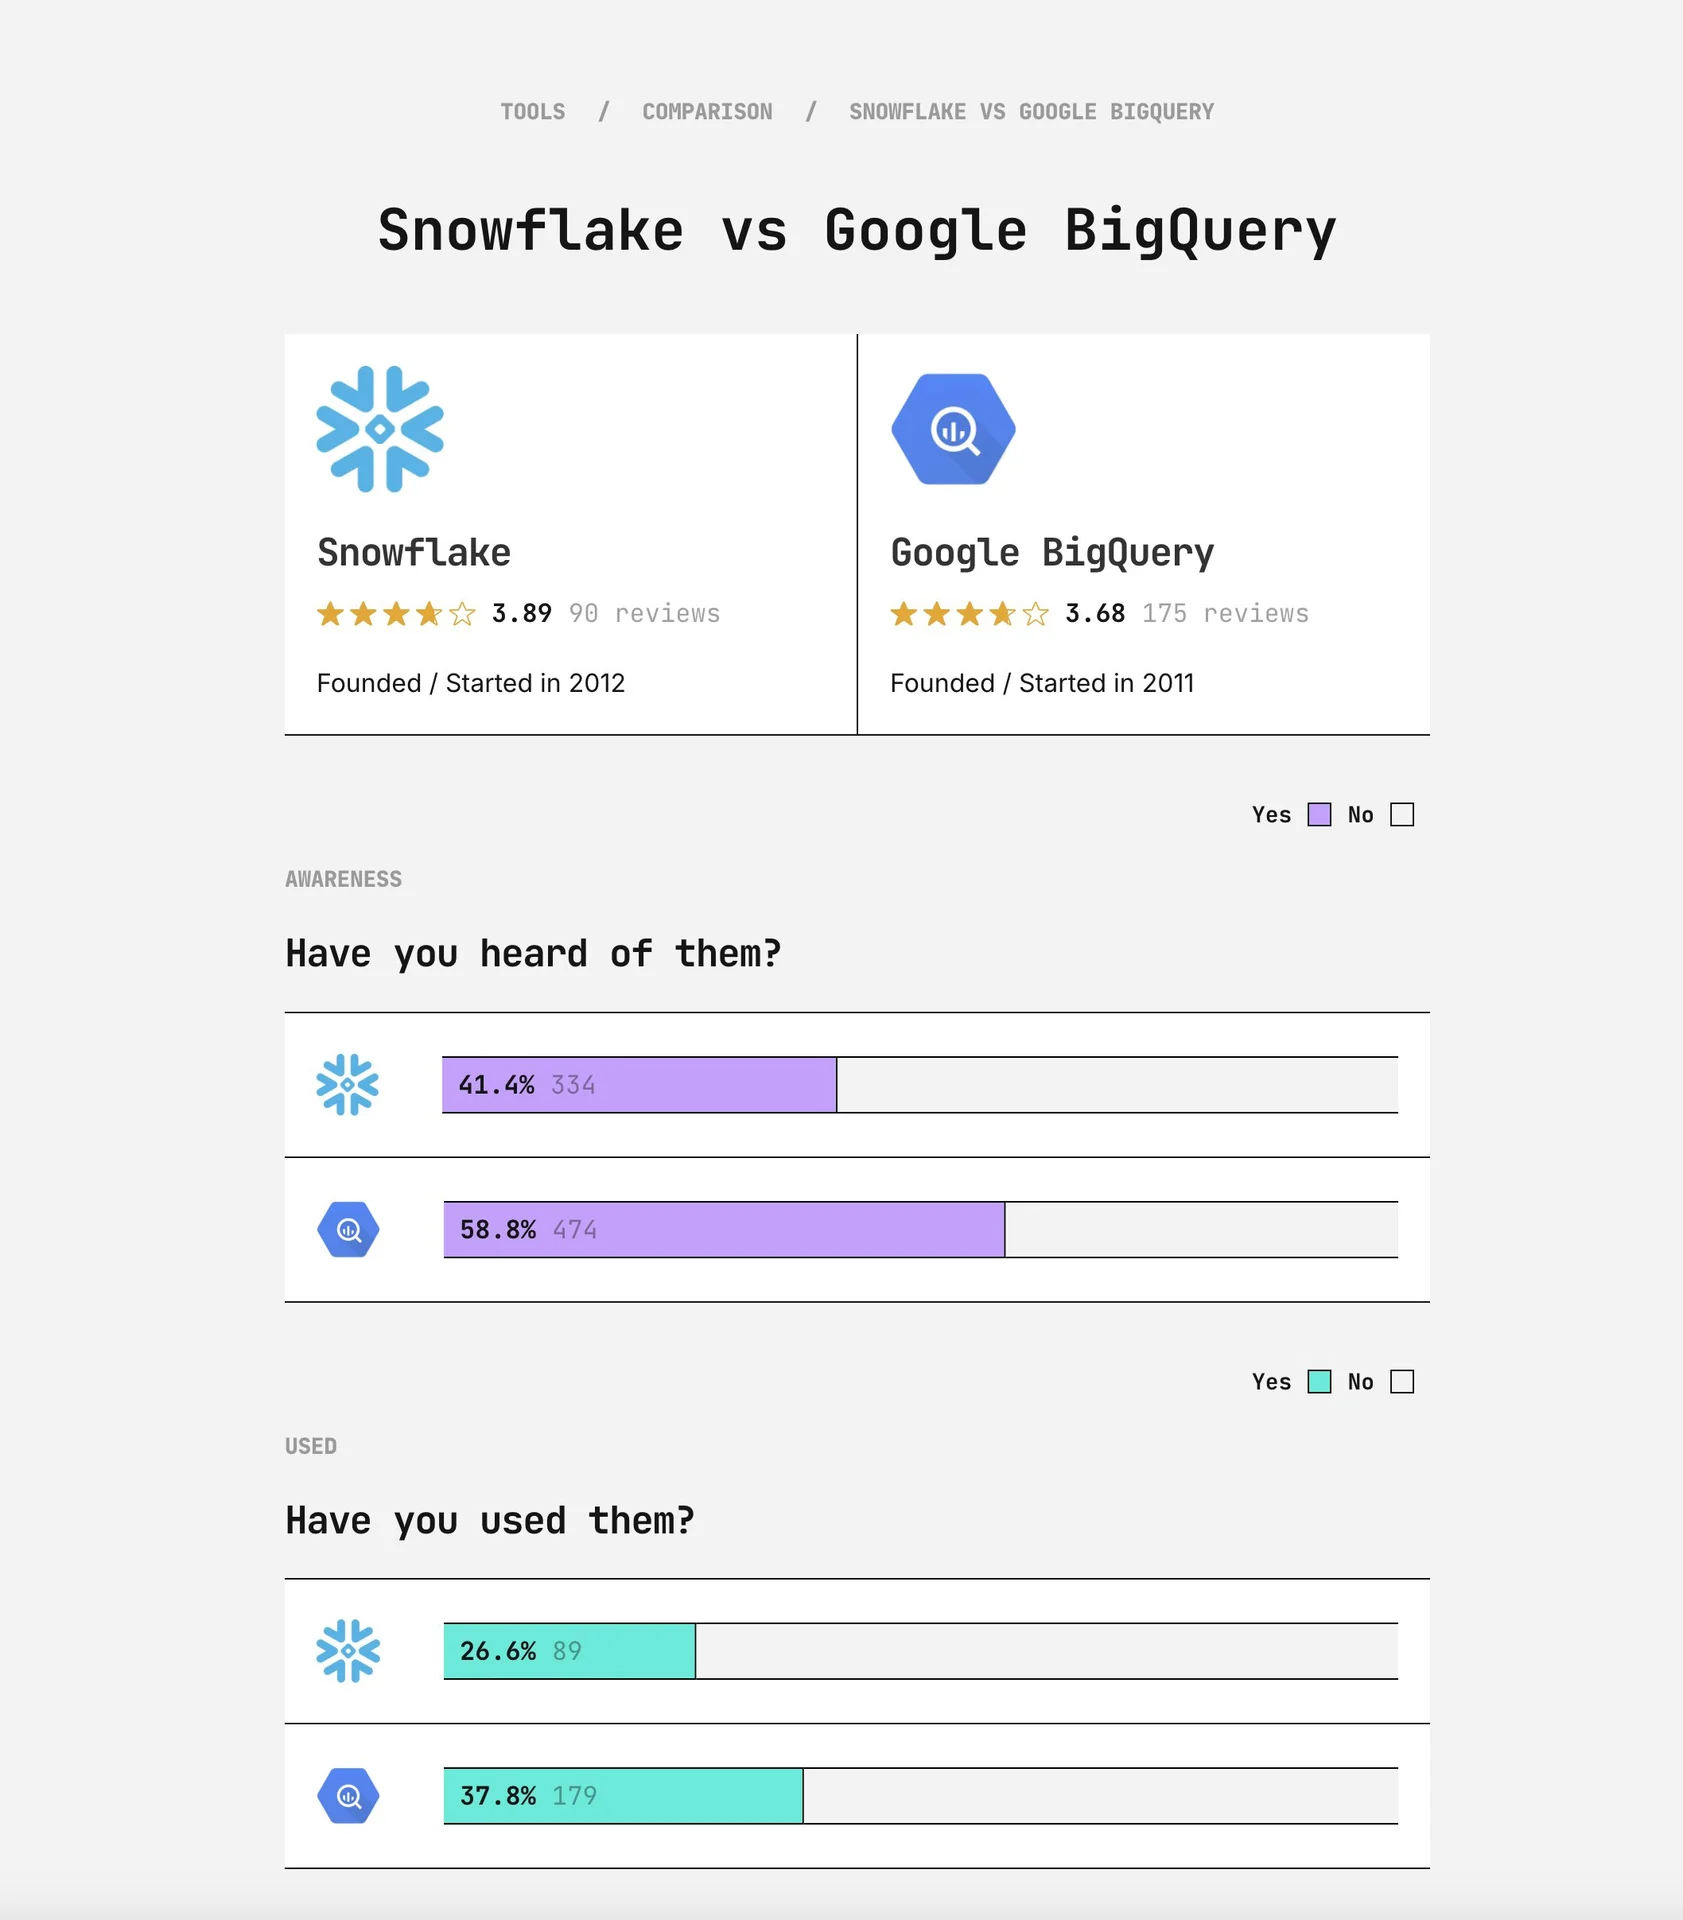
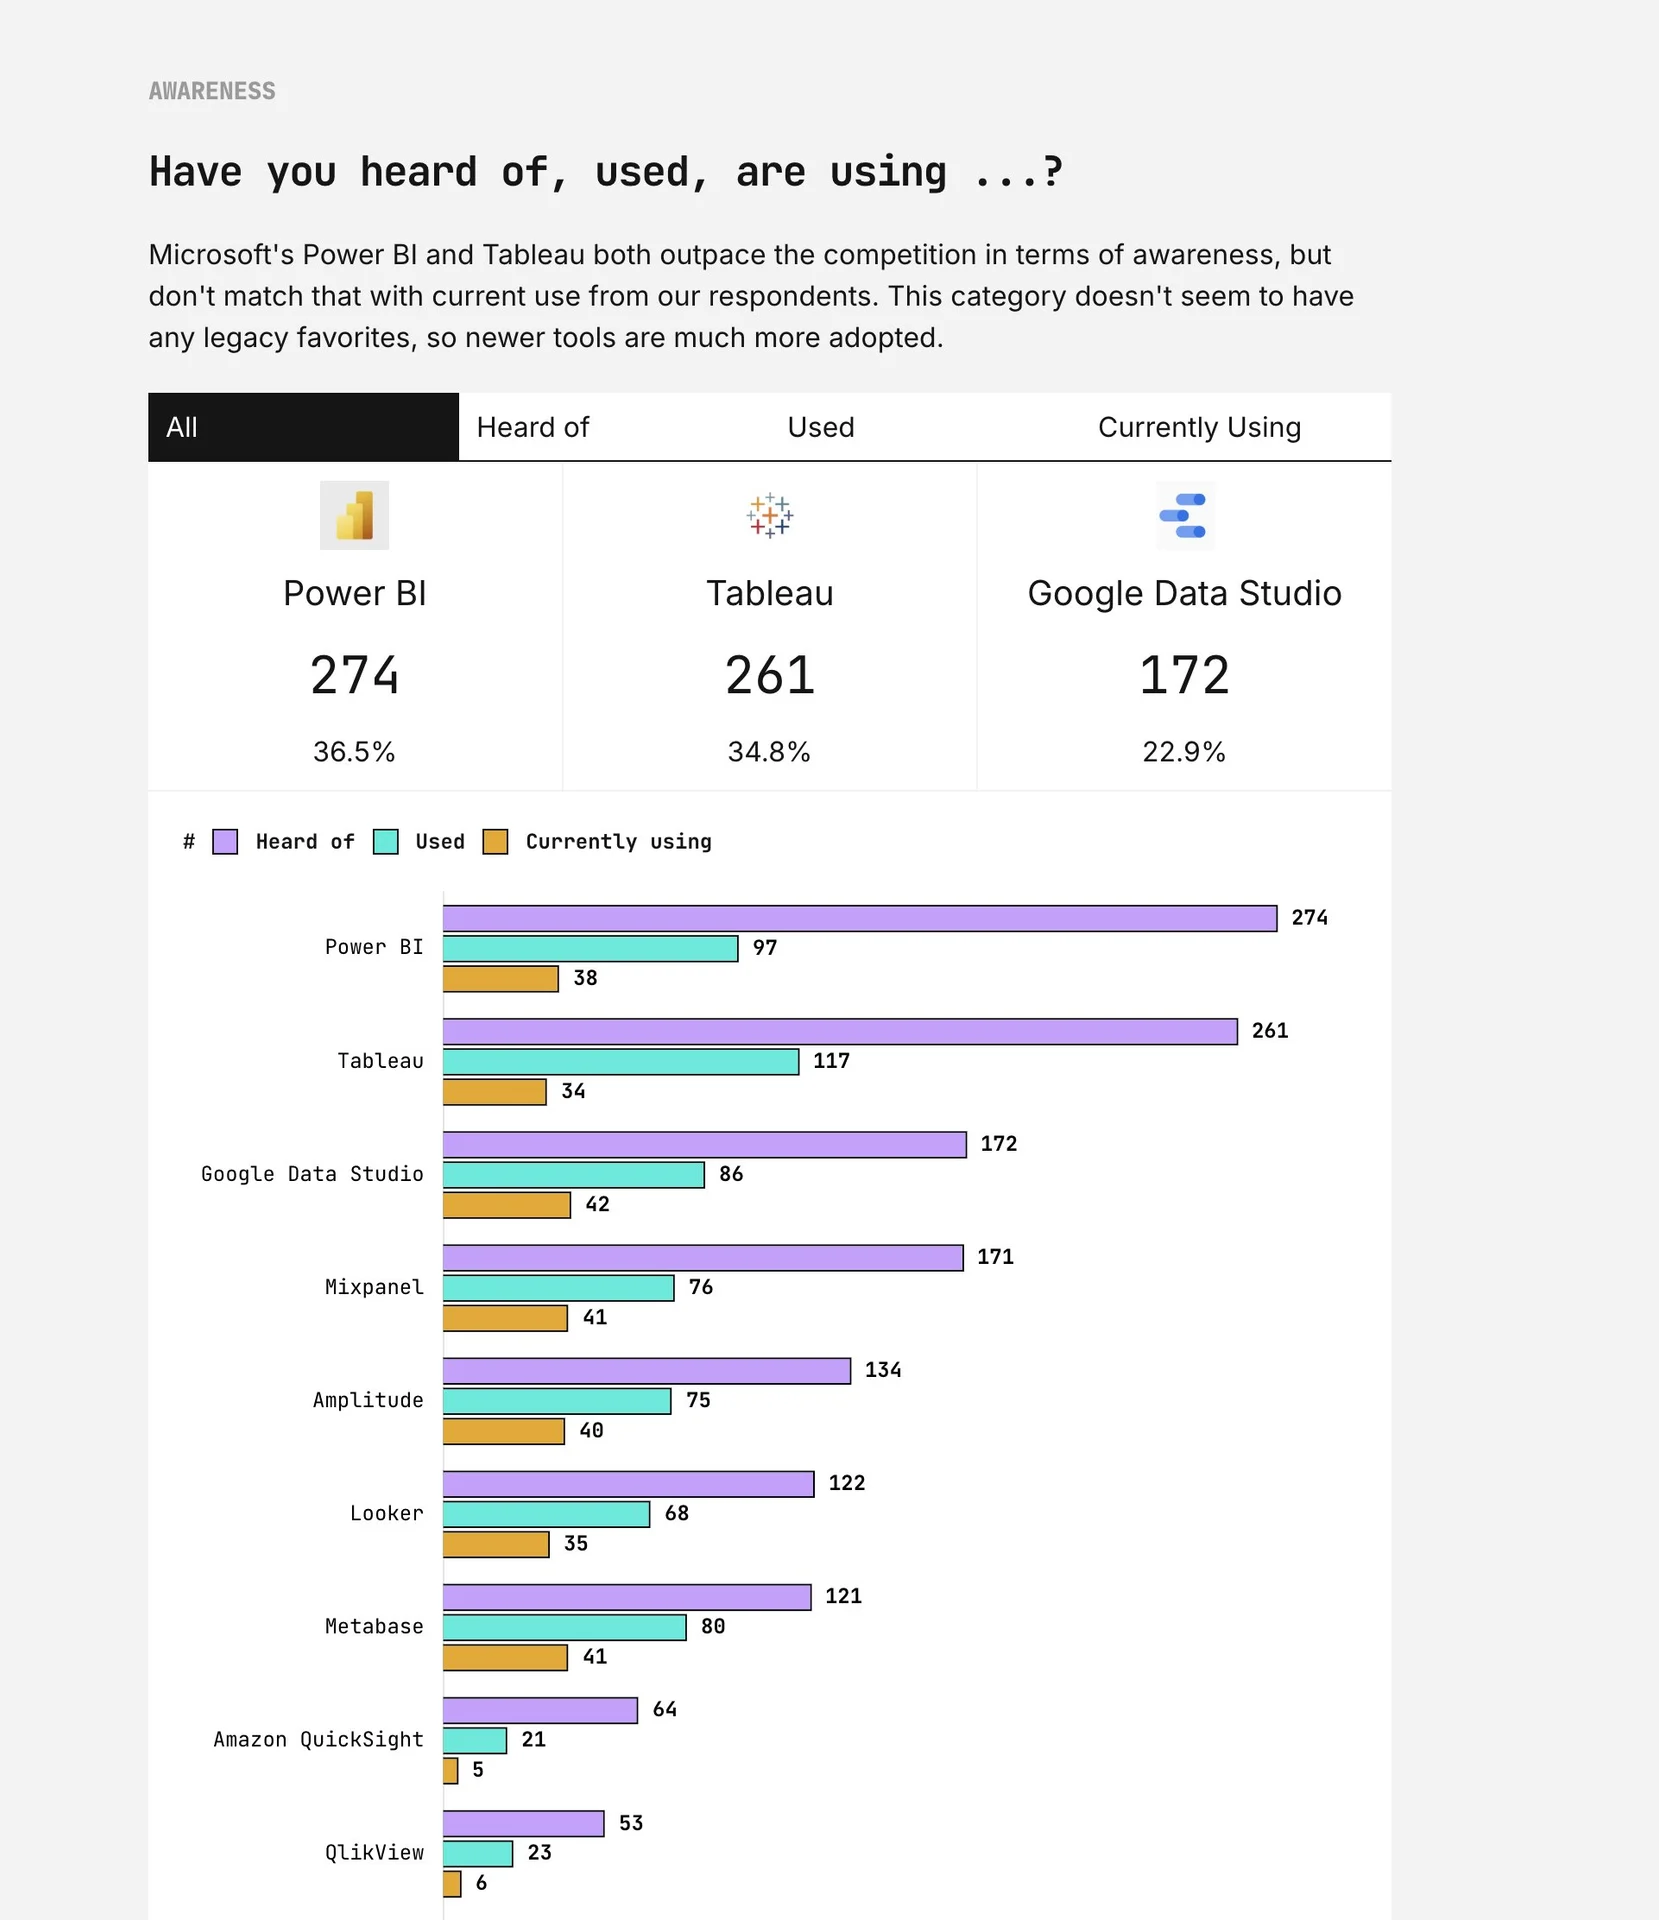
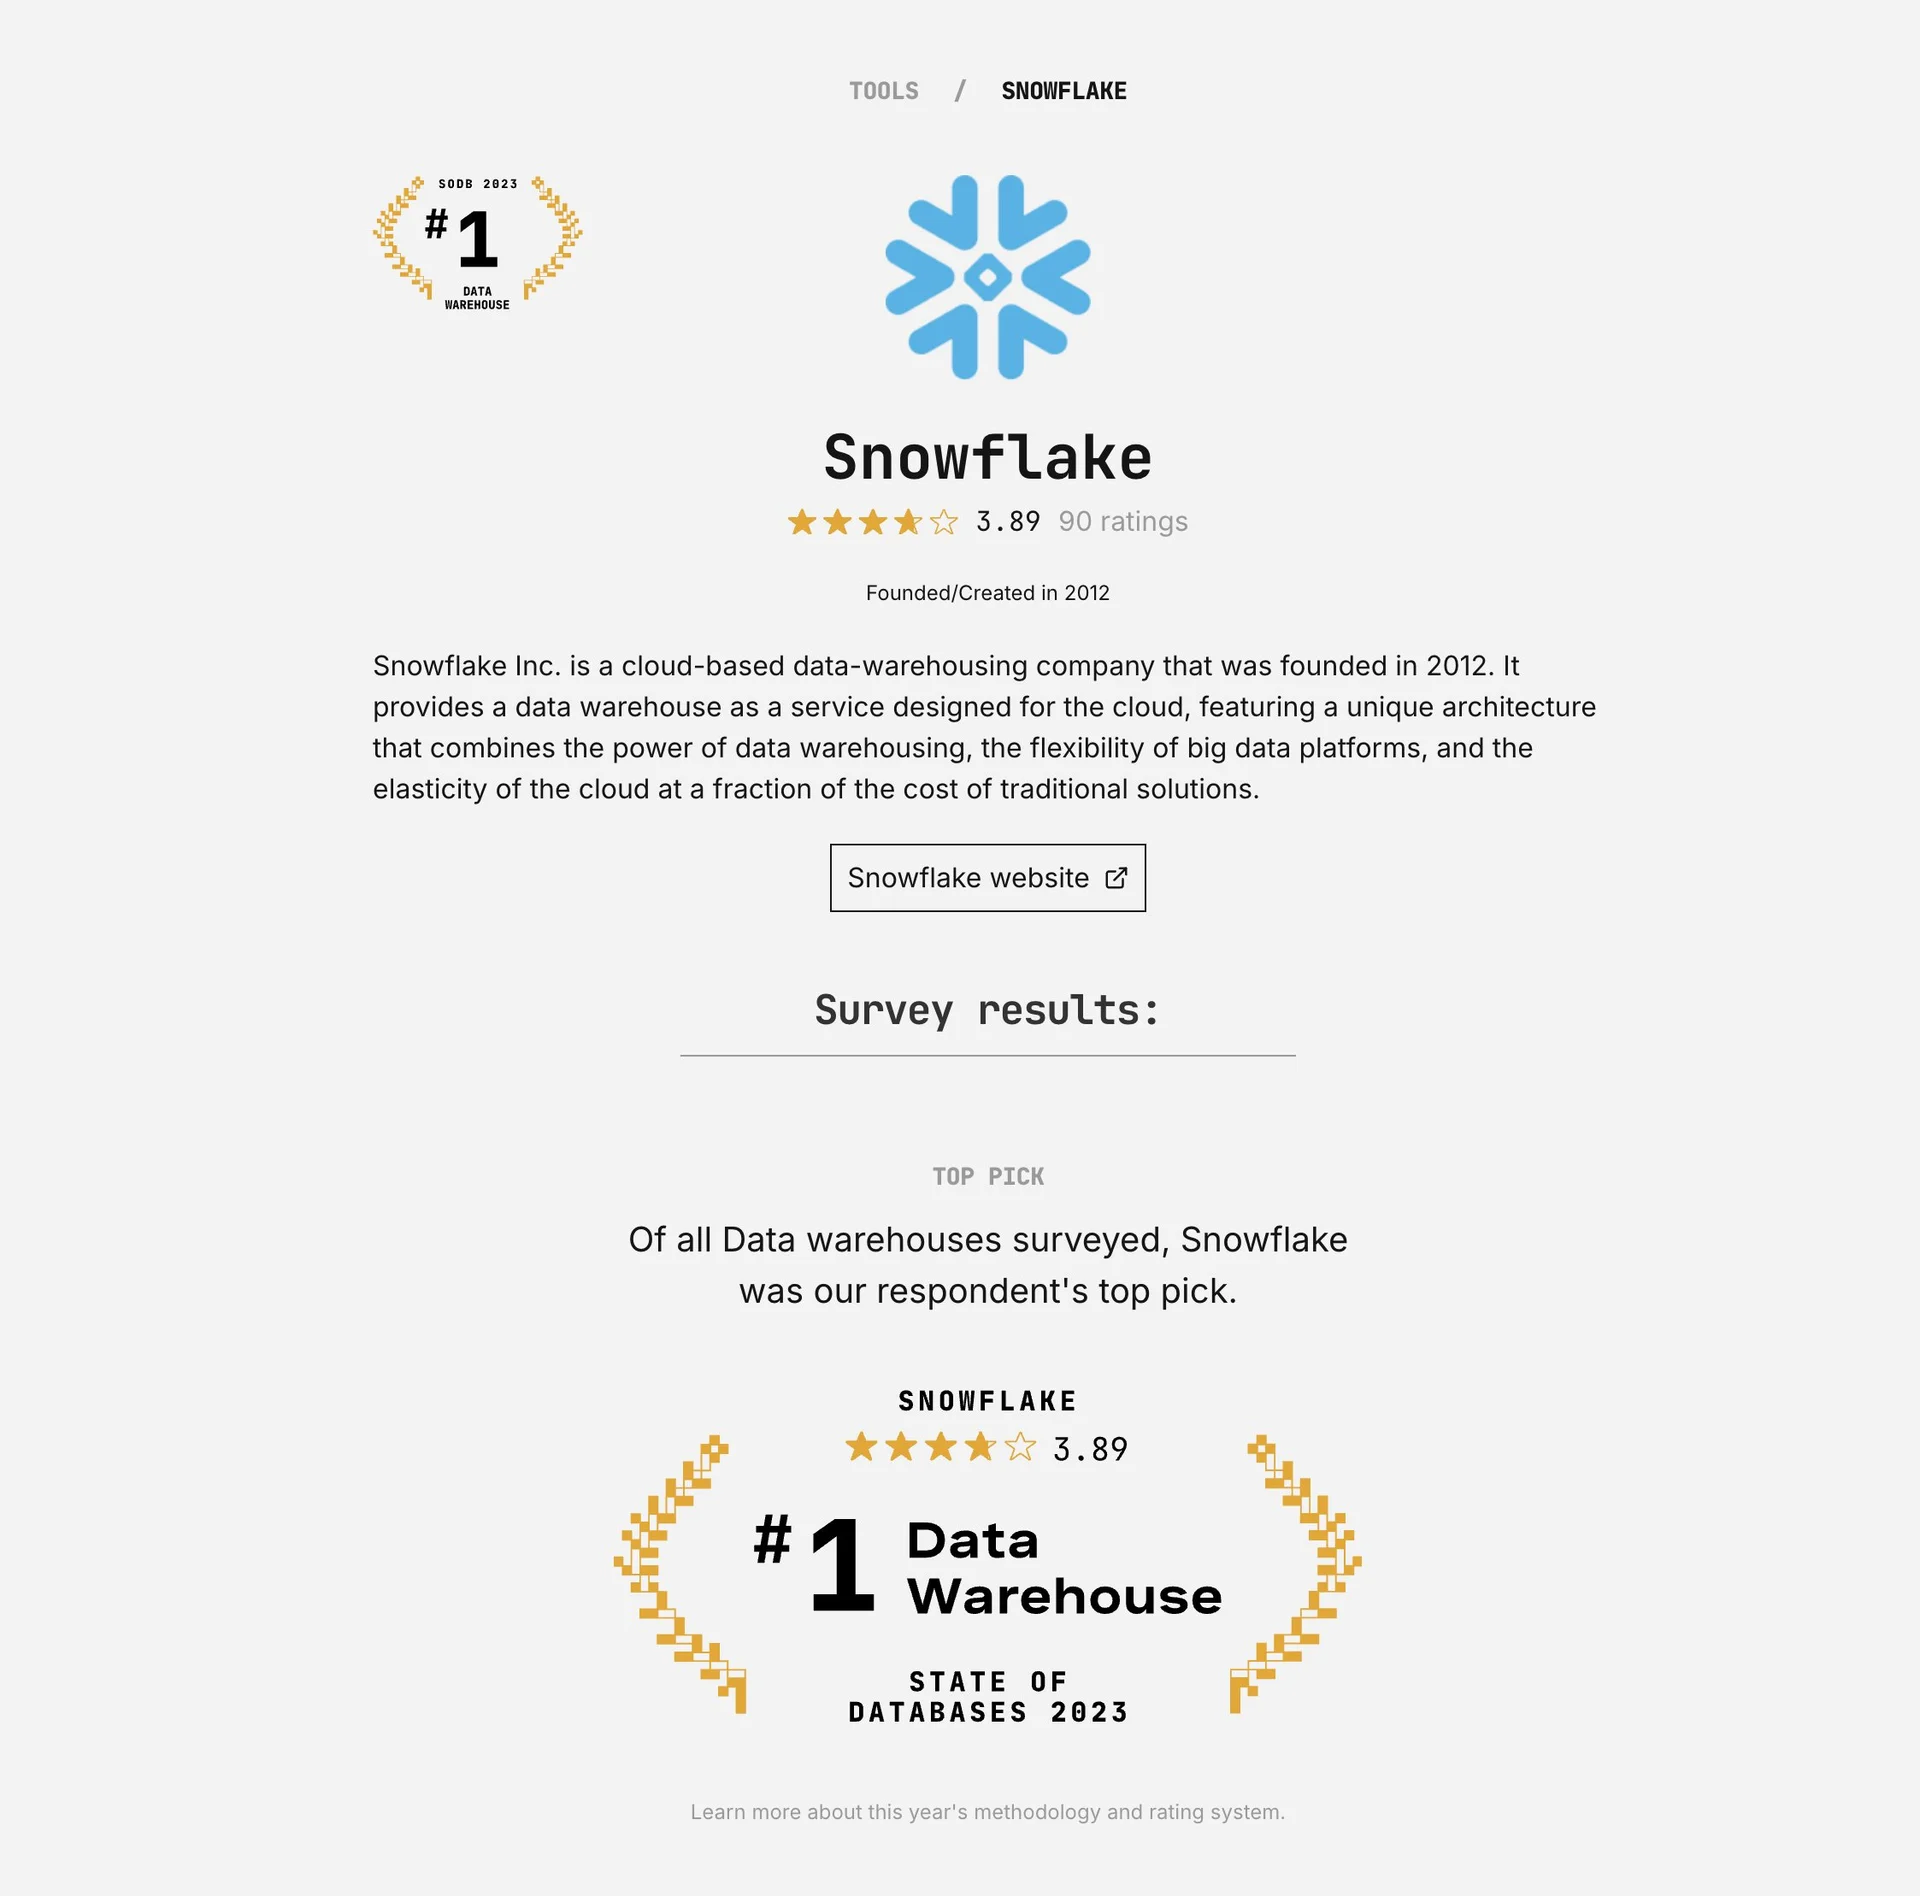
For two years, we surveyed about 2,000 people about database tools. Solicited their feedback, aggregated it, and built a couple websites with the data.
I pushed @TallyForms to the absolute limit with some of these surveys.
This data actually was used when we were thinking about pivots because we saw that the BI tools had a gap. We also worked with other teams, got sponsors, collaborated on distribution, and probably could have taken this by itself as a sole project.
Didn't end up doing it after 23 because of the pivot, and because, well, it was a massive amount of work. Kind of hard to do this by yourself, if I'm being 100% honest.
What five years taught me
I joined Basedash originally because I wasn't sure if I was good at design, and looking back five years ago, I probably wasn't. There was a ton of learning I had to do. It's a ton of learning we had to do as a company, as a team, as an individual. Who we were selling for, how to market it, how to tell people about it, how to improve, how to refine, how to give feedback.
How to network in a startup space, how to sell, how to onboard, how to understand actual user needs.
How to reinvent a product, how to use new tools, how to work remotely, how to help build a company culture, how to try everything under the sun.
Working at a startup is not easy, and it's not for the faint of heart. But it's absolutely worth it. I'm so grateful for the last five years I've had at @Basedash. I'm so grateful that I got the chance to work with the teammates that I did. I'm so grateful that I got to build something that pushed me to my limits.
It's been an incredible journey. I just want to thank my beautiful wife @joylynnlife for the support and being with me on this journey. It's been a crazy road. I'm so blessed to have a wonderful wife and incredible boys.
This might come across like it's super depressing or something like that, but I'm also really excited about my next step, so I can't wait to tell you what that is. Big changes coming.
Five years. Crazy.